Download to read offline

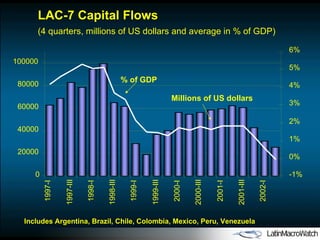

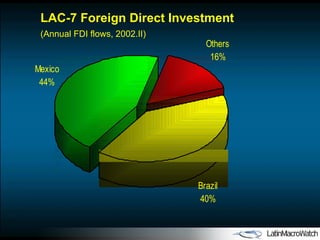
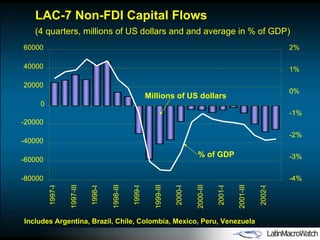

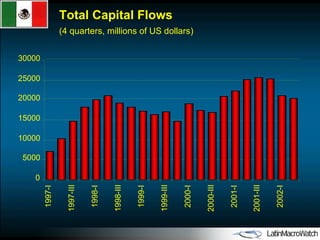
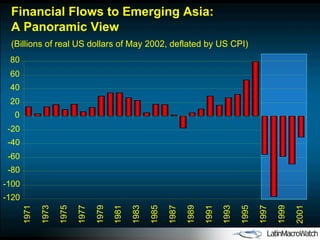
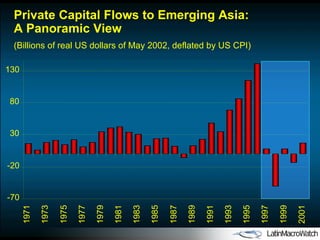
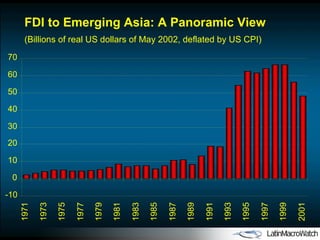
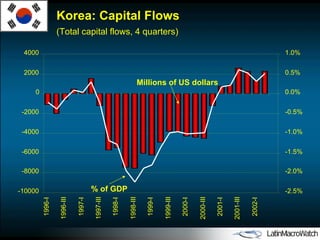
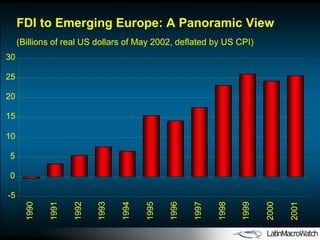
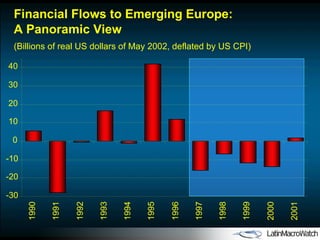

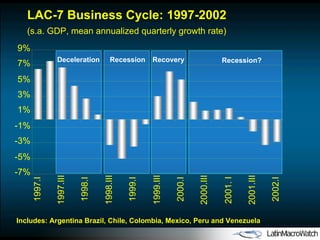
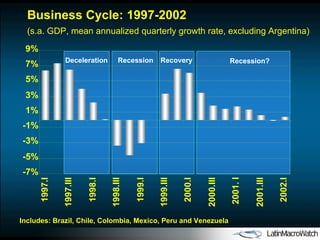
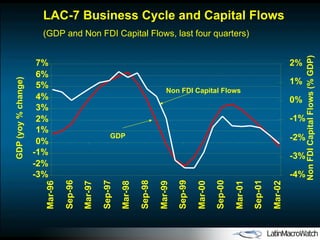
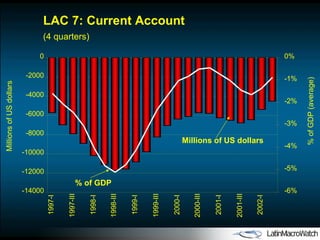
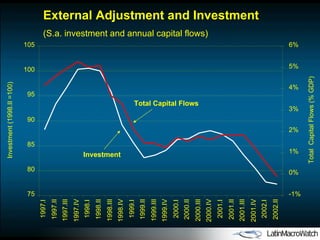
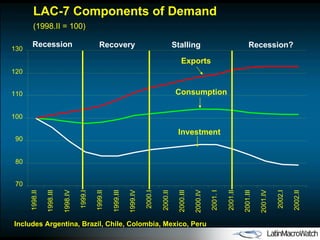
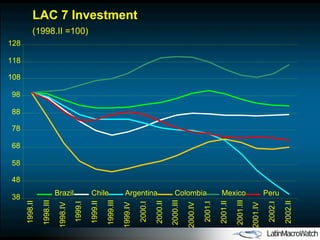
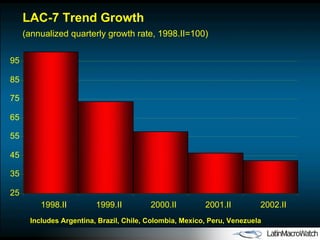
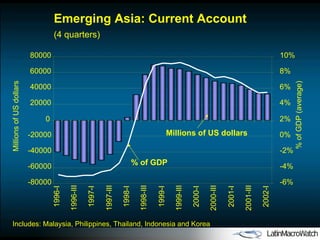
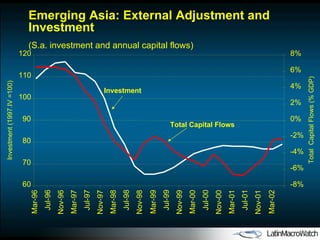
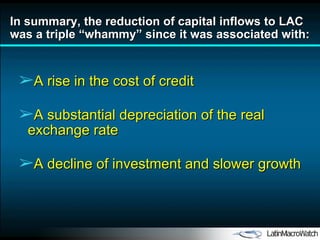

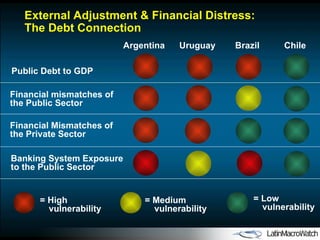
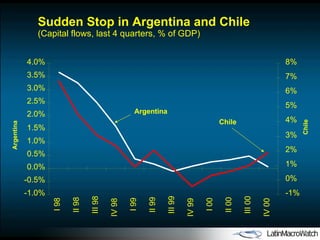
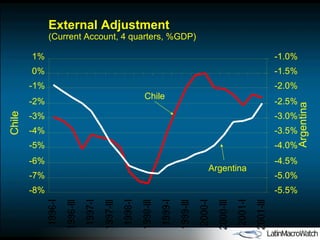
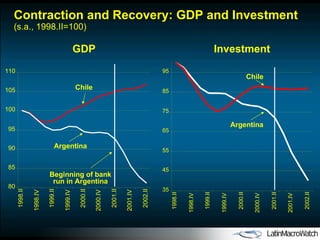

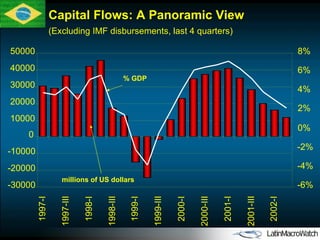
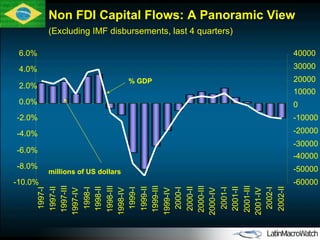
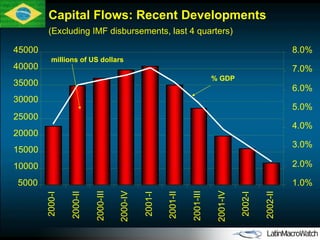
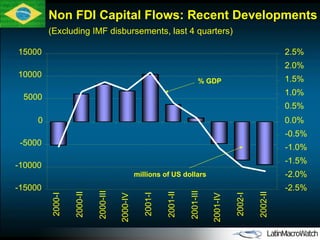
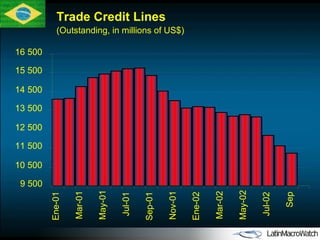
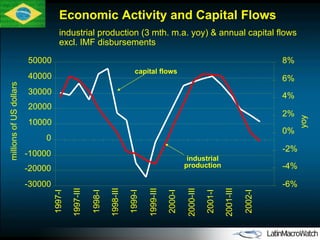
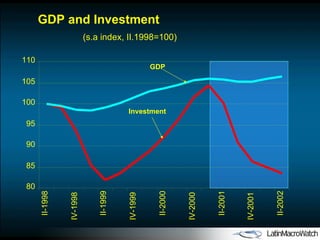
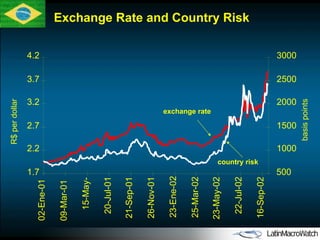
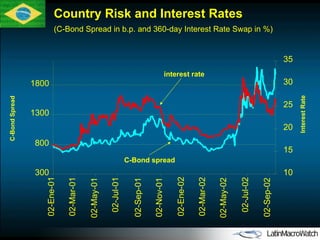
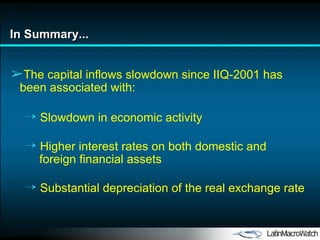
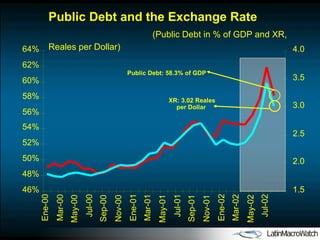
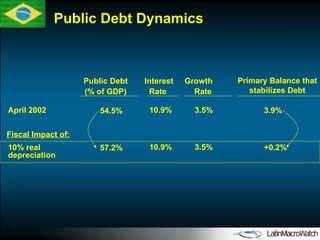
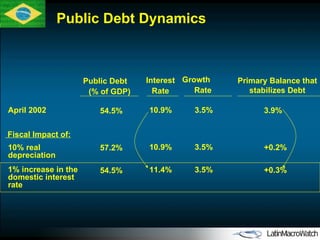
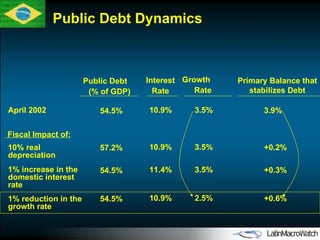


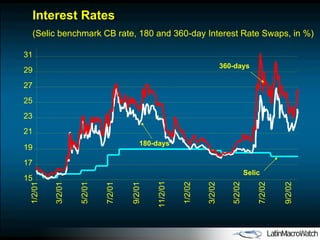
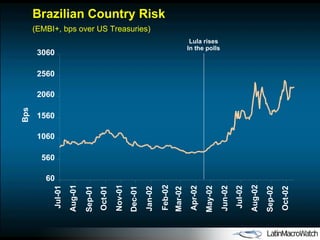
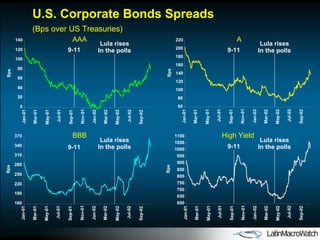


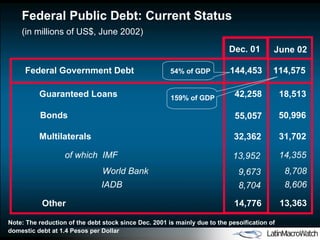
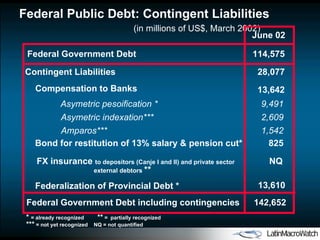
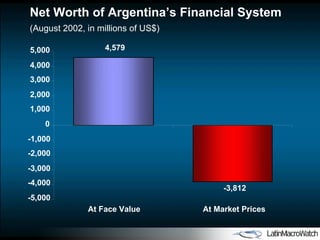
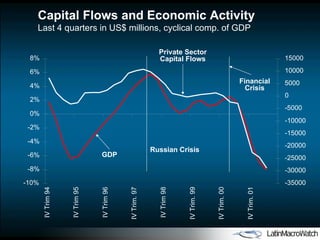
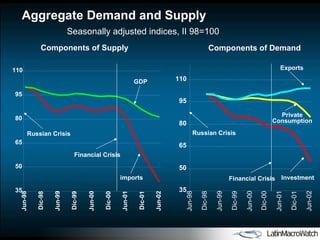
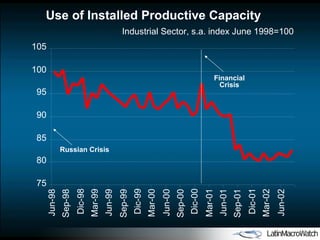
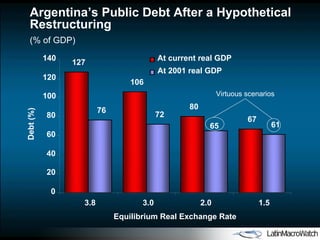
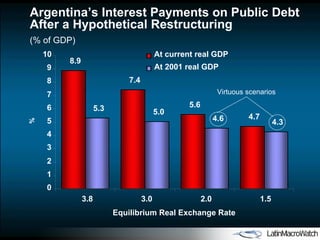
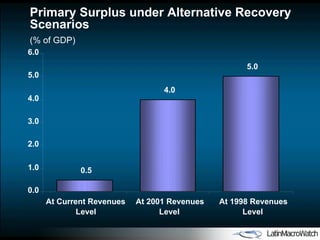

The document analyzes capital flows and economic performance in Latin America and other emerging markets between 1997-2002. It finds that Latin America experienced a "triple whammy" after a reduction in capital inflows, with higher credit costs, currency depreciation, lower investment and slower growth. Charts show trends in various countries' capital flows, current accounts, GDP and more over this period.


