The Asian FinancialCrisis
The Asian Financial Crisis
Hung-Gay Fung
Hung-Gay Fung
University of Missouri-St. Louis
University of Missouri-St. Louis
2.
Presentation Outline
Presentation Outline
Discuss briefly the behavior of the
Discuss briefly the behavior of the
Foreign Exchange (FX) of Southeast
Foreign Exchange (FX) of Southeast
Asian Countries.
Asian Countries.
Assess different factors that lead to
Assess different factors that lead to
the currency crisis.
the currency crisis.
Opportunities and Implications for
Opportunities and Implications for
U.S. companies
U.S. companies
3.
Foreign Exchange Rates
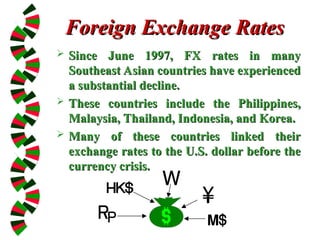
ForeignExchange Rates
Since June 1997, FX rates in many
Since June 1997, FX rates in many
Southeast Asian countries have experienced
Southeast Asian countries have experienced
a substantial decline.
a substantial decline.
These countries include the Philippines,
These countries include the Philippines,
Malaysia, Thailand, Indonesia, and Korea.
Malaysia, Thailand, Indonesia, and Korea.
Many of these countries linked their
Many of these countries linked their
exchange rates to the U.S. dollar before the
exchange rates to the U.S. dollar before the
currency crisis.
currency crisis.
4.
Change in FXrates
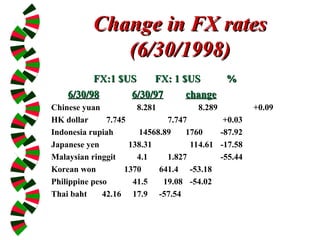
Change in FX rates
(6/30/1998)
(6/30/1998)
FX:1 $US
FX:1 $US FX: 1 $US
FX: 1 $US %
%
6/30/98
6/30/98 6/30/97
6/30/97 change
change
Chinese yuan 8.281 8.289 +0.09
HK dollar 7.745 7.747 +0.03
Indonesia rupiah 14568.89 1760 -87.92
Japanese yen 138.31 114.61 -17.58
Malaysian ringgit 4.1 1.827 -55.44
Korean won 1370 641.4 -53.18
Philippine peso 41.5 19.08 -54.02
Thai baht 42.16 17.9 -57.54
5.
Immediate Results ofCrisis
Immediate Results of Crisis
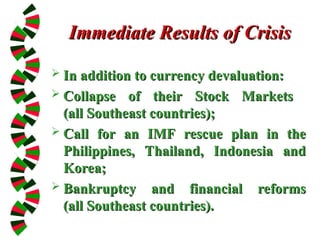
In addition to currency devaluation:
In addition to currency devaluation:
Collapse of their Stock Markets
Collapse of their Stock Markets
(all Southeast countries);
(all Southeast countries);
Call for an IMF rescue plan in the
Call for an IMF rescue plan in the
Philippines, Thailand, Indonesia and
Philippines, Thailand, Indonesia and
Korea;
Korea;
Bankruptcy and financial reforms
Bankruptcy and financial reforms
(all Southeast countries).
(all Southeast countries).
6.
What Happens toCapital
What Happens to Capital
Flows?
Flows?
1994
1994 1995
1995 1996
1996 1997*
1997*
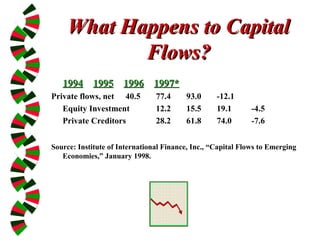
Private flows, net 40.5 77.4 93.0 -12.1
Equity Investment 12.2 15.5 19.1 -4.5
Private Creditors 28.2 61.8 74.0 -7.6
Source: Institute of International Finance, Inc., “Capital Flows to Emerging
Economies,” January 1998.
7.
Reasons for theCurrency
Reasons for the Currency
Crisis
Crisis
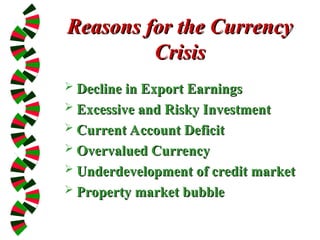
Decline in Export Earnings
Decline in Export Earnings
Excessive and Risky Investment
Excessive and Risky Investment
Current Account Deficit
Current Account Deficit
Overvalued Currency
Overvalued Currency
Underdevelopment of credit market
Underdevelopment of credit market
Property market bubble
Property market bubble
8.
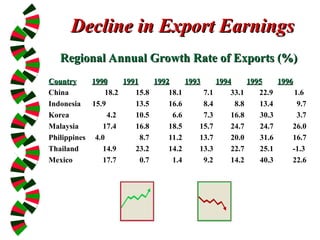
Regional Annual GrowthRate of Exports (%)
Regional Annual Growth Rate of Exports (%)
Country
Country 1990
1990 1991
1991 1992
1992 1993
1993 1994
1994 1995
1995 1996
1996
China 18.2 15.8 18.1 7.1 33.1 22.9 1.6
Indonesia 15.9 13.5 16.6 8.4 8.8 13.4 9.7
Korea 4.2 10.5 6.6 7.3 16.8 30.3 3.7
Malaysia 17.4 16.8 18.5 15.7 24.7 24.7 26.0
Philippines 4.0 8.7 11.2 13.7 20.0 31.6 16.7
Thailand 14.9 23.2 14.2 13.3 22.7 25.1 -1.3
Mexico 17.7 0.7 1.4 9.2 14.2 40.3 22.6
Decline in Export Earnings
Decline in Export Earnings
9.
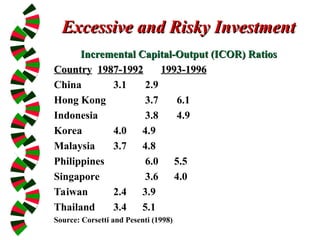
Excessive and RiskyInvestment
Excessive and Risky Investment
Incremental Capital-Output (ICOR) Ratios
Incremental Capital-Output (ICOR) Ratios
Country
Country 1987-1992
1987-1992 1993-1996
1993-1996
China 3.1 2.9
Hong Kong 3.7 6.1
Indonesia 3.8 4.9
Korea 4.0 4.9
Malaysia 3.7 4.8
Philippines 6.0 5.5
Singapore 3.6 4.0
Taiwan 2.4 3.9
Thailand 3.4 5.1
Source: Corsetti and Pesenti (1998)
10.
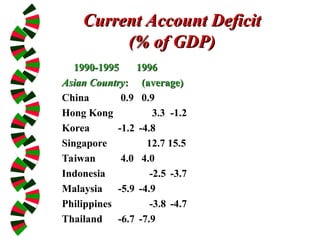
Current Account Deficit
CurrentAccount Deficit
(% of GDP)
(% of GDP)
1990-1995
1990-1995 1996
1996
Asian Country
Asian Country:
: (average)
(average)
China 0.9 0.9
Hong Kong 3.3 -1.2
Korea -1.2 -4.8
Singapore 12.7 15.5
Taiwan 4.0 4.0
Indonesia -2.5 -3.7
Malaysia -5.9 -4.9
Philippines -3.8 -4.7
Thailand -6.7 -7.9
11.
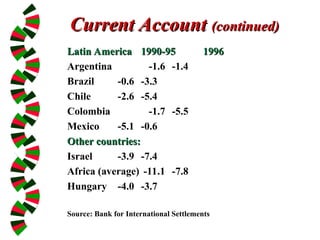
Current Account
Current Account(continued)
(continued)
Latin America
Latin America 1990-95
1990-95 1996
1996
Argentina -1.6 -1.4
Brazil -0.6 -3.3
Chile -2.6 -5.4
Colombia -1.7 -5.5
Mexico -5.1 -0.6
Other countries:
Other countries:
Israel -3.9 -7.4
Africa (average) -11.1 -7.8
Hungary -4.0 -3.7
Source: Bank for International Settlements
12.
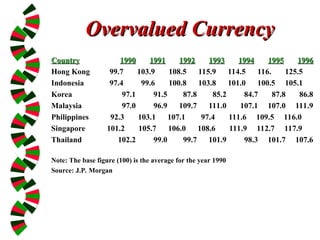
Overvalued Currency
Overvalued Currency
Country
Country1990
1990 1991
1991 1992
1992 1993
1993 1994
1994 1995
1995 1996
1996
Hong Kong 99.7 103.9 108.5 115.9 114.5 116. 125.5
Indonesia 97.4 99.6 100.8 103.8 101.0 100.5 105.1
Korea 97.1 91.5 87.8 85.2 84.7 87.8 86.8
Malaysia 97.0 96.9 109.7 111.0 107.1 107.0 111.9
Philippines 92.3 103.1 107.1 97.4 111.6 109.5 116.0
Singapore 101.2 105.7 106.0 108.6 111.9 112.7 117.9
Thailand 102.2 99.0 99.7 101.9 98.3 101.7 107.6
Note: The base figure (100) is the average for the year 1990
Source: J.P. Morgan
13.
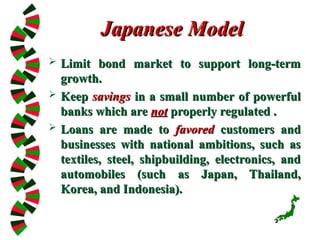
Japanese Model
Japanese Model
Limit bond market to support long-term
Limit bond market to support long-term
growth.
growth.
Keep
Keep savings
savings in a small number of powerful
in a small number of powerful
banks which are
banks which are not
not properly regulated .
properly regulated .
Loans are made to
Loans are made to favored
favored customers and
customers and
businesses with national ambitions, such as
businesses with national ambitions, such as
textiles, steel, shipbuilding, electronics, and
textiles, steel, shipbuilding, electronics, and
automobiles (such as Japan, Thailand,
automobiles (such as Japan, Thailand,
Korea, and Indonesia).
Korea, and Indonesia).
14.
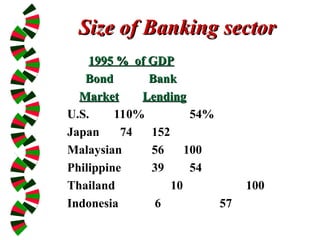
Size of Bankingsector
Size of Banking sector
1995 % of GDP
1995 % of GDP
Bond
Bond Bank
Bank
Market
Market Lending
Lending
U.S. 110% 54%
Japan 74 152
Malaysian 56 100
Philippine 39 54
Thailand 10 100
Indonesia 6 57
15.
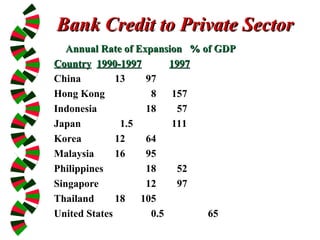
Bank Credit toPrivate Sector
Bank Credit to Private Sector
Annual Rate of Expansion
Annual Rate of Expansion % of GDP
% of GDP
Country
Country 1990-1997
1990-1997 1997
1997
China 13 97
Hong Kong 8 157
Indonesia 18 57
Japan 1.5 111
Korea 12 64
Malaysia 16 95
Philippines 18 52
Singapore 12 97
Thailand 18 105
United States 0.5 65
16.
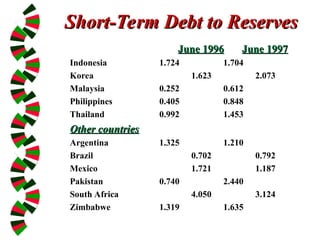
June 1996
June 1996June 1997
June 1997
Indonesia 1.724 1.704
Korea 1.623 2.073
Malaysia 0.252 0.612
Philippines 0.405 0.848
Thailand 0.992 1.453
Other countries
Other countries
Argentina 1.325 1.210
Brazil 0.702 0.792
Mexico 1.721 1.187
Pakistan 0.740 2.440
South Africa 4.050 3.124
Zimbabwe 1.319 1.635
Short-Term Debt to Reserves
Short-Term Debt to Reserves
17.
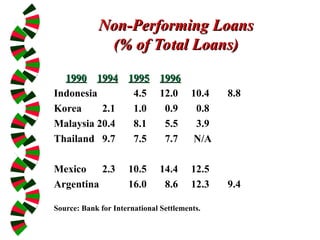
Non-Performing Loans
Non-Performing Loans
(%of Total Loans)
(% of Total Loans)
1990
1990 1994
1994 1995
1995 1996
1996
Indonesia 4.5 12.0 10.4 8.8
Korea 2.1 1.0 0.9 0.8
Malaysia 20.4 8.1 5.5 3.9
Thailand 9.7 7.5 7.7 N/A
Mexico 2.3 10.5 14.4 12.5
Argentina 16.0 8.6 12.3 9.4
Source: Bank for International Settlements.
18.
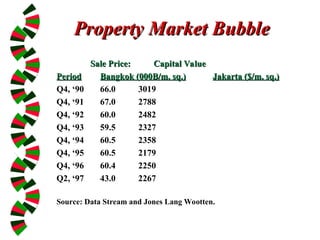
Property Market Bubble
PropertyMarket Bubble
Sale Price:
Sale Price: Capital Value
Capital Value
Period
Period Bangkok (000B/m. sq.)
Bangkok (000B/m. sq.) Jakarta ($/m. sq.)
Jakarta ($/m. sq.)
Q4, ‘90 66.0 3019
Q4, ‘91 67.0 2788
Q4, ‘92 60.0 2482
Q4, ‘93 59.5 2327
Q4, ‘94 60.5 2358
Q4, ‘95 60.5 2179
Q4, ‘96 60.4 2250
Q2, ‘97 43.0 2267
Source: Data Stream and Jones Lang Wootten.
19.
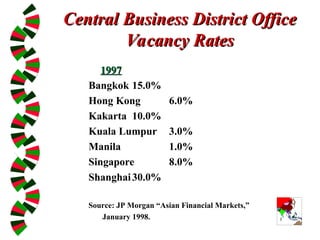
Central Business DistrictOffice
Central Business District Office
Vacancy Rates
Vacancy Rates
1997
1997
Bangkok 15.0%
Hong Kong 6.0%
Kakarta 10.0%
Kuala Lumpur 3.0%
Manila 1.0%
Singapore 8.0%
Shanghai30.0%
Source: JP Morgan “Asian Financial Markets,”
January 1998.
20.
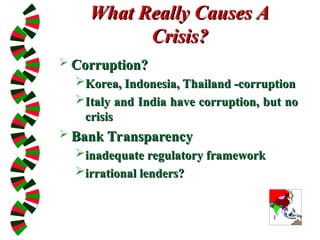
What Really CausesA
What Really Causes A
Crisis?
Crisis?
Corruption?
Corruption?
Korea, Indonesia, Thailand -corruption
Korea, Indonesia, Thailand -corruption
Italy and India have corruption, but no
Italy and India have corruption, but no
crisis
crisis
Bank Transparency
Bank Transparency
inadequate regulatory framework
inadequate regulatory framework
irrational lenders?
irrational lenders?
21.
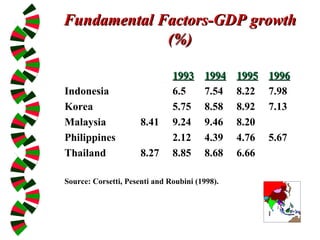
Fundamental Factors-GDP growth
FundamentalFactors-GDP growth
(%)
(%)
1993
1993 1994
1994 1995
1995 1996
1996
Indonesia 6.5 7.54 8.22 7.98
Korea 5.75 8.58 8.92 7.13
Malaysia 8.41 9.24 9.46 8.20
Philippines 2.12 4.39 4.76 5.67
Thailand 8.27 8.85 8.68 6.66
Source: Corsetti, Pesenti and Roubini (1998).
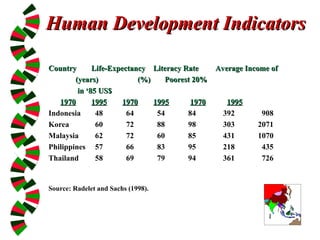
Human Development Indicators
HumanDevelopment Indicators
Country
Country Life-Expectancy
Life-Expectancy Literacy Rate
Literacy Rate Average Income of
Average Income of
(years)
(years) (%)
(%) Poorest 20%
Poorest 20%
in ‘85 US$
in ‘85 US$
1970
1970 1995
1995 1970
1970 1995
1995 1970
1970 1995
1995
Indonesia 48 64 54 84 392 908
Korea 60 72 88 98 303 2071
Malaysia 62 72 60 85 431 1070
Philippines 57 66 83 95 218 435
Thailand 58 69 79 94 361 726
Source: Radelet and Sachs (1998).
25.
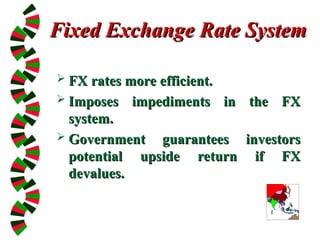
Fixed Exchange RateSystem
Fixed Exchange Rate System
FX rates more efficient.
FX rates more efficient.
Imposes impediments in the FX
Imposes impediments in the FX
system.
system.
Government guarantees investors
Government guarantees investors
potential upside return if FX
potential upside return if FX
devalues.
devalues.
26.
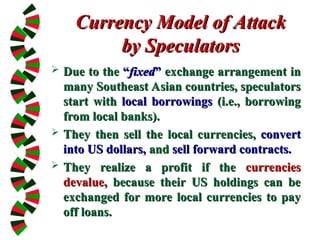
Currency Model ofAttack
Currency Model of Attack
by Speculators
by Speculators
Due to the
Due to the “
“fixed
fixed”
” exchange arrangement in
exchange arrangement in
many Southeast Asian countries, speculators
many Southeast Asian countries, speculators
start with
start with local borrowings
local borrowings (i.e., borrowing
(i.e., borrowing
from local banks).
from local banks).
They then sell the local currencies,
They then sell the local currencies, convert
convert
into US dollars,
into US dollars, and
and sell forward contracts.
sell forward contracts.
They realize a profit if the
They realize a profit if the currencies
currencies
devalue,
devalue, because their US holdings can be
because their US holdings can be
exchanged for more local currencies to pay
exchanged for more local currencies to pay
off loans.
off loans.
27.
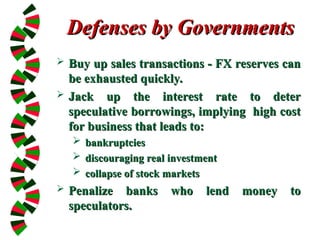
Defenses by Governments
Defensesby Governments
Buy up sales transactions - FX reserves can
Buy up sales transactions - FX reserves can
be exhausted quickly.
be exhausted quickly.
Jack up the interest rate to deter
Jack up the interest rate to deter
speculative borrowings, implying high cost
speculative borrowings, implying high cost
for business that leads to:
for business that leads to:
bankruptcies
bankruptcies
discouraging real investment
discouraging real investment
collapse of stock markets
collapse of stock markets
Penalize banks who lend money to
Penalize banks who lend money to
speculators.
speculators.
28.
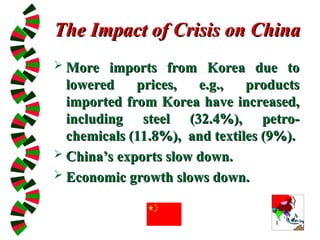
The Impact ofCrisis on China
The Impact of Crisis on China
More imports from Korea due to
More imports from Korea due to
lowered prices, e.g., products
lowered prices, e.g., products
imported from Korea have increased,
imported from Korea have increased,
including steel (32.4%), petro-
including steel (32.4%), petro-
chemicals (11.8%), and textiles (9%).
chemicals (11.8%), and textiles (9%).
China’s exports slow down.
China’s exports slow down.
Economic growth slows down.
Economic growth slows down.
29.
China’s Strategy
China’s Strategy
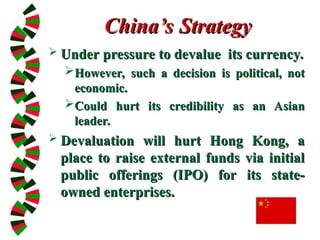
Under pressure to devalue its currency.
Under pressure to devalue its currency.
However, such a decision is political, not
However, such a decision is political, not
economic.
economic.
Could hurt its credibility as an Asian
Could hurt its credibility as an Asian
leader.
leader.
Devaluation will hurt Hong Kong, a
Devaluation will hurt Hong Kong, a
place to raise external funds via initial
place to raise external funds via initial
public offerings (IPO) for its state-
public offerings (IPO) for its state-
owned enterprises.
owned enterprises.
30.
China’s Strategy
China’s Strategy(continued)
(continued)
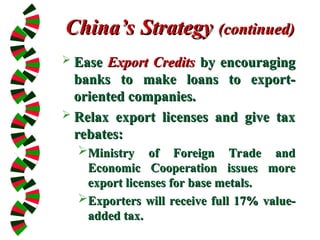
Ease
Ease Export Credits
Export Credits by encouraging
by encouraging
banks to make loans to export-
banks to make loans to export-
oriented companies.
oriented companies.
Relax export licenses and give tax
Relax export licenses and give tax
rebates:
rebates:
Ministry of Foreign Trade and
Ministry of Foreign Trade and
Economic Cooperation issues more
Economic Cooperation issues more
export licenses for base metals.
export licenses for base metals.
Exporters will receive full 17% value-
Exporters will receive full 17% value-
added tax.
added tax.
31.
Implications and Strategies
Implicationsand Strategies
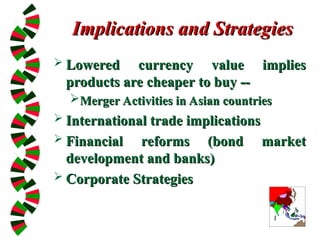
Lowered currency value implies
Lowered currency value implies
products are cheaper to buy --
products are cheaper to buy --
Merger Activities in Asian countries
Merger Activities in Asian countries
International trade implications
International trade implications
Financial reforms (bond market
Financial reforms (bond market
development and banks)
development and banks)
Corporate Strategies
Corporate Strategies
32.
Corporate Hedging Strategies
CorporateHedging Strategies
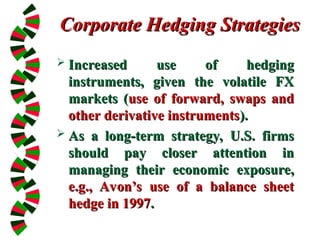
Increased use of hedging
Increased use of hedging
instruments, given the volatile FX
instruments, given the volatile FX
markets (
markets (use of forward, swaps and
use of forward, swaps and
other derivative instruments
other derivative instruments).
).
As a long-term strategy, U.S. firms
As a long-term strategy, U.S. firms
should pay closer attention in
should pay closer attention in
managing their economic exposure,
managing their economic exposure,
e.g., Avon’s use of a balance sheet
e.g., Avon’s use of a balance sheet
hedge in 1997
hedge in 1997.
.