The document investigates accidental mortality trends in India and forecasts future accidental deaths using statistical models, notably ARIMA and Damped Trend Exponential Smoothing. It highlights a significant increase in accidental deaths, with predictions estimating 438,811 deaths by 2015 if current trends continue. The study uses data from the National Crime Records Bureau to support its findings and emphasizes the necessity for improved safety measures to mitigate risks associated with accidental deaths.
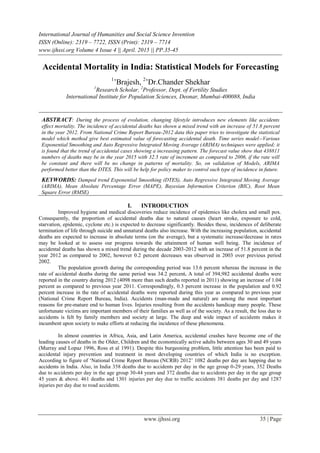
![Accidental mortality in India: Statistical models for…..
www.ijhssi.org 36 | Page
Accidental deaths are the death caused by an accident or a natural calamity. It’s not HIV/AIDS or any
other disease which is the leading killer of productive youth across the globe but accidents (D. K. Dash, TNN
Nov, 2012). A World Health Organization (WHO) report shows that 33, 5805 people in the 15-29 years age
group succumb to road accident injuries annually and it's no different in India. At least 30 percent of road
fatalities here are in this age group of 15-24 years. Mumbai, the financial capital of the country, could perhaps
also be dubbed the "accident capital"(C. Tembhekar, TNN Jan, 2013). Mumbai has reported the maximum
number of sudden deaths—where the cause of death is not known. Interestingly, Kolkata—the third largest city
in terms of population—reported the lowest number of accidental deaths at 1.4 percent.
According to NCRB, Kerala has become a high accident-prone state on the basis of percentage share in
deaths due to road accidents (Ajay, TNN Jul 2012). As road traffic crashes take the lives of nearly 1.3 million
every year, and injure 20-50 million more in the world, India along with China are listed among countries with
the highest number of deaths (Znews, May 2011). Mental illness is related to all sorts of accidental deaths,
especially poisoning and falls (Casey Crump, sept, 2013). As countries experience the epidemiological
transition with a relative decline in infectious diseases, accident rates tend to increase, particularly unnatural
deaths by accidents. Countries experiencing the so-called epidemiological transition comprising a decline in
mortality and morbidity from infectious diseases tend to witness an increase in the relative importance of fatal
and non-fatal injuries. Unintentional injury rates in developing countries have increased to become a significant
cause of premature death and morbidity (Bradley et al., 1992; Zwi, 1993; Murray and Lopez, 1994).
There are measures which can be taken, however, to reduce accidents and their effects, and people's
beliefs should not be taken to mean that they are satisfied with the status quo. Discussion of preventative actions
need to incorporate a wider range of factors, such as cultural beliefs and understanding, and accidents need to be
placed within a social, economic and political context. There needs to be an increase in resources given both to
research to understand the problem, and to tackling it.
II. STATEMENT OF THE PROBLEM
India is the second largest country in the world which has 1210.6 millions populations (census 2011)
and more than 64 percent of population is in age group 15-64 years. Where death rate is 7.0 n India (SRS, 2012)
and in total deaths 78.9 percent share of age group 15 to 60 years & above. There has been no respite from
accidental deaths for the state, which has moved up from the low accident-prone state category to high in the
National Crime Records Bureau's (NCRB) Report 2012. The magnitude of ‘accidental deaths’ by causes
attributable to nature has declined by 3.1% and that of deaths by un-natural causes have increased by 1.0%
during 2012 over the year 2011.Under causes attributable to nature, the share of deaths due to cold and
exposure, Starvation/thirst, torrential rains and heatstroke has increased whereas the share of causes such as
avalanche cyclone/tornado, earthquake epidemic, flood, landslide and lighting has decreased in 2012 over 2011.
The share of causes not attributable to nature has increased for causes such as falls sudden deaths
,poisoning ,suffocation and traffic accidents whereas the share of causes such as ,air crash ,collapse of structure,
drowning, ,electrocution, explosion ,factory /machine accidents, fire arms, killed by animals, mine or quarry
disaster and stampede has decreased to the previous year. The average rate of accidental deaths has marginally
increased from 32.3 in 2011 to 32.6 in 2012.
III. OBJECTIVE
[1] To investigate the statistical model which method give best estimate for forecasting accidental mortality
in India.
[2] To estimate accidental deaths for next three years according to current rate of increment of accidental
death in India.
[3] To comparison between observed values which has been used for analysis with forecast value estimated
by different model.
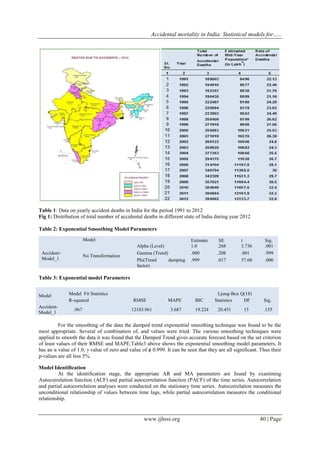
IV. DATA SOURCE
Every year Ministry of Home Affairs, Government of India publishes data on accidental deaths and
suicides in India. The data for present study has been drawn from National Crime Report Bureau annually report
on accidental deaths and suicides in India. The annual publication of ‘National Crime Record Bureau
‘Accidental Deaths and Suicides in India – 2012’ is publish in the third week of June 2013.This annual
publication is the 46th
in series which started in the year 1967 and contains valuable information on accidents
and suicides and pattern in the society. So for this study we select to given data from year 1991 to 2012 i.e., total
accidental deaths, midyear population, accidental rate in India.](https://image.slidesharecdn.com/f0442035045-150519102118-lva1-app6891/85/Accidental-Mortality-in-India-Statistical-Models-for-Forecasting-2-320.jpg)
![Accidental mortality in India: Statistical models for…..
www.ijhssi.org 44 | Page
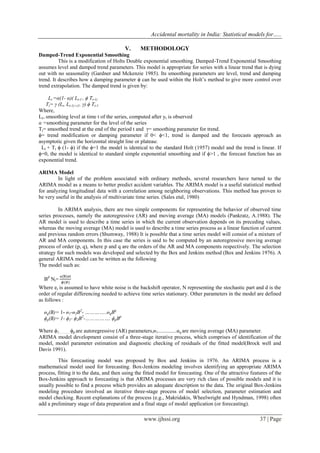
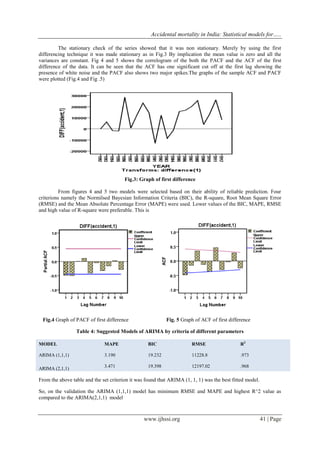
Table 9: Rate of accidental deaths in India 2006 to 2012 by actual, ARIMA and Damped trend
Year Rate of accidental Rate(Damped trend) Rate (ARIMA)
2006 26.6 25.4 26.1
2007 27.9 26.5 27.1
2008 29.8 27.9 28.3
2009 29.7 29.7 29.8
2010 30.4 29.6 30.1
2011 32.2 30.1 30.7
2012 32.3 32.2 32.5
MAJOR FINDINGS OF THE STUDY
The following are the major findings of this study:
[1] Both the model ARIMA and exponential damped trend has been used to forecast the value, where mean
absolute percentage error (MAPE) and root mean square error (RMSE) of ARIMA (1, 1, 1) model is less as
compared to Damped trend exponential model. So, minimum value of both errors MAPE and RMSE of
ARIMA (1, 1, 1) model indicates that this model performed best as compared to damped trend exponential
model in forecast.
[2] The finding of this study also suggest that the ARIMA (1,1,1) model will always give the best forecast
value as compared to other model at this type of time series data.
[3] The forecast value of the both model are showing that there will be an increment trend in accidental death
during present to in future. It is showing the death due accident will be increase in future even also from the
year 2015, if the rate of increment of accidental death will follows same pattern.
[4] The results of the model predict that there will be total 438811 deaths during the year 2015 with 34.3
percent rate of accidental death follow by 394982 deaths during year 2006. If the models are follows same
pattern of death due to accident and if there should be some improvement of pattern than even also there
will be more than five lakh deaths annually due to accident in India.
0
200000
400000
600000
800000
1000000
1200000
1400000
1 3 5 7 9 11 13 15 17 19 21 23
ARIMA MODEL
UCL MEAN LCL
0
200000
400000
600000
800000
1000000
1200000
1400000
1 3 5 7 9 11 13 15 17 19 21 23 25
DAMPED TREND
0
5
10
15
20
25
30
35
1 2 3 4 5 6 7
RATEOFACCIDENT
Rate of accidental Rate(Damped trend) Rate (ARIMA)
2006 2007 2008 2009 2010 2011 2012](https://image.slidesharecdn.com/f0442035045-150519102118-lva1-app6891/85/Accidental-Mortality-in-India-Statistical-Models-for-Forecasting-10-320.jpg)
![Accidental mortality in India: Statistical models for…..
www.ijhssi.org 45 | Page
VII. CONCLUSION
The accident has a serious impact on mental health and also the pattern of accidental deaths is a
reflection of the prevailing social set up and mental health status, loss of economic stability, and long-term
threats to health in current and possibly future generations of the region. Many cultural and socio-economic
factors of a country are responsible for the causation of such type of deaths. Accidental deaths happen almost
everywhere in the world said ‘Dr Margaret China, WHO's director general, suggesting that it is important to
have an action plan for an intensified response. So, forecasting of accidental mortality enables stakeholder and
policy makers to take various prevention measures to control different type of accident in India.
VIII. LIMITATION OF STUDY
The limitations of this study are that the rate of increment of accident should be same with some
fluctuation in future also as compared to current level. The social setup should be following the same status like
present scenario. The distribution of deaths came from cohered of same age group, which have already
mentioned in national crime report that most of the deaths distributed from below 29 to 45 years and above age
group.
REFERENCES
[1] Akaike, H.(1974). A New Look at the Statistical Model Identification. IEEE Transactions on Automatic Controll 19 (6): 716–723.
416 .
[2] Ajay (TNN Jul 2012). Deaths due to road accidents, National Crime Records Bureau (NCRB), Kerala 2012.
[3] Box, G.E.P. and Jenkins, G.M. (1976). Time Series Analysis: Forecasting and Control. Holden-Day, San Francisco, C.A
[4] Brockwell P.J. and Davis R.A. (1991). Time series: Theory and methods. Springer- Verlag, (2nd Editions) New York.
[5] Brown, R. G and Meyers R.S (1961). “The Fundamentals Theorem of Exponential Smoothing”. Operational Research 9 (No. 5): pp
613 – 685.
[6] Chittaranjan Tembhekar, (TNN, 2013) ’News Heading: Mumbai tops India in accidental deaths’, National Crime Records
Bureau (NCRB), Mumbai.
[7] D.K. Dash (TNN, 2012). ‘News Heading: Road mishaps biggest youth killer’: World Health Organization.
[8] Ghana: Implication for Control. Injury Control and Safety Promotion. Vol 10.
[9] Gardner, E.S (1985). Exponential Smoothing – The State of the art. Journal Forecasting, 4. 1-28
[10] Gardner, E.S and Mckenzie, E (1985).” Damped trend exponential smoothing: A modeling Viewpoint”, International Journal of
Forecasting, Vol. 26. pp. 661 – 665.
[11] Holt,C.C (1957), Forecasting Seasonal and Trends by exponential weighted moving averages, Office of Naval Research, Research
Memorandum No. 52.
[12] Makridakis,S .,S.C. Wheelwright, and R.J. Hyndman (1998) Forecasting: methods and applications, New York: John Wiley & Sons
[13] Murray C.J and Lopez A. (1996) The Global Burden of Diseases, vol. 1: A Comprehensive Assessment of Mortality and Disability
from Diseases, Injuries and Risk Factors in 1990 and projected to 2020. Cambridge: Harvard University Press
[14] National Crime Report Bureau (NCRB,2012). ‘Accidental deaths and Suicides in India’, Ministry of Home Affairs, Government of
India
[15] Pankratz, A.(1988). Forecasting with Univariate Box-Jenkins Models: Concepts and Cases. Wiley, New York.
[16] Ross A. et al (1991). Towards safer Road in Developing Countries; A Guild for Planners and Engineers. Transport Research
Laboratories. Crowthrone UK.
[17] Resister General of India, National Crime Record Bureau- Accidental and Suicide in India 2012, Table 1.1(18).
[18] Sakamoto, Y., Ishiguro, M., and Kitagawa G. (1986). Akaike Information Criterion Statistics. D. Reidel Publishing Company.
[19] Sales, J.D., Delleur, J.W., Yevjevich, V. and Lane, W.L.(1980). Applied Modeling of Hydrologic Time Series. Water Resources
Publication, Littleton, CO.
[20] Shumway, R.H. (1988) Applied Statistical Time Series Analysis. PrenticeHall, Englewood Cliffs, NJ.
[21] Witt, S.F, and Witt C.A (1995). “Forecasting tourism demand: A review of empirical research”, International Journal of forecasting
Vol. 2 (No.3): pp. 447- 490
[22] Winters, P.R (1960). ”Weighted Moving Averages”. Management Science 6: pp. 324 – 342.](https://image.slidesharecdn.com/f0442035045-150519102118-lva1-app6891/85/Accidental-Mortality-in-India-Statistical-Models-for-Forecasting-11-320.jpg)


