Tableau Software is a pure-play business intelligence vendor that delivers strong interactive data visualization capabilities. It has experienced triple-digit sales growth with high customer satisfaction. While it lacks some broader BI platform capabilities, it provides a front-end visualization tool and is developing more industry-specific applications. Using metrics like QlikView, Tableau appears to have strong valuation prospects given its growth rates, though it primarily serves smaller to medium enterprises currently rather than large organizations.
Buyer's Remorse - Using analytics to mitigate M&A riskKDDanalytics
Buying growth? Make sure you get what you pay for.
Use analytics to answer, during due diligence:
> Sales penetration and addressable market by industry, company size, territory?
> Revenue growth opportunity? by industry, company size, territory?
> Potentials sales organization redundancy (cost savings)?
> True value of the deal?
You’re about to spend millions on a deal…isn’t this information worth a few weeks & less than $10,000?
First of two presentations from Autonomy and Qatalyst (Qattrone) pitching the company to Oracle and others, downloaded from Oracle's site and preserved here in case Oracle takes these presentations down again
NAPCO Security Technologies, Inc. (Nasdaq: NSSC) is one of the world's leading manufacturers of technologically advanced electronic security equipment including intrusion and fire alarm systems, access control and door locking systems. The Company consists of NAPCO plus three wholly-owned subsidiaries: Alarm Lock, Continental Instruments, and Marks USA.
For those new to the Salesforce Platform, we’ll get you up and building cloud apps quickly by introducing you to the basics of the platform with step-by-step hands-on tutorials. You’ll be able to create an app with point-and-click development and then see how you go a little further with Apex Code and Visualforce.
How Customers Choose Solutions Providers 2009ITSMA
ITSMA, in partnership with Pierre Audoin Consultants (PAC), conducted the 2009 version of its acclaimed How Customers Choose research across three continents.
Feature Extraction for Predictive LTV Modeling using Hadoop, Hive, and Cascad...Kontagent
Description:
One of the biggest challenges for people building data products today is developing and refining features for modeling purposes (i.e. feature extraction) with the volume and variability of web scale data. In this talk, Martin will discuss some of the challenges and solutions faced by Kontagent as it built out a predictive lifetime value model for its customers. As you will learn, Hadoop is critical to this feature extraction process, and Cascading is quite handy when building out more complex features than can be readily developed in a query framework like Hive.
Speaker:
Martin Colaco, Director of Data Science for Kontagent
Similar to Tableau Software - High Level Due-Diligence March 2011 (20)
Static Nature of Ticketing In Sports For Nearly a CenturyJitender Aswani
The insane pace of innovation we have seen in the last century has not really affected the ticketing in sports. Ninety years ago, sports fans entered the stadium with a paper ticket and this experience has continued till date. Ticketing needs disruption. Fans are more mobile than ever, more social than ever and more fickle than ever.
The Disney Experience - Every Customer's "I Wish"Jitender Aswani
When it comes to delivering the best experience to consumes, consumer-facing-businesses generally lookup to few companies for standards. Apple, Amazon, Netflix, FourSeasons, LinkedIn are some of the examples. Disney experience is apparently the gold standard. Disney spent $1B to raise the bar and to stay relevant in a world where technology has become uber pervasive.
Business Analytics is all about - analyzing data, discovering insights and influencing change. Provide answers to Ws: What Happened, When it Happened, Where is happened, Why it Happened? help decisions and drive change. Analytics has been with us for centuries and played a critical role all along. In today's big & complex industrial world, analytics has continued to play a critical role but sadly the current state of the business analytics approach is broken. For the last 25 years, the software technology and tools in the analytics category has produced "slice and dice ninjas" who interact with data but mostly without the right context. This approach produces insights and visualization that can not be understood very well. These solutions are complex, cost-prohibitive, slow and most often fail to deliver to the promises . Visual Analytics came to forefront to address the challenge of traditional business analytics.
Visual Analytics is defined as "analytical reasoning aided by visual interfaces". The primary premise for this approach is that "visualization is not an afterthought". This industry has risen very fast in the past few years. In this presentation, I discuss the issues faced by this nascent offshoot of Business Analytics and what does future hold for this category.
Mobile Analytics (Mobile BI) - A Game Changer Jitender Aswani
Big Data - According to IDC, data is doubling every two years and is expected to reach 1.8 ZB (a trillion GB) in 2011.
Eight mobility related mega trends are locked in a virtuous cycle and will be the bedrock for growth and adoption of Mobile BI solutions and for the overall Enterprise Mobility.
According to Gartner, more than 33% of Analytics will be consumed using mobile devices, a prediction well supported by the 8 mobility related mega trends discussed here.
Mobile BI market could grow at 20% plus CAGR over the next 5 years and could likely become over a $2 billion market by 2015.
Therefore, by 2015 more than 15% of Analytics revenues could come from Mobile Analytics solutions. This should be a serious strategic priority for every Analytics vendor if not already.
Geo-location and spatial intelligence is the strategic turning point for analytics. Location has become an essential part of the enterprise data and increasing number of enterprises have geo-coded their location data to build location-aware application to drive location-aware decisions. For example, by overlaying the foreclosure data, income data, and the data from its mortgage portfolio on a geo-chart, a regional mortgage bank assesses the risk of its mortgage portfolio and decides to take corrective actions. A fast food company uses the demographics data, the latest census data, and the historical sales of its stores to determine the location of its new restaurant. In this interactive session, the presenter will discuss the current state of location analytics showcasing demos using SAP BusinessObject Explorer and SAP BusinessObjects Dashboard technologies as well as discuss the future of location analytics.
Tableau Software - High Level Due-Diligence March 2011
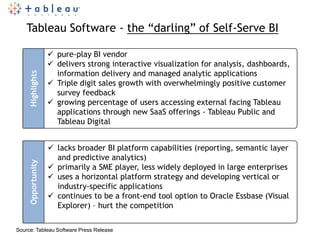
1. March 2011
Tableau Software - the “darling” of Self-Serve BI
pure-play BI vendor
delivers strong interactive visualization for analysis, dashboards,
information delivery and managed analytic applications
Highlights
Triple digit sales growth with overwhelmingly positive customer
survey feedback
growing percentage of users accessing external facing Tableau
applications through new SaaS offerings - Tableau Public and
Tableau Digital
lacks broader BI platform capabilities (reporting, semantic layer
and predictive analytics)
Opportunity
primarily a SME player, less widely deployed in large enterprises
uses a horizontal platform strategy and developing vertical or
industry-specific applications
continues to be a front-end tool option to Oracle Essbase (Visual
Explorer) – hurt the competition
Source: Tableau Software Press Release
2. March 2011
Tableau Software – Simple Strategy, Extremely Effective
Fast Analytics for Everyone
Three Part Strategy
Raid Fire Analytics Served
Through Web
Socialize Your Analysis
3. March 2011
Tableau Software – Challenging the Giants
Source: * Magic Quadrant for Business Intelligence Platforms, 27 January 2011, Rita L. Sallam, James Richardson, John
Hagerty, Bill Hostmann, Gartner
** Tableau Software Press Release
4. March 2011
Qlik Technologies For Relative Valuation of Tableau
Strong sales growth since
inception, improving profitability
YoY, rapidly increasing customer base
with a stable ASP per customer…
(Source: Qlik Technology, Inc. Financial Information from SEC Filings)
5. March 2011
Tableau Valuation - Using Multiples of QlikView(QLIK)
QLIK TABL
Revenues (in 000s of dollars)
2010 $226,521 $40,000
YoY Growth 44% 106%
2009 157,359 19,417
Profitability (Using 2010 QLIK ratios as a proxy, in 000s of dollars)
Gorses Profit Margin 90% 202,799 35,811
Operating Profit Margin 12% 27,568 4,868
Net Profit Margin 6% 13,516 2,387
Preliminary Valuation
Market Cap 2,150,000,000 -
Enterprise Value 1,980,000,000 -
Stock price 27.17 -
Shares Outstanding 79,000,000 -
PE Ratio 158.81 158.81
Value based on PE Ratio (Using QLIK as a proxy) 2,146,430,000 379,025,344
PS Ratio 9.48 9.48
Value based on PS Ratio (Using QLIK as a proxy) 379,025,344
Customer Analysis
Customers 18,000 6,350
ASP per Customer $12,585 $6,299
Source: Tableau Software Press Release & Qlik Tech Financial Information from SEC Filings. Tableau had 5000 customer at EOY 2009.
All numbers are preliminary and subjected to change.