
Recommended
More Related Content
More from Anand Chokshi
More from Anand Chokshi (20)
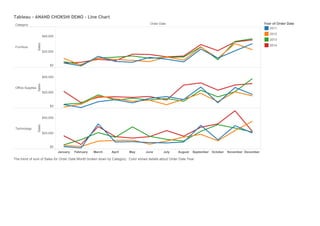
Tableau - ANAND CHOKSHI DEMO - Line Chart
- 1. Category OrderDate January February March April May June July August September October NovemberDecember Furniture OfficeSupplies Technology $0 $20,000 $40,000 Sales $0 $20,000 $40,000 Sales $0 $20,000 $40,000 Sales Tableau-ANANDCHOKSHIDEMO-LineChart YearofOrderDate 2011 2012 2013 2014 ThetrendofsumofSalesforOrderDateMonthbrokendownbyCategory.ColorshowsdetailsaboutOrderDateYear.