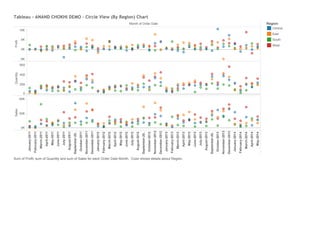
This document contains data on monthly order profits, quantities, and sales from January 2011 to December 2014 broken down by region. A circle chart visualizes the sum of profit, quantity, and sales for each month and region over this time period. Color is used to show details for each of the four regions: Central, East, South, and West.