SlideShare a Scribd company logo
1 of 256
Systems Analysis Problem
Imagine that you, as Systems Analyst, have been approached by
a consumer products company with the tantalizing idea
presented in Appendix I of this document (found at back of this
file). Based on the problem description presented in APPENDIX
I, acting as a Systems Analyst, please answer the following
questions:
1. (10 Points) Parse the APPENDIX I problem description into
Table 1 to isolate each Statement. Strive for single-thought,
concise statements. Add as many rows to the table as necessary.
The first few have been done for you (you can modify if you
like).
Table 1. Analysis Problem Requirements Parse
No.
Statement
Statement Type
(Requirement or Information?)
Reqt. Category (Functional, Operational, Physical, Interface)
10
Company research indicates that home security opportunities
are showing double-digit growth annually.
Information
N/A
20
The company would like to enter this market by developing a
simple computerized system that recognizes and protects against
undesirable situations.
Information
N/A
30
Undesirable situations may include, but are not limited to,
illegal entry, fire, flooding and others
Requirement
Functional, Interface. Suggests categories of required Sensors.
40
50
60
2. (5 Points) When you have parsed all Statements into Table 1,
next verify “Statement Type” (3rd column). Indicate which
Statements are “Requirements”. Going forward, we are
primarily only interested in the Requirements, although the
other Statements help with overall context.
3. (5 Points) Next specify “Reqt. Category” (4th column) in
Table 1. For the Requirements only, define a Category. Likely
Categories are: Functional, User Interface, Operational,
External Interface, but you may define others.
4. (10 Points) With Steps 1-3 complete, and based on
Requirements, please draw a System Context diagram similar
the one shown below in Figure 1. The primary goal is to show in
a simple diagram what is “outside” the system and which major
pieces of functionality are “inside” the system.
Create then insert your own diagram. Clearly indicate all
External Inputs, External Outputs and Major Internal Functions.
Consider all external Actors. Please note that there is no one
“right” answer.
Figure 1. Sample Context Diagram
5. (10 points) With Steps 1-4 complete, consider all the “nouns /
things” identified in the problem statement. Based on
Requirements, propose the list of potential Classes/Objects by
filling in the following Table 2. The first couple of potential
entries are done for you.
Note: You may find it helpful to review APPENDIX II –
CLASS/OBJECT SELECTION RULES, which provide some
time-honored guidance on how to make such a selection.
Note that this should end up being your list of internal Classes
based on your interpretation of the Problem Statement. Not all
Potential Class/Object items should remain as a Class. Also
provide Your Rationale. Please note that there is no one “right”
answer.
Table 2. List of Potential Classes / Objects
Potential Class/Object
General Classification
Your Rationale
Homeowner
External Role, external entity
Sensor
External Entity
6. (10 points) Pick two (2) of your Classes from the above Table
2. Propose the list of Attributes associated with the selected
Class and populate Table 3. Provide rationale for your proposed
Attributes.
Table 3. Selected Classes and Attributes
Class No.
Class Name
Class Attributes
Your Rationale
1
2
7. (5 points) Imagine that “Control Panel” is a Class. Using the
concept of Superclass / Subclass and Inheritance, draw a picture
that shows the relationship between the Control Panel and its
associated Keypad, LCD Screen and Lights.
8. (10 points) Imagine that you have determined that the
following Class Diagram, shown in Figure 2, has resulted from
your analysis work on this project. Using the provided diagram,
and using UML Cardinality rules, add in the relationships
between the classes. (Note: These classes may be different than
those being defined by your analysis. That is OK. To answer
this question, please use this diagram).
Figure 2. Class Diagram
>> End of Questions. Appendix I and Appendix II follow <<
APPENDIX I – SYSTEMS ANALYSIS PROBLEM
DESCRIPTION
Introduction
Company research indicates that home security opportunities
are showing double-digit growth annually. The company would
like to enter this market by developing a simple computerized
system that recognizes and protects against undesirable
situations. Undesirable situation may include, but are not
limited to, illegal entry, fire, flooding and others. The code
name for this product is “SecureAndSafe”.
The SecureAndSafe system will use appropriate sensors to
detect every situation. It can be programmed by an installer,
homeowner or maintainer, and will automatically contact a
monitoring agency when a situation is detected. If the
homeowner has a Wi-Fi router and email system, the monitoring
agency will be contacted by both email and phone. If no e-mail
exists, the monitoring agency will be contacted by phone only.
The homeowner will define the relevant e-mail address and
phone numbers.
The SecureAndSafe system is comprised of a wall control unit
and software. A suggested example of the wall unit is shown
below:
The software enables the installer or homeowner to configure
the security system. Once installed and operational, it monitors
all sensors connected to the security system. It interacts with
the homeowner through a key pad (numbers 1-9 plus star (*)
and pound (#) keys. The system has “armed” and “power” light
indicators.
System Installation and Configuration
During installation, the control panel is used to “program” and
configure the system. Each sensor is assigned a number and
type, a master password is programmed for arming and
disarming the system, and e-mail addresses (if appropriate) and
telephone numbers are input for dialing when a sensor event
occurs.
System Monitoring and Sensor Event Response
Upon detection of a sensor event, it rings an audible alarm
attached to the system. After a programmable delay time,
software contacts the monitoring agency and provides location
information and nature of the detected event. An e-mail is sent
once, but the phone number is re-dialed every 30 seconds until a
phone connection is made.
User Interaction
All keypad interaction is managed by a user-interaction
subsystem that reads keypad input and function keys. The
subsystem also displays prompting messages and system status
messages on an integrated LCD Display.
APPENDIX II – CLASS/OBJECT SELECTION RULES
Peter Coad and Ed Yourdon, in their textbook titled Object-
Oriented Analysis (Prentice-Hall, 1990), suggested six (6) rules
that should be used to determine if a potential class/object
should be included in an analysis model. According to Coad and
Yourdon, “to be considered a legitimate object for inclusion in
the requirements model, a potential object should satisfy all (or
almost all) of the characteristics”.
These rules are:
No.
Rule
Description
1
Retained Information
The potential object will be useful during analysis only if
information about it must be remembered so that the system can
function.
2
Needed Services
The potential object must have a set if identifiable operations
that can change the value of its attributes in some way.
3
Multiple Attributes
During requirements analysis, the focus should be on “major”
information; an object with a single attribute may, in fact, be
useful during design, but is probably better represented as an
attribute of another object during the analysis activity.
4
Common Attributes
A set of attributes can be defined for the potential object and
these attributes apply to all occurrences of the object.
5
Common Operations
A set of operations can be defined for the potential object and
these operations apply to all occurrences of the object.
6
Essential Requirements
External entities that appear in the problem space and produce
or consume information that is essential to the operation of any
solution for the system will almost always be defined as objects
in the requirements model.
SecureAndSafeSystem BoundaryExternal InputsExternal
OutputsMajor Internal Functions1.Function 12.Function
2:Function “n”
SystemControl PanelAudible AlarmSensorSensor Event
SecureAndSafe
Associate
career opportunities
Walmart de Mexico promoted
more than 22,700 associates
in fiscal 2014.
Putting low prices within reach
We serve customers around the globe
more than 250 million times each week.
Affordable, healthier food
In FY 2014, we opened 96 new stores
in America’s food deserts, with 224
opened since our initiative began.
Meeting community needs
around the world
Last year, Walmart and the Walmart Foundation
gave more than $1 billion in cash and in-kind
gifts to charitable organizations.
Toward
a more
sustainable
tomorrow
Today, 24% of
our electricity
comes from
renewable sources.
Wal-Mart Stores, Inc. (NYSE: WMT)
702 S.W. 8th Street | Bentonville, Arkansas 72716 USA |
479-273-4000 | walmart.com
So many ways to
Save money.
Live better.
2014 Annual Report
2014 A
n
n
u
al Rep
o
rt
147046_L01_CVR.indd 1 4/10/14 10:52 AM
Walmart 2014 Annual Report 24 Walmart 2014 Annual Report
So many opportunities for
associates to serve customers
190,000
U.S. store/club associates
promoted in fi scal 2014
2.2M
dedicated
associates
globally
300K*
associates
have 10+ years
of service
Based on survey results
from more than 2 million
associates worldwide,
approximately
4 of 5
are proud to work
for Walmart.
*Represents Walmart U.S. data only.
The minimized environmental footprint of this report is the
result of an extensive, collaborative effort of Walmart and our
supply chain
partners. The environmental and social impact continues to be
an important consideration. It is printed on paper from well-
managed
forests containing recycled PCW fiber that is Elementally
Chlorine Free (ECF). It is printed using 100 percent renewable
wind power
(RECs), along with environmental manufacturing principles that
were utilized in the printing process. These practices include
environ-
mentally responsible procurement, lean manufacturing, green
chemistry principles, the recycling of residual materials and
reduced
volatile organic compound inks and coatings.
Our sustainable, next-generation report.
5.11 acre
of forestland preserved
via managed forestry
983 fewer
trees consumed
via recycling
129,537 kWh
less energy – the same
used by 5 homes for a year
472 metric tons
of greenhouse gas offset –
the equivalent of taking 94
cars off the road for a year
46,835 kWh
converted to clean renewable
sources (printing plant
using RECs)
459,333 fewer
gallons of water
consumed
Savings baselines were developed using the national averages of
similar
coated papers and printing practices by EarthColor Printing.
FSC® is not
responsible for any calculations on saving resources by
choosing this paper.
Walmart’s Global Responsibility
Report highlights helping
communities live better.
Learn more about our workplace, social, environmental,
sourcing and compliance initiatives by reading our
Global Responsibility Report at corporate.walmart.com/
microsites/global-responsibility-report-2014
Walmart’s investor relations app is
our company at your fi ngertips.
Walmart’s IR app gives shareholders anytime and anywhere
access to financial and company news from their mobile
devices.
Find presentations, quarterly results, virtual store tours, a
global
footprint map and the stock price on your iPad, iPhone or
Android
device. Download the free app from iTunes or Google Play.
Walmart’s enhanced digital annual
report has expanded content.
We’re driving innovation and sustainability – and reducing
costs – with our enhanced digital annual report. Visit
www.stock.walmart.com to hear directly from our leaders,
associates and customers. Also, visit this website to enroll
to receive future materials electronically for our Annual
Shareholders’ Meetings.
P
RI
NT
ED USIN
G
1
0
0%
W
IND EN
ER
G
Y
Supplied by Community Energy
147046_L01_CVR.indd 2147046_L01_CVR.indd 2 4/9/14
8:48 PM4/9/14 8:48 PM
Walmart 2014 Annual Report 1
100K
honorably
discharged U.S.
veterans expected
to be hired by
Walmart U.S.
and Sam’s Club
by 2018
57%
of our
International
associates
are women
*Represents Walmart U.S. data only.
Approximately
75%*
of store management
joined Walmart as
hourly associates
Delivering
for customers
and shareholders
Our Global eCommerce footprint spans
10 countries, creating digital access
and physical distribution points for our
customers worldwide.
$68B*
returned to shareholders
through dividends and
share repurchases
12%*
total shareholder
returns (CAGR)
30%*
earnings per share
growth
33M
approximate retail
square footage added
in fiscal 2014
$68B*
net sales growth over
the past five years
250M
customers served
weekly in our stores
in 27 countries
*Data reflects five-year period including fiscal 2010 through
2014.
To our
shareholders,
associates and
customers:
I’m deeply honored to lead Walmart at such an exciting time.
Walmart has a rich history and is well-positioned for the future.
We have an authentic and important purpose. We’re grounded
with strong values and have millions of associates who share a
culture and belief in doing what is right for our customers, our
communities and each other. The future will bring a lot of
change as the rapid growth of digital commerce enables us
to serve customers in new and exciting ways. Our customers
continue to search for value, a broad assortment and a
shopping experience that saves them time and money. With
greater convergence of digital and physical retail, we’re invest-
ing in capabilities to provide customers even more choice
and convenience. When I think about all these capabilities,
I’m confident in Walmart’s continued growth and enthusiastic
about our future.
Positioning to serve our customers. Around the world,
we deliver value for customers in different ways. We operate
supercenters, Sam’s Clubs, e-commerce sites and many other
formats that enable us to serve our customers. As we develop
the
combination of digital and physical interaction with customers,
we’ll remain well positioned to grow. We’re laser-focused on
delivering improved comparable store sales by sharpening our
merchandising efforts, price leadership and enhancing service.
We’re also intent on creating transformative growth by adding
capabilities in e-commerce and mobile commerce. When we
view our business through the eyes of our customers, we don’t
think about our stores, clubs or websites independently. Instead,
our goal is to have customers see these channels converge as
one unified relationship with us. We want to deliver a relevant,
personalized and seamless experience across all channels.
So, our approach to investments will continue to evolve
to support the singular goal of enhancing the customer
experience to further grow sales.
Change is nothing new for Walmart – it’s embedded in our
DNA.
After all, our company founder, Sam Walton, was the premier
innovator in retail. He made Walmart better by questioning
everything, every day – frequently asking customers and our
store associates how we could do better. He was always in the
market looking for new ideas. For Sam, the customer was
always
the boss, and the improvements he made to Walmart were
Walmart 2014 Annual Report 3
Doug McMillon
President and
Chief Executive Officer
Wal-Mart Stores, Inc.
customer-driven. I intend to lead Walmart with this same
customer-centric focus. Today, in addition to listening to
our customers, we apply data and technology to this task.
The millions of customer interactions that take place each
week give us some of the world’s most robust data to analyze
and leverage to improve our service. For example, customer
insights led the Walmart U.S. team to expand our Black Friday
1-Hour Guarantee program this past year, and innovative
systems enabled successful execution and on-time product
delivery. The tools today may be different than the ones Sam
employed, but the imperative that will guide our transforma-
tional initiatives is the same – to connect more effectively
with customers.
Walmart is well-positioned for the future partially due to our
unique assets. We have more than 10,900 physical points of
distribution globally. No other retailer possesses such an
extensive footprint. And, with our retail websites around the
world, we’re doing more to leverage these physical assets to
expand the intersection with digital retail. Last year, we grew
e-commerce sales in Brazil and China at nearly twice the
market rate. Asda’s Click and Collect program has been very
successful, and Mexico is expanding grocery delivery beyond
our Superama grocery stores to supercenters this year. We’re
leveraging best practices to further test grocery delivery
and customer pickup in the U.S. We’ve also broadened our
e-commerce merchandise assortment. Last year, for example,
we more than doubled walmart.com’s merchandise offerings
in the U.S. to over 5 million SKUs, and our sites in Brazil and
China greatly expanded their assortments as well.
We invest in price to bring everyday low prices (EDLP) to
more customers around the world. EDLP earns trust with
customers because we’re driven to keep our cost structure
low. That commitment to price is central to our brand –
regardless of the format.
We’re also giving customers greater access to the value we
offer through different formats. In the U.S., our Neighborhood
Markets offer fresh foods, pharmacy and fuel, and delivered
healthy comp sales growth in fiscal 2014. This year, we’ll
significantly accelerate their rollout to complement our
core supercenter fleet. And, in Mexico and the U.K., we’ll
open more small stores to deliver convenience, assortment
and low prices.
Expanding opportunities for associates. One of the
most exciting things about serving more customers in new
ways is the opportunity to create good jobs, attract new talent
and expand current associates’ possibilities to build careers.
Last year, we hired 776,000 new associates to jobs across
our operations. The path of my own career attests to the
exceptional opportunity at Walmart to advance professionally.
In fact, we promoted about 190,000 U.S. store and club
associates last year to jobs with more responsibility and
higher pay. And, we’ll continue to invest in training and
development because building the best team in retail is
central to our strategy.
Driving operational excellence. We remain focused on
driving the productivity loop to leverage operating expenses.
The most important way to deliver against this objective is to
increase sales. By operating and buying for less, we’re able to
lower prices that, in turn, prompt customers to make more
purchases. We also foster an environment that leverages best
practices across the enterprise to drive process improvements.
Operational excellence requires capital discipline and
efficiency,
and our real estate and construction teams have made great
progress in lowering the cost of new stores and remodels.
Our focus on capital efficiency also is top of mind with our
e-commerce capabilities. We’re more disciplined now in
allocating capital to the right markets, the right formats
and the right digital capabilities.
Earning trust in communities. I’m proud of the value
we add in the communities we serve and I know we will find
new ways to contribute. We are deeply committed to com-
pliance and social, environmental and local responsibility.
Operating with integrity is a cornerstone for building trust.
We have made tremendous progress toward our goal of
developing a world-class compliance organization and this
will continue to be a top priority going forward. Our training
and leadership development programs reinforce the mission
of upholding the highest standards of integrity, not just in
retail, but in all of business. We’ll also continue to lead on key
Walmart 2014 Annual Report 54 Walmart 2014 Annual Report
Read Walmart’s 2014 Global
Responsibility Report at
stock.walmart.com to learn
more about our workplace,
social, environmental,
sourcing and compliance
initiatives.
issues like women’s economic empowerment, healthier foods
and renewable energy. Walmart’s initiatives, in partnership with
many suppliers, have significantly increased sustainability
throughout the global supply chain, and we will do even more.
Solid performance in a challenging environment.
In fiscal 2014, consolidated net sales increased $7.5 billion to
more than $473 billion and diluted earnings per share from
continuing operations were $4.85. While we certainly see areas
where we can improve, it’s also a reality that we faced some
challenging consumer environments around the world. Both
developed and developing markets grew slower than most
people would have hoped for. The value we offer enabled us
to grow share almost everywhere, and we’re optimistic that
conditions will moderately improve this year.
Walmart U.S. delivered solid profit growth. Operating income
grew 4 percent on a net sales increase of $5 billion. The U.S.
team did a great job controlling costs and successfully lever-
aged expenses. Walmart International’s net sales increased
1.3 percent to more than $136 billion. We took important steps
to hone our international portfolio and focus investments on
the most profitable opportunities to position the business for
future growth. Sam’s Club continued to expand its footprint,
opening 12 new clubs, and enhanced its merchandise offerings
with a sharpened focus around value, quality and exciting
merchandise. Our members saw the value of membership,
and with the fee increase in May, Sam’s Club membership
income continued to grow.
Each operating segment strengthened its e-commerce
platforms, and customers responded, driving annual Global
eCommerce sales, including acquisitions, above the $10-billion
mark, a 30 percent increase. A strong focus on e-commerce
is now fully embedded within each of our businesses and
we’ll increase our investment as e-commerce opportunities
present themselves.
Embracing the challenge to change. After just a few
months into my new role, I have an even deeper appreciation
for Mike Duke’s extraordinary contributions as CEO over the
past 5 years. His work positioned Walmart for long-term
success,
and I am one of the many associates who benefitted from his
guidance and leadership. His passion for our business and
drive for continuous improvement greatly benefitted Walmart’s
associates, customers and shareholders.
I look to the future confident that Walmart has all the
ingredients
necessary to prosper in the new retail world that is unfolding.
Our purpose remains clear – to save people money so they
can live better – and the actions we’re taking will expand the
opportunities to fulfill that purpose. We’ll analyze and review
everything Walmart is today, and we’ll be willing to change
whatever is necessary to serve customers better than ever.
I first started working for Walmart 30 years ago when I was a
teenager. I’ve fallen in love with our company, its people, our
purpose and culture. We have a unique culture grounded on
four basic beliefs: service to our customers, respect for the
individual, striving for excellence and acting with integrity.
As CEO, I want to continue to nourish and strengthen these
foundational beliefs. And, I’m excited to increase the pace of
change to ensure we’re serving the customers the way they
want to be served in the future.
Sincerely,
Doug McMillon
President and Chief Executive Officer
Wal-Mart Stores, Inc.
Walmart 2014 Annual Report 54 Walmart 2014 Annual Report
Top left: We’ll purchase an additional $250B
of U.S.-made products over the next 10 years.
Top right: Produce, backed by our money-back
guarantee, has the quality and value customers trust.
Middle right: We’re bringing new, innovative grocery
products to our broad assortment.
Bottom right: Customers appreciate the convenient
access to pharmacy, fresh foods, fuel and e-com-
merce pickup at our Walmart Express pilot stores.
Bottom left: In fiscal 2015, we expect to add about
200 new Neighborhood Markets to our portfolio.
Nearly
140 million
customers served
each week
Serving customers and
delivering savings every day
In fiscal 2014, Walmart U.S. attracted nearly 140 million
weekly shoppers to our stores
and delivered net sales of more than $279 billion, an increase of
$5 billion, or 1.8 percent,
from last year. Our focus on cost discipline helped drive 4
percent operating income
growth, more than twice the rate of sales, despite a 0.6 percent
decline in comp sales.
Focused on customer needs. Customers choose Walmart for our
broad assortment,
including national brands and locally relevant merchandise, at
everyday low prices (EDLP).
It’s our winning formula and results in continued market share
gains in key categories,
such as food, consumables, over-the-counter and apparel. With
our merchant mindset,
we partner with suppliers to increase product innovation and
bring exciting new brands
to our stores, such as Russell, Avia and Calphalon. We also
work hard to improve quality
and execution, making great strides in areas such as produce
and meat. And, our price
investments are driving sales by providing a lower-priced
basket relative to the market
and building customers’ trust in our EDLP promise.
In order to invest in price, we focus on everyday low cost
(EDLC). Advancements in
logistics and store operations continue to reduce costs and
improve productivity. For
instance, optimized transportation routes and distribution center
mechanization are
driving supply chain efficiencies. Greater flexibility at the store
front-end, such as self-
checkouts, is helping productivity and resonating with our
customers. We believe we
can drive cost savings by sourcing closer to the point of
consumption. We made bold
commitments to increase purchases of U.S.-made products by an
additional $250 billion
over the next 10 years.
Our 1.2 million associates are essential to a customer-centric
experience. Advancement
opportunities abound for Walmart associates who are passionate
about serving customers.
Last year, we promoted over 170,000 associates and
experienced more part-time associates
accepting full-time roles, building long-term careers with
Walmart. We also added over
30,000 honorably discharged veterans to our team. We’re
strengthening career develop-
ment pathways by expanding training to foster continued, strong
associate engagement.
Positioned to win at the convergence of digital and physical.
Walmart is redefining
the next generation of retail growth and is the best-positioned
retailer to win at the
convergence of digital and physical retail. In fiscal 2015, we’ll
continue to grow our
multi-format portfolio. Our core supercenter fleet serves the
stock-up trip and accounts for
the majority of our market share leadership. We’re accelerating
the rollout of Neighborhood
Markets to serve the quick-trip needs. And, our expanded pilot
of Walmart Express focuses
on the rural quick-trip. Neighborhood Markets and Express
deliver convenience and
customer access to fresh foods, pharmacy and fuel. Overall,
we’ll add between 21 and
23 million retail square feet, representing between 385 and 415
units in fiscal 2015.
We’ll also connect Walmart’s physical assets to the broad
assortment that is available
through nearby stores and online, delivering anytime access to
our brand. We’re testing
grocery delivery in several markets and also piloting an easy
pickup option for online
grocery and general merchandise. Innovations such as these
expand our reach to more
customers on their terms.
Walmart 2014 Annual Report 7
“ We’re offering
customers con-
venient digital and
physical access to
Walmart’s broad
merchandise
assortment and
investing in price
leadership to
provide even
greater value.”
Bill Simon
President and CEO
Walmart U.S.
Positioning our portfolio for
continued growth
In fiscal 2014, Walmart International’s net sales, excluding the
impact of currency exchange
rate fluctuations and acquisitions, increased 4.6 percent to
$140.9 billion. We added
12.5 million square feet and 324 stores, bringing our total
portfolio to more than
6,100 stores. We also grew or maintained market share in most
countries, despite a
challenging macroeconomic environment where household
incomes were stretched
and competition remained high.
Targeting the most promising opportunities. International will
continue to be a
growth vehicle for Walmart. We’re focused on driving comp
sales in all markets and
investing in relevant formats and channels, including e-
commerce and mobile. During
the year, we took steps to strengthen our position in Brazil,
Chile, China and Mexico
and expect these actions to help us deliver our financial
priorities.
We’re excited about opportunities for growth in e-commerce.
Our investments in
infrastructure and talent are accelerating International’s digital
expansion and providing
options for customers with diverse shopping habits. For
example, Asda’s rapidly growing
online grocery business exemplifies the physical-digital
convergence, creating a customer
experience that only Walmart can deliver. Brazil e-commerce
sales grew at nearly twice
the market rate last year, and Yihaodian is one of China’s
fastest-growing e-commerce
sites, offering customers both grocery and general merchandise.
In addition, we’re
increasing our investments in Mexico and Canada to drive
growth.
Customers around the world still want and need value. We’ll
deliver EDLP for them by
continuing to invest in price. EDLP builds trust with customers
while saving them money,
whether it’s “Worry Free” pricing in China or the “Asda Price
Guarantee” in the U.K. Our
objective is to fund this investment by being the lowest-cost
operator in every market.
We continue to expand our capabilities to buy, operate and sell
for less. In partnership
with our global leverage teams, we’re driving innovative
technology and process
improvements, all with a lens on greater customer relevance.
Taking corporate responsibility to a higher level. At the core of
International are
the outstanding associates, who are dedicated to serving our
customers. We continue
to recruit some of the best global talent in retail to complement
our current teams, and
we’re investing in training and development of current
associates. For example, in the
last year, we ramped up our efforts with the merchant leadership
academy to provide
advanced training in merchandising strategy and execution.
As a global company, we have responsibilities to the countries
in which we operate,
and we earn trust through our commitment to compliance, social
and environmental
issues. We remain vigilant in our focus to have the most
compliant processes and
capabilities, to support charities and to lead on environmental
sustainability to improve
the communities that we serve.
International
8 Walmart 2014 Annual Report
“ To drive sales and
build long-term
value, we’re
focused on price
leadership and
operational
excellence while
investing in the
formats and
channels that
customers want.”
David Cheesewright
President and CEO
Walmart International
Top left: Our EDLP strategy in Canada, supported by
Rollbacks, provides one-stop shopping at great values.
Top right: Bodega Express provides Mexican customers
with convenient access to Walmart.
Middle right: We expect to continue our growth in
China by opening 110 additional facilities by 2016.
Bottom right: Supercenters in Mexico provide a broad
assortment with local relevance at everyday low prices.
Bottom left: Asda customers enjoy the quality of
George apparel. Overall, Asda will invest £1.25 billion in
price and quality over the next 5 years.
More than
6,100
retail units
operated in
26
countries
1.6 million
demos in
630 clubs
last year
Top left: Members appreciate our merchandise
transformation focused on price, bulk, quality
and excitement.
Top right: Sam’s Club helps business members supply
their needs in restaurants, convenience stores, and others.
Middle top right: Initiatives to promote the health
and wellness of members is a key priority.
Middle bottom right: Sales of traffic-driving categories,
such as fresh produce, saw strong growth in fiscal 2014.
Bottom right: The Instant Savings Books add further
value to a membership.
Bottom left: We’ve expanded self checkouts,
increasing convenience for our Savings, Plus and
business members.
Walmart 2014 Annual Report 11
Rosalind Brewer
President and CEO
Sam’s Club
“ We’re focused
on creating even
more value for
our members,
through great
merchandise
at exceptional
values. Our new
membership
enhancements
will make a Sam’s
Club membership
more rewarding
than ever. “
Offering unique merchandise
at exceptional values
In fiscal 2014, Sam’s Club delivered greater value to members,
opened new clubs and
improved the ability to shop anytime, anywhere through e-
commerce and mobile
initiatives. Net sales increased 1.3 percent to $57.2 billion and
operating income was
$2.0 billion. Excluding the 30 basis point fuel impact, comp
sales increased 0.7 percent.
Membership income was the strongest it’s been in many years,
growing 5.9 percent,
primarily due to the fee increase implemented in May.
More new ways to excite our members. The initial steps of our
merchandise
transformation are energizing members to buy. We boost
member traffic by offering
exciting new merchandise, including quality national brands, at
exceptional values. We
had great success in home and apparel and plan to continue
rolling out even more new
merchandise across our clubs. Our highly engaged associates
drive member excitement
by providing great service that enhances the membership
experience.
A seamless multi-channel offering creates an integrated member
experience. Improved
e-commerce and mobile platforms strengthen conversions,
particularly in mobile trans-
actions. We’re fully integrating our samsclub.com team with
Walmart Global eCommerce
to strengthen digital capabilities and support continued sales
growth.
We’re also focused on member relevance by leveraging Big
Data to better understand our
members’ needs. These insights increase efficiency and
productivity in our clubs. Data
helps us predict whether a mom is planning family meals or an
entrepreneur is launching
a new business and enables personalized interactions that make
their membership
experience more rewarding.
Sam’s Club opened 20 new, relocated or expanded clubs in
fiscal 2014, the largest number
of openings in several years. We invested in membership
acquisition to build a critical mass
in our new club openings, including the use of social media
marketing. In fiscal 2015, we
plan to open between 17 and 22 new, relocated or expanded
units.
Making membership more rewarding than ever. We’re using
Instant Savings Books
(ISB) as an important tool to demonstrate price leadership. We
discount top-selling brands,
popular items and new products throughout the club and online
to provide greater
value. Offered several times throughout the year, ISBs also
drive member awareness
to categories they might not typically shop.
This summer, we’ll launch two new membership enhancements.
First, we’ll roll out
cash rewards nationally, providing an opportunity to reward our
best members, grow
membership income and drive loyalty. Second, we’ll introduce a
new cash-back credit
card offering. Both enhancements will provide significant value
to our members, making
a membership with Sam’s Club more rewarding than ever.
12 Walmart 2014 Annual Report
Accelerating growth through
e-commerce integration
Walmart 2014 Annual Report 12
In China, Yihaodian’s new,
more intuitive mobile app
has helped expand mobile
transactions eightfold in
one year.
In the U.S., walmart.com customers
enjoy an expanded online assortment
of more than 5 million SKUs and
convenient delivery options to their
home or through Site to Store.
We’re investing in new fulfillment centers
to provide faster delivery in the U.S., U.K.
and Brazil.
13 Walmart 2014 Annual Report Walmart 2014 Annual Report
13
Walmart To Go, now in
test in the U.S., leverages
best practices from our
successful Asda grocery
delivery business in the U.K.
Traffic on Sam’s Club’s
mobile platform nearly
doubled in the last year.
After a threefold increase in
site traffic, walmart.com in
Brazil consistently ranks as the
#1 or #2 most visited retail site.
“ Best in class e-commerce,
plus the assets of the world’s
largest retailer, allow Walmart
to do for customers what no
one else can.”
Neil Ashe,
President and CEO,
Global eCommerce
Walmart’s strength as a retailer has continued through more
than five decades of economic change and retail industry
transformation. It’s a remarkable record, based on our unique
ability to deliver on our purpose for customers, the strength
of our culture and the foundation of strong governance by
our Board of Directors. All of this together allows Walmart to
improve shareholder value.
Our Board is more diverse than most public company boards,
with broad global business expertise ranging from technology
to retail, and finance to compliance. Our directors’ diverse per-
spectives and experiences provide the support and foundation
for our management team, as they refine our business strategy
for changing customer needs.
Walmart’s Board views succession planning as a critical
responsibility, and it’s a topic upon which the company has
spent considerable time and effort. This diligence has served
shareholders well, as we’ve added talented new directors over
the past few years. And, we were very pleased to name Doug
McMillon to our Board and as Walmart’s new CEO following
Mike Duke’s retirement.
Stability and high governance standards. Doug becomes
only the fourth CEO of Walmart since Dad separated the roles
of Chairman and CEO in 1988. That, too, is a remarkable record
of stability and the high governance standards established by
our Board. Doug is a superb choice to lead Walmart. He has
grown up in the company – starting as an hourly associate in
one of our distribution centers at the age of 17. After complet-
ing his MBA program, Doug began what is now a 23-year
record
of effective leadership that has prepared him to serve as CEO.
He keenly understands everything Walmart – people, our core
operations, opportunities and challenges at a fundamental level.
Doug is deeply grounded in Walmart’s culture, including the
importance of “staying out in front of change,” as Dad used to
say. I’m confident that Doug’s leadership will provide Walmart
a bright and robust future.
Mike served exceptionally well as CEO for the past five years,
and his contributions to Walmart over his 18-year career are
many. In each leadership role, Mike demonstrated integrity in
dealing with tough issues, displayed the greatest character and
consideration for people, and had a steely determination to do
the right thing for our associates, shareholders and the com-
munities we serve. Among Mike’s signature contributions as
CEO was his commitment to investing in our global e-commerce
business, critical for Walmart’s long-term growth. In addition,
Mike’s passion for increasing productivity re-engaged the
company in leveraging expenses so that we can lower prices
for our customers. Mike is a terrific leader, and I’m extremely
pleased that we’ll continue to benefit from his insight as a
member of our Board.
A commitment to board independence. Our family is proud
to have a representation in guiding Walmart’s future, but we’re
committed to independent board governance. Today, 10 of
our 16 incumbent directors are independent. These men and
women are dedicated to serving shareholders. In fact, our
directors attended 97 percent of Board and committee meet-
ings in fiscal 2014. They challenge management on delivering
business objectives and employing strategies to win in this
shifting global retail landscape. And the Board consistently
evaluates steps to strengthen governance. Since my letter to
you last year, we increased the stock ownership guidelines
for our CEO and certain executive officers to further align their
interests with long-term shareholder value. We also amended
Walmart’s bylaws to allow shareholders owning at least
10 percent of outstanding shares to request a special
shareholders’
meeting. In addition, Dr. James Cash was appointed Presiding
Director, bringing tremendous experience from his service on
Walmart’s and other boards. And, reflecting our commitment to
independence, the Board amended our Corporate Governance
Guidelines to clarify and expand the roles and responsibilities
of the Presiding Director.
Our Board also has overseen significant enhancements to our
global compliance program. For more details on this progress,
I encourage you to review “Walmart’s Global Compliance
Program: Report on Fiscal Year 2014,” on our website at
stock.walmart.com. You can also review our proxy statement
for further details about our board members, governance
structure and executive compensation.
In closing, Dad woke up every day trying to make things better,
and was never satisfied when they were good or even great.
Today, that passion for continuous improvement remains
thoroughly embedded in Walmart, and especially in our new
CEO. With an enduring commitment to strong corporate
governance and effective leaders to chart our course, I’m
confident that our remarkable story of progress will continue.
S. Robson Walton
Chairman of the Board of Directors
Wal-Mart Stores, Inc.
Strong governance:
a commitment
that endures
Board Committees:
Name Audit
Comp.,
Nominating &
Governance Executive
Global
Comp.
Strategic
Planning
& Finance
Tech &
e-commerce
S. Robson Walton
Aida M. Alvarez
James I. Cash, Jr., Ph.D.(FE)
Roger C. Corbett
Pamela J. Craig (FE)
Douglas N. Daft
Michael T. Duke (C)
Timothy P. Flynn(FE)
Name Audit
Comp.,
Nominating &
Governance Executive
Global
Comp.
Strategic
Planning
& Finance
Tech &
e-commerce
Marissa A. Mayer
Doug McMillon (C)
Gregory B. Penner (C)
Steven S Reinemund (C)
H. Lee Scott, Jr.
Jim C. Walton
Christopher J. Williams(FE) (C)
Linda S. Wolf (C)
(C) Committee Chair (FE) Financial Expert
Walmart 2014 Annual Report 15
From Left to right:
1| Linda S. Wolf
Ms. Wolf is the retired Chairman of the Board of Directors
and Chief Executive Officer of Leo Burnett Worldwide, Inc.,
an advertising agency and division of Publicis Groupe S.A.
2| Steven S Reinemund
Mr. Reinemund is the Dean of Business and Professor of
Leadership and Strategy at Wake Forest University. He
previously served as the Chairman of the Board and
Chairman and Chief Executive Officer of PepsiCo, Inc.
3| James I. Cash, Jr., Ph.D. (Presiding director)
Dr. Cash is the James E. Robison Emeritus Professor of
Business Administration at Harvard Business School,
where he served from July 1976 to October 2003.
4| H. Lee Scott, Jr.
Mr. Scott is the former Chairman of the Executive
Committee of the Board of Directors of Wal-Mart
Stores, Inc. He is the former President and Chief
Executive Of ficer of Wal-Mart Stores, Inc., serving in
that position from Januar y 2000 to Januar y 2009.
5| Roger C. Corbett
Mr. Corbett is the retired Chief Executive Officer and
Group Managing Director of Woolworths Limited, the
largest retail company in Australia.
6| Aida M. Alvarez
Ms. Alvarez is the former Administrator of the U.S. Small
Business Administration and was a member of President
Clinton’s Cabinet from 1997 to 2001.
7| Jim C. Walton
Mr. Walton is the Chairman of the Board of Directors
and Chief Executive Officer of Arvest Bank Group, Inc.,
a group of banks operating in the states of Arkansas,
Kansas, Missouri and Oklahoma.
8| S. Robson Walton
Mr. Walton is the Chairman of the Board of Directors
of Wal-Mart Stores, Inc.
9| Gregory B. Penner
Mr. Penner is a General Partner at Madrone Capital
Partners, an investment management firm.
10| Timothy P. Flynn
Mr. Flynn is the retired Chairman of KPMG
International, a professional services firm.
11| Michael T. Duke
Mr. Duke is the Chairman of the Executive Committee of
the Board of Directors of Wal-Mart Stores, Inc. He is the
former President and Chief Executive Officer of Wal-Mart
Stores, Inc., serving in that position from February 2009
to January 2014.
12| Marissa A. Mayer
Ms. Mayer is the Chief Executive Officer and President and
Director of Yahoo!, Inc., a digital media company.
13| Douglas N. Daft
Mr. Daft is the retired Chairman of the Board of Directors
and Chief Executive Officer of The Coca-Cola Company,
a beverage manufacturer, where he served in that
capacity from Februar y 2000 until May 2004, and in
various other capacities since 1969.
14| C. Douglas McMillon
Mr. McMillon is the President and Chief Executive Officer
of Wal-Mart Stores, Inc.
15| Christopher J. Williams
Mr. Williams is the Chairman of the Board of Directors and
Chief Executive Officer of The Williams Capital Group, L.P.,
an investment bank.
16| Pamela J. Craig
Ms. Craig is the retired Chief Financial Of ficer of
Accenture plc, a global management consulting,
technology services, and outsourcing company.
Board of Directors
16 Walmart 2014 Annual Report
Fiscal 2014 was a tough year for Walmart. Sales and earnings
were not where we wanted them
to be, as we faced a number of economic headwinds around the
world. But I’m confident in our
future because Walmart continues to have an extremely strong
underlying business. We’re proud
of our AA credit rating – the highest in the retail industry. We
have a strong balance sheet, and our
business consistently generates robust cash flows. Walmart’s
EDLC-EDLP business model resonates
with customers, and even in this challenging retail environment,
we delivered more than $473 billion
in net sales. We also have great opportunities for continued
global growth, whether it’s through
the intersection of digital and physical retail, small format
stores, or our increasing membership in
Sam’s Club. When I consider our opportunities ahead, I’m
excited about our future, and specifically
this new fiscal year.
At Walmart, we’re guided by our financial priorities – growth,
leverage and returns. Customers
want to shop on their terms. We’re focused on growth by
providing customers a unified shopping
experience, whether they’re in our supercenters for a large
“stock-up trip,” in our smaller stores for
groceries, or on their mobile device at their child’s ball game.
Our top priority is to increase comp
sales in all markets and channels. We drive productivity to
deliver EDLC so we can pass savings to
customers. These price investments provide greater value under
our EDLP position to propel comp
sales. In fiscal 2015, we’ll also invest approximately $12.4
billion to $13.4 billion in physical and digital
assets to better serve customers worldwide. We expect to add
between 35 million and 39 million
net new retail square feet. And to connect with customers more
effectively, we’re accelerating
the rollout of small format stores in many of our markets,
including the U.S., the U.K. and Mexico.
Global eCommerce saw strong growth in fiscal 2014, with a 30
percent increase in sales. We’ll
continue to invest to enhance technology platforms and expand
fulfillment networks, including
new facilities in Pennsylvania, Indiana and Brazil.
Infrastructure investments help us to be nimble
platform, Pangaea, will deliver a world-class integrated
customer experience and improve our website
speed, flexibility and scalability when it begins to roll out later
this year. We’re also leveraging global
best practices to increase site visits and add services such as the
Asda Direct kiosk – which allows
customers to order from online catalogs while they’re still in
the store – to grocery delivery and
drive-through pickup, which we’re testing in Denver in the U.S.
In fiscal 2015, we expect Global
eCommerce gross merchandise value, which includes digital
sales of Walmart goods and third-party
sales through our sites, to exceed $13 billion.
We’re committed to being the lowest cost operator globally and
leveraging expenses. In fiscal
2014, Walmart U.S. did a great job of leveraging operating
expenses, and International and Sam’s Club
took steps to lower their cost structures. We’re sharpening our
ability to drive efficiencies in all
operations. Globally, our teams are identifying best practices
and sharing these efficiency measures
so that they can be applied across the organization.
Returning value to shareholders remains a key priority. In fact,
we returned $12.8 billion to
shareholders through dividends and share repurchases last year,
bringing our five-year total to
nearly $68 billion. And, in February, we announced our 41st
consecutive annual dividend increase
to $1.92 per share.
As I close, I encourage you to review our financial results in the
next section. We’re focused on
consistent execution in every market to continue to serve our
customers and deliver growth,
leverage and returns for shareholders.
Charles M. Holley, Jr.
Executive Vice President and Chief Financial Officer
Wal-Mart Stores, Inc.
Our FY 2014
Financial Performance
“ At Walmart,
we’re guided
by our financial
priorities – growth,
leverage and
returns.”
Charles Holley, Jr.
Walmart 2014 Annual Report 17
Executive Officers
Neil M. Ashe
Executive Vice President, President and
Chief Executive Officer, Global eCommerce
Daniel J. Bartlett
Executive Vice President, Corporate Affairs
Rosalind G. Brewer
Executive Vice President, President and
Chief Executive Officer, Sam’s Club
M. Susan Chambers
Executive Vice President, Global People
David Cheesewright
Executive Vice President, President and
Chief Executive Officer, Walmart International
Michael T. Duke
Chairman of the Executive Committee
of the Board of Directors
Rollin L. Ford
Executive Vice President and
Chief Administrative Officer
Jeffrey J. Gearhart
Executive Vice President, Global Governance and
Corporate Secretary
Charles M. Holley, Jr.
Executive Vice President and Chief Financial Officer
C. Douglas McMillon
President and Chief Executive Officer
William S. Simon
Executive Vice President, President and
Chief Executive Officer, Walmart U.S.
Steven P. Whaley
Senior Vice President and Controller
18 Five-Year Financial Summary
19 Management’s Discussion and Analysis of
Financial Condition and Results of Operations
36 Consolidated Statements of Income
Consolidated Statements of Comprehensive
Income
37 Consolidated Balance Sheets
38 Consolidated Statements of
Shareholders’ Equity
39 Consolidated Statements of Cash Flows
40 Notes to Consolidated Financial Statements
60 Report of Independent Registered Public
Accounting Firm
61 Report of Independent Registered Public
Accounting Firm on Internal Control Over
Financial Reporting
62 Management’s Report to Our Shareholders
63 Unit Counts as of January 31, 2014
64 Corporate and Stock Information
Five-Year Financial Summary
As of and for the Fiscal Years Ended January 31,
(Amounts in millions, except per share and unit count data)
2014 2013 2012 2011 2010
Operating results
Total revenues $476,294 $468,651 $446,509 $421,395 $407,697
Percentage change in total revenues from previous fiscal year
1.6% 5.0% 6.0% 3.4% 8.1%
Net sales 473,076 465,604 443,416 418,500 404,743
Percentage change in net sales from previous fiscal year 1.6%
5.0% 6.0% 3.4% 0.9%
Increase (decrease) in calendar comparable sales (1)
in the United States (0.5)% 2.4% 1.6% (0.6)% (0.8)%
Walmart U.S. (0.6)% 2.0% 0.3% (1.5)% (0.7)%
Sam’s Club 0.3% 4.1% 8.4% 3.9% (1.4)%
Gross profit margin 24.3% 24.3% 24.5% 24.8% 24.9%
Operating, selling, general and administrative expenses,
as a percentage of net sales 19.3% 19.0% 19.2% 19.4% 19.7%
Operating income $ 26,872 $ 27,725 $ 26,491 $ 25,508 $ 23,969
Income from continuing operations attributable to Walmart
15,918 16,963 15,734 15,340 14,433
Net income per common share:
Diluted income per common share from
continuing operations attributable to Walmart $ 4.85 $ 5.01
$ 4.53 $ 4.18 $ 3.72
Dividends declared per common share 1.88 1.59 1.46 1.21 1.09
Financial position
Inventories $ 44,858 $ 43,803 $ 40,714 $ 36,437 $ 32,713
Property, equipment and capital lease assets, net 117,907
116,681 112,324 107,878 102,307
Total assets 204,751 203,105 193,406 180,782 170,407
Long-term debt and long-term capital lease obligations
(excluding amounts due within one year) 44,559 41,417 47,079
43,842 36,401
Total Walmart shareholders’ equity 76,255 76,343 71,315
68,542 70,468
Unit counts
Walmart U.S. segment 4,203 4,005 3,868 3,804 3,755
Walmart International segment 6,107 5,783 5,287 4,191 3,739
Sam’s Club segment 632 620 611 609 605
Total units 10,942 10,408 9,766 8,604 8,099
(1) Comparable store and club sales include fuel. Comparable
sales include sales from stores and clubs open for the previous
12 months, including remodels, relocations and
expansions, as well as e-commerce sales.
Walmart 2014 Annual Report 1918 Walmart 2014 Annual
Report
Management’s Discussion and Analysis of
Financial Condition and Results of Operations
Overview
Wal-Mart Stores, Inc. (“Walmart,” the “Company” or “we”)
operates retail
and other stores in various formats around the world and is
committed
to saving people money so they can live better. Our operations
consist
of three reportable segments: Walmart U.S., Walmart
International and
Sam’s Club.
• The Walmart U.S. segment includes the Company’s mass
merchant
concept in the United States (“U.S.”), operating under the
“Walmart” or
“Wal-Mart” brand with various formats, including supercenters,
discount
stores, Neighborhood Markets and other small stores, as well as
walmart.com. Of our three segments, Walmart U.S. is the
largest and
has historically had the highest gross profit as a percentage of
net sales
(“gross profit rate”). In addition, Walmart U.S. has historically
contributed
the greatest amount to the Company’s net sales and operating
income.
• The Walmart International segment consists of the Company’s
operations
outside of the U.S., including various retail websites. Walmart
International
operates retail, wholesale and other types of units, including
restaurants
and some banks. The overall gross profit rate for Walmart
International is
lower than that of Walmart U.S. because of its merchandise
mix. Walmart
International has generally been our most rapidly growing
segment,
growing primarily through new stores and acquisitions and, in
recent years,
has been growing its net sales and operating income at a faster
rate than
our other segments. However, for fiscal 2014, Walmart
International sales
growth slowed due to fluctuations in currency exchange rates,
as well
as no significant acquisitions, and operating income declined as
a result
of certain operating expenses.
• The Sam’s Club segment includes the warehouse membership
clubs in
the U.S., as well as samsclub.com. Sam’s Club operates as a
membership
club warehouse with a lower gross profit rate and lower
operating
expenses as a percentage of net sales than our other segments.
At Walmart U.S., we earn the trust of our customers every day
by
providing a broad assortment of quality merchandise and
services at
everyday low prices (“EDLP”), while fostering a culture that
rewards and
embraces mutual respect, integrity and diversity. EDLP is our
pricing
philosophy under which we price items at a low price every day
so that
our customers trust that our prices will not change under
frequent pro-
motional activities. Our focus for Sam’s Club is to provide
exceptional
value on brand name and private label merchandise at “members
only”
prices for both business and personal use. Internationally, we
operate
with similar philosophies.
Our fiscal year ends on January 31 for our U.S. and Canadian
operations.
We consolidate all other operations generally using a one-month
lag and
on a calendar year basis. Our business is seasonal to a certain
extent due
to different calendar events and national and religious holidays,
as well as
different weather patterns. Historically, our highest sales
volume and
operating income have occurred in the fiscal quarter ending
January 31.
This discussion, which presents our results for the fiscal years
ended
January 31, 2014 (“fiscal 2014”), January 31, 2013 (“fiscal
2013”) and
January 31, 2012 (“fiscal 2012”), should be read in conjunction
with our
Consolidated Financial Statements and accompanying notes. We
intend
for this discussion to provide the reader with information that
will assist
in understanding our financial statements, the changes in certain
key
items in those financial statements from period to period and
the pri-
mary factors that accounted for those changes. We also discuss
certain
performance metrics that management uses to assess the
Company’s
performance. Additionally, the discussion provides information
about
the financial results of the various segments of our business to
provide a
better understanding of how those segments and their results
affect the
financial condition and results of operations of the Company as
a whole.
Throughout this Management’s Discussion and Analysis of
Financial
Condition and Results of Operations, we discuss segment
operating
income, comparable store and club sales and other measures.
Manage-
ment measures the results of the Company’s segments using,
among
other measures, each segment’s operating income, including
certain
corporate overhead allocations. From time to time, we revise the
measurement of each segment’s operating income or other
measures,
which include certain corporate overhead allocations, as
determined
by the information regularly reviewed by our chief operating
decision
maker. When we do so, the previous period amounts and
balances are
reclassified to conform to the current period’s presentation. The
amounts
disclosed for “Corporate and support” in the leverage discussion
of the
Company’s performance metrics consist of corporate overhead
and
other items not allocated to any of the Company’s segments.
Comparable store and club sales is a metric that indicates the
performance
of our existing U.S. stores and clubs by measuring the change in
sales for
such stores and clubs, including e-commerce sales, for a
particular
period from the corresponding period in the previous year.
Walmart’s
definition of comparable store and club sales includes sales
from stores
and clubs open for the previous 12 months, including remodels,
relocations, expansions and conversions, as well as e-commerce
sales.
We measure the e-commerce sales impact by including those
sales
initiated through our websites and fulfilled through our
dedicated
e-commerce distribution facilities, as well as an estimate for
sales initiated
online, but fulfilled through our stores and clubs. Changes in
format are
excluded from comparable store and club sales when the
conversion is
accompanied by a relocation or expansion that results in a
change in
retail square feet of more than five percent. Comparable store
and club
sales are also referred to as “same-store” sales by others within
the retail
industry. The method of calculating comparable store and club
sales
varies across the retail industry. As a result, our calculation of
comparable
store and club sales is not necessarily comparable to similarly
titled
measures reported by other companies.
In discussing our operating results, the term currency exchange
rates
refers to the currency exchange rates we use to convert the
operating
results for all countries where the functional currency is not the
U.S.
dollar. We calculate the effect of changes in currency exchange
rates as
the difference between current period activity translated using
the
current period’s currency exchange rates, and the comparable
prior year
period’s currency exchange rates. Throughout our discussion,
we refer
to the results of this calculation as the impact of currency
exchange rate
fluctuations. When we refer to constant currency operating
results, we
are referring to our operating results without the impact of the
currency
exchange rate fluctuations and without the impact of
acquisitions until
the acquisitions are included in both comparable periods. The
disclosure
of constant currency amounts or results permits investors to
understand
better Walmart’s underlying performance without the effects of
cur-
rency exchange rate fluctuations or acquisitions. Volatility in
currency
exchange rates may impact the results, including net sales and
operating
income, of the Company and the Walmart International segment
in
the future.
Walmart 2014 Annual Report 1918 Walmart 2014 Annual
Report
Management’s Discussion and Analysis of
Financial Condition and Results of Operations
We made certain reclassifications to prior period amounts or
balances to
conform to the presentation in the current fiscal year. These
reclassifications
did not impact the Company’s operating income or consolidated
net
income. Additionally, certain prior period segment asset and
expense
allocations have been reclassified among segments to be
comparable
with the current period presentation.
The Retail Industry
We operate in the highly competitive retail industry in all of the
countries
we serve. We face strong sales competition from other discount,
depart-
ment, drug, dollar, variety and specialty stores, warehouse clubs
and
supermarkets, as well as internet-based retailers and catalog
businesses.
Many of these competitors are national, regional or
international chains.
We compete with a number of companies for prime retail site
locations,
as well as in attracting and retaining quality employees (whom
we call
“associates”). We, along with other retail companies, are
influenced by a
number of factors including, but not limited to: catastrophic
events,
climate change, competitive pressures, consumer disposable
income,
consumer debt levels and buying patterns, consumer credit
availability,
cost of goods, currency exchange rate fluctuations, customer
preferences,
deflation, fuel and energy prices, general economic conditions,
inflation,
insurance costs, interest rates, labor costs, tax rates,
unemployment and
weather patterns. Further information on the factors that can
affect our
operating results and on certain risks to our Company and an
investment
in its securities can be located in “Item 1A. Risk Factors” in our
Annual
Report on Form 10-K for the fiscal year ended January 31,
2014, and in the
discussion under “Forward-Looking Statements.”
Company Performance Metrics
The Company’s performance metrics emphasize three priorities
for
improving shareholder value: growth, leverage and returns. The
Company’s priority of growth focuses on sales through
comparable store
and club sales, including e-commerce sales, and unit square feet
growth;
the priority of leverage encompasses the Company’s objective
to
increase its operating income at a faster rate than the growth in
net sales
by growing its operating, selling, general and administrative
expenses
(“operating expenses”) at a slower rate than the growth of its
net sales;
and the priority of returns focuses on how efficiently the
Company
employs its assets through return on investment and how
effectively the
Company manages working capital through free cash flow.
Growth
Net Sales
Fiscal Years Ended January 31,
(Amounts in millions) 2014 2013 2012
Percent Percent Percent Percent Percent
Net Sales of Total Change Net Sales of Total Change Net
Sales of Total
Walmart U.S. $279,406 59.0% 1.8% $274,433 59.0% 3.9%
$264,186 59.6%
Walmart International 136,513 28.9% 1.3% 134,748 28.9%
7.4% 125,435 28.3%
Sam’s Club 57,157 12.1% 1.3% 56,423 12.1% 4.9% 53,795
12.1%
Net sales $473,076 100.0% 1.6% $465,604 100.0% 5.0%
$443,416 100.0%
Our consolidated net sales increased 1.6% and 5.0% for fiscal
2014 and 2013, respectively, when compared to the previous
fiscal year. The increase
in net sales for fiscal 2014 was primarily due to 3.1% year-
over-year growth in retail square feet, higher e-commerce sales,
the impact of fiscal 2013
acquisitions, which accounted for $730 million of the net sales
increase, and positive comparable club sales at Sam’s Club. The
positive effect of these
items was partially offset by $5.1 billion of negative impact
from fluctuations in currency exchange rates and decreases in
comparable store sales at
Walmart U.S. and in a number of our international operations.
The increase in net sales for fiscal 2013 was due to 3.3% growth
in retail square feet
and positive comparable store and club sales. Additionally, net
sales from acquisitions, through their respective anniversary
dates, accounted for
$4.0 billion of the increase in net sales. The increase in net
sales for fiscal 2013 was partially offset by $4.5 billion of
negative impact from fluctuations in
currency exchange rates.
Walmart 2014 Annual Report 2120 Walmart 2014 Annual
Report
Management’s Discussion and Analysis of
Financial Condition and Results of Operations
Calendar Comparable Store and Club Sales
Comparable store and club sales is a metric that indicates the
performance of our existing U.S. stores and clubs by measuring
the change in sales
for such stores and clubs, including e-commerce sales, for a
particular period over the corresponding period in the previous
year. The retail industry
generally reports comparable store and club sales using the
retail calendar (also known as the 4-5-4 calendar) and, to be
consistent with the retail
industry, we provide comparable store and club sales using the
retail calendar in our quarterly earnings releases. However,
when we discuss our
comparable store and club sales below, we are referring to our
calendar comparable store and club sales calculated using our
fiscal calendar. As our
fiscal calendar differs from the retail calendar, our calendar
comparable store and club sales also differ from the retail
calendar comparable store
and club sales provided in our quarterly earnings releases.
Calendar comparable store and club sales, as well as the impact
of fuel, for fiscal 2014
and 2013, were as follows:
With Fuel Fuel Impact
Fiscal Years Ended January 31, Fiscal Years Ended January 31,
2014 2013 2014 2013
Walmart U.S. (0.6)% 2.0% 0.0% 0.0%
Sam’s Club 0.3% 4.1% (0.3)% 0.3%
Total U.S. (0.5)% 2.4% (0.1)% 0.1%
Comparable store and club sales in the U.S., including fuel,
decreased 0.5% in fiscal 2014 and increased 2.4% in fiscal
2013, when compared to the
previous fiscal year. The total U.S. comparable store and club
sales for fiscal 2014 were negatively impacted by lower
consumer spending primarily due
to the slow recovery in general economic conditions, the 2%
increase in the 2013 payroll tax rate, and the reduction in
government food benefits and
severe winter storms that occurred during the fourth quarter.
These factors were partially offset by increased member traffic
at Sam’s Club primarily
coming from Savings Members. Additionally, e-commerce sales
positively impacted Walmart U.S. comparable store and Sam’s
Club comparable club
sales percentages by approximately 0.3%. The total U.S.
comparable store and club sales for fiscal 2013 increased as a
result of improved average ticket
and an increase in customer traffic.
As we continue to add new stores and clubs in the U.S., we do
so with an understanding that additional stores and clubs may
take sales away from
existing units. We estimate the negative impact on comparable
store and club sales as a result of opening new stores and clubs
was approximately
0.8% and 0.7% in fiscal 2014 and 2013, respectively. Our
estimate is calculated primarily by comparing the sales trends of
the impacted stores and
clubs, which are identified based on their proximity to the new
stores and clubs, to those of nearby non-impacted stores and
clubs, in each case,
as measured after the new stores and clubs are opened.
Leverage
Operating Income
Fiscal Years Ended January 31,
(Amounts in millions) 2014 2013 2012
Operating Percent Percent Operating Percent Percent
Operating Percent
Income of Total Change Income of Total Change Income of
Total
Walmart U.S. $22,351 83.2% 4.0% $21,491 77.5% 5.4%
$20,381 76.9%
Walmart International 5,454 20.3% (17.6)% 6,617 23.9% 8.2%
6,113 23.1%
Sam’s Club 1,975 7.3% 0.8% 1,960 7.1% 6.3% 1,844 7.0%
Corporate and support (2,908) (10.8)% 24.1% (2,343) (8.5)%
26.9% (1,847) (7.0)%
Operating income $26,872 100.0% (3.1)% $27,725 100.0% 4.7%
$26,491 100.0%
We believe comparing both the growth of our operating
expenses and our operating income to the growth of our net
sales are meaningful measures
as they indicate how effectively we manage costs and leverage
operating expenses. Our objective for a fiscal year is to grow
operating expenses at a
slower rate than net sales and to grow operating income at a
faster rate than net sales. On occasion, we may make strategic
growth investments that
may, at times, cause our operating expenses to grow at a faster
rate than net sales and that may result in our operating income
growing at a slower
rate than net sales.
Walmart 2014 Annual Report 2120 Walmart 2014 Annual
Report
Management’s Discussion and Analysis of
Financial Condition and Results of Operations
Operating Expenses
For fiscal 2014, we did not meet our objective of growing
operating
expenses at a slower rate than net sales as operating expenses as
a
percentage of net sales increased 27 basis points. Overall,
lower than
anticipated net sales, higher investment in key areas, such as
global
leverage and e-commerce initiatives, and nearly $1.0 billion of
increased
expenses for various matters described in the Walmart
International seg-
ment discussion, were the primary causes for the increase in
operating
expenses as a percentage of net sales. Additional expenses
related to the
Foreign Corrupt Practices Act (“FCPA”) inquiries and
investigations, as well
as our global compliance program and related organizational
enhancements,
also contributed to the increase in operating expenses as a
percentage of
net sales. The negative leverage impact of these items was
partially offset
by lower incentive expenses for fiscal 2014. For fiscal 2013, we
met our
objective of growing operating expenses at a slower rate than
net sales
as operating expenses as a percentage of net sales decreased 14
basis
points. The fiscal 2013 decrease in operating expenses as a
percentage
of net sales was primarily due to productivity improvements and
expense management.
Expenses incurred for the FCPA inquiries and investigations, as
well as our
global compliance program and related organizational
enhancements,
were $282 million and $157 million for fiscal 2014 and 2013,
respectively.
Operating Income
For fiscal 2014, we did not meet our objective of growing
operating
income at a faster rate than net sales as operating income
decreased
3.1% while net sales increased 1.6%, when compared to the
previous
fiscal year. This was primarily due to the factors we discussed
for not
leveraging operating expenses, partially offset by increases in
member-
ship and other income of 5.6%. For fiscal 2013, we also did not
meet our
objective of growing operating income at a faster rate than net
sales as
operating income increased 4.7% while net sales increased
5.0%, when
compared to the previous fiscal year. The primary causes for
operating
income growing slower than net sales in fiscal 2013 were our
increased
investments in e-commerce initiatives, increased expenses
related to
the FCPA inquiries and investigations, as well as our global
compliance
program and related organizational enhancements, and
investments
in price, which reduced gross margin.
Returns
Return on Investment
Management believes return on investment (“ROI”) is a
meaningful
metric to share with investors because it helps investors assess
how
effectively Walmart is deploying its assets. Trends in ROI can
fluctuate
over time as management balances long-term potential strategic
initiatives with possible short-term impacts. ROI was 17.0%
and 18.1% for
fiscal 2014 and 2013, respectively. The decline in ROI was
primarily due to
a decline in operating income, investments in property and
equipment
and the impact of acquisitions.
ROI is considered a non-GAAP financial measure. We consider
return on
assets (“ROA”) to be the financial measure computed in
accordance with
generally accepted accounting principles (“GAAP”) that is the
most
directly comparable financial measure to our calculation of
ROI. ROA was
8.1% and 8.9% for fiscal 2014 and 2013, respectively.
We define ROI as adjusted operating income (operating income
plus
interest income, depreciation and amortization, and rent
expense) for
the trailing twelve months or fiscal year divided by average
invested
capital during that period. We consider average invested capital
to be
the average of our beginning and ending total assets of
continuing
operations, plus average accumulated depreciation and
amortization
less average accounts payable and average accrued liabilities
for that
period, plus a rent factor equal to the rent for the fiscal year or
trailing
twelve months multiplied by a factor of eight. When we have
discontinued
operations, we exclude the impact of the discontinued
operations.
Our calculation of ROI is considered a non-GAAP financial
measure
because we calculate ROI using financial measures that exclude
and
include amounts that are included and excluded in the most
directly
comparable GAAP financial measure. For example, we exclude
the
impact of depreciation and amortization from our reported
operating
income in calculating the numerator of our calculation of ROI.
In addi-
tion, we include a factor of eight for rent expense that estimates
the
hypothetical capitalization of our operating leases. ROI differs
from ROA
(which is consolidated income from continuing operations for
the period
divided by average total assets of continuing operations for the
period)
because ROI: adjusts operating income to exclude certain
expense items
and adds interest income; adjusts total assets of continuing
operations
for the impact of accumulated depreciation and amortization,
accounts
payable and accrued liabilities; and incorporates a factor of rent
to arrive
at total invested capital.
Although ROI is a standard financial metric, numerous methods
exist
for calculating a company’s ROI. As a result, the method used
by
management to calculate our ROI may differ from the methods
used by
other companies to calculate their ROI. We urge you to
understand
the methods used by other companies to calculate their ROI
before
comparing our ROI to that of such other companies.
Walmart 2014 Annual Report 2322 Walmart 2014 Annual
Report
Management’s Discussion and Analysis of
Financial Condition and Results of Operations
The calculation of ROI, along with a reconciliation to the
calculation of
ROA, the most comparable GAAP financial measure, is as
follows:
Fiscal Years
Ended January 31,
(Amounts in millions) 2014 2013
CALCULATION OF RETURN ON INVESTMENT
Numerator
Operating income $ 26,872 $ 27,725
+ Interest income 119 186
+ Depreciation and amortization 8,870 8,478
+ Rent 2,828 2,581
= Adjusted operating income $ 38,689 $ 38,970
Denominator
Average total assets
of continuing operations (1) $203,680 $198,193
+ Average accumulated depreciation
and amortization (1) 57,907 51,829
- Average accounts payable (1) 37,748 37,344
- Average accrued liabilities (1) 18,802 18,481
+ Rent x 8 22,624 20,648
= Average invested capital $227,661 $214,845
Return on investment (ROI) 17.0% 18.1%
CALCULATION OF RETURN ON ASSETS
Numerator
Income from continuing operations $ 16,551 $ 17,704
Denominator
Average total assets
of continuing operations (1) $203,680 $198,193
Return on assets (ROA) 8.1% 8.9%
As of January 31,
2014 2013 2012
Certain Balance Sheet Data
Total assets of
continuing operations (2) $204,291 $203,068 $193,317
Accumulated depreciation
and amortization 60,771 55,043 48,614
Accounts payable 37,415 38,080 36,608
Accrued liabilities 18,793 18,808 18,154
(1) The average is based on the addition of the account balance
at the end of the current
period to the account balance at the end of the prior period and
dividing by 2.
(2) Total assets of continuing operations as of January 31,
2014, 2013 and 2012 in the
table exclude assets of discontinued operations that are
reflected in the Company’s
Consolidated Balance Sheets of $460 million, $37 million and
$89 million, respectively.
Free Cash Flow
We define free cash flow as net cash provided by operating
activities
in a period minus payments for property and equipment made in
that
period. We generated free cash flow of $10.1 billion, $12.7
billion and
$10.7 billion for fiscal 2014, 2013 and 2012, respectively. The
decline in free
cash flow for fiscal 2014, when compared to the previous fiscal
year, was
primarily due to the timing of income tax payments, as well as
lower income
from continuing operations and slightly higher capital
expenditures. The
fiscal 2013 increase in free cash flow was primarily due to
higher income
from continuing operations positively impacting net cash
generated
from operating activities and lower capital expenditures.
Free cash flow is considered a non-GAAP financial measure.
We consider
net cash provided by operating activities to be the GAAP
financial
measure most directly comparable to free cash flow.
Management
believes that free cash flow, which measures our ability to
generate
additional cash from our business operations, is an important
financial
measure for use in evaluating the Company’s financial
performance. Free
cash flow should be considered in addition to, rather than as a
substitute
for, consolidated income from continuing operations as a
measure of our
performance and net cash provided by operating activities as a
measure
of our liquidity.
Additionally, our definition of free cash flow is limited, in that
it does not
represent residual cash flows available for discretionary
expenditures as
the measure does not deduct the payments required for debt
service
and other contractual obligations or payments made for business
acqui-
sitions. Therefore, we believe it is important to view free cash
flow as a
measure that provides supplemental information to our
Consolidated
Statements of Cash Flows.
Although other companies report their free cash flow, numerous
methods may exist for calculating a company’s free cash flow.
As a result,
the method used by our management to calculate our free cash
flow
may differ from the methods used by other companies to
calculate their
free cash flow. We urge you to understand the methods used by
other
companies to calculate their free cash flow before comparing
our free
cash flow to that of such other companies.
The following table sets forth a reconciliation of free cash flow
to net cash
provided by operating activities, as well as information
regarding net
cash used in investing activities and net cash used in financing
activities.
Fiscal Years Ended January 31,
(Amounts in millions) 2014 2013 2012
Net cash provided by
operating activities $ 23,257 $ 25,591 $ 24,255
Payments for property
and equipment (13,115) (12,898) (13,510)
Free cash flow $ 10,142 $ 12,693 $ 10,745
Net cash used in
investing activities (1) $(12,298) $(12,611) $(16,609)
Net cash used in
financing activities (11,017) (11,972) (8,458)
(1) “Net cash used in investing activities” includes payments
for property and
equipment, which is also included in our computation of free
cash flow.
Walmart 2014 Annual Report 2322 Walmart 2014 Annual
Report
Management’s Discussion and Analysis of
Financial Condition and Results of Operations
Results of Operations
Consolidated Results of Operations
(Amounts in millions,
Fiscal Years Ended January 31,
except unit counts) 2014 2013 2012
Total revenues $476,294 $468,651 $446,509
Percentage change in
total revenues from
previous fiscal year 1.6% 5.0% 6.0%
Net sales $473,076 $465,604 $443,416
Percentage change in
net sales from
previous fiscal year 1.6% 5.0% 5.9%
Total U.S. calendar comparable
store and club sales (0.5)% 2.4% 1.6%
Gross profit margin as a
percentage of net sales 24.3% 24.3% 24.5%
Operating income $ 26,872 $ 27,725 $ 26,491
Operating income as a
percentage of net sales 5.7% 6.0% 6.0%
Income from continuing
operations $ 16,551 $ 17,704 $ 16,408
Unit counts at period end 10,942 10,408 9,766
Retail square feet at period end 1,101 1,070 1,035
Our total revenues, which are mostly comprised of net sales, but
also
include membership and other income, increased 1.6% and 5.0%
for fiscal
2014 and 2013, respectively, when compared to the previous
fiscal year.
The increase in total revenues was primarily a result of
increases in our
net sales, which also increased 1.6% and 5.0% for fiscal 2014
and 2013,
respectively. The increase in net sales for fiscal 2014 was
primarily due to
3.1% year-over-year growth in retail square feet, higher e-
commerce sales,
the impact of fiscal 2013 acquisitions, which accounted for
$730 million
of the net sales increase, and positive comparable club sales at
Sam’s Club.
The positive effect of these items was partially offset by $5.1
billion of
negative impact from fluctuations in currency exchange rates
and
decreases in comparable store sales at Walmart U.S. and in a
number of
our international operations. The increase in net sales for fiscal
2013 was
due to 3.3% growth in retail square feet and positive
comparable store
and club sales. Additionally, net sales from acquisitions,
through their
respective anniversary dates, accounted for $4.0 billion of the
increase in
net sales. The increase in net sales for fiscal 2013 was partially
offset by
$4.5 billion of negative impact from fluctuations in currency
exchange
rates. Increases in membership and other income of 5.6%,
primarily due
to higher membership and other income at Sam’s Club, also
contributed
to the increase in total revenues for fiscal 2014 and 2013.
Our gross profit rate decreased 3 basis points for fiscal 2014,
when
compared to the previous fiscal year, primarily due to our
ongoing
investment in price, as well as merchandise mix. For fiscal
2013, gross
profit rate decreased 12 basis points, when compared to the
previous
fiscal year, primarily due to the Walmart U.S. segment’s
strategic focus
on price investment and low price leadership.
For fiscal 2014, we did not meet our objective of growing
operating
expenses at a slower rate than net sales as operating expenses as
a
percentage of net sales increased 27 basis points. Overall,
lower than
anticipated net sales, higher investment in key areas, such as
global
leverage and e-commerce initiatives, and nearly $1.0 billion of
increased
expenses for various matters described in the Walmart
International
segment discussion, were the primary cause for the increase in
operating
expenses as a percentage of net sales. Additional expenses
related to the
FCPA inquiries and investigations, as well as our global
compliance pro-
gram and related organizational enhancements also contributed
to the
increase in operating expenses as a percentage of net sales. The
negative
leverage impact of these items was partially offset by lower
incentive
expenses for fiscal 2014. For fiscal 2013, we met our objective
of growing
operating expenses at a slower rate than net sales as operating
expenses
as a percentage of net sales decreased 14 basis points. The
fiscal 2013
decrease in operating expenses as a percentage of net sales was
primarily
due to productivity improvements and expense management.
For fiscal 2014, we did not meet our objective of growing
operating
income at a faster rate than net sales as operating income
decreased
3.1% while net sales increased 1.6%, when compared to the
previous
fiscal year. This was primarily due to the factors we discussed
for not
leveraging operating expenses, partially offset by increases in
member-
ship and other income. For fiscal 2013, we also did not meet our
objective of growing operating income at a faster rate than net
sales as
operating income increased 4.7% while net sales increased
5.0%, when
compared to the previous fiscal year. The primary causes for
operating
income growing slower than net sales in fiscal 2013 were
investments in
e-commerce initiatives, increased expenses related to the FCPA
inquiries
and investigations, as well as our global compliance program
and related
organizational enhancements, and investments in price, which
reduced
gross margin.
Our effective income tax rates were 32.9%, 31.0% and 32.6%
for fiscal 2014,
2013 and 2012, respectively. The reconciliation from the U.S.
statutory
rate to the effective income tax rates for fiscal 2014, 2013 and
2012 is
presented in Note 9 in the “Notes to Consolidated Financial
Statements.”
Our effective income tax rate for fiscal 2014 was higher than in
fiscal 2013
primarily due to the tax impacts attributable to repatriated
international
earnings during fiscal 2014. Our fiscal 2013 effective income
tax rate was
lower than in fiscal 2012 primarily because the fiscal 2013 rate
benefited
from a number of discrete tax items, including the positive
impact from
fiscal 2013 legislative changes arising at the end of the fiscal
2012 year,
most notably the American Taxpayer Relief Act of 2012. Our
effective
income tax rate may fluctuate from period to period as a result
of factors
including changes in our assessment of certain tax
contingencies,
increases or decreases in valuation allowances, changes in tax
law,
outcomes of administrative audits, the impact of discrete items
and the
mix of earnings among our U.S. and international operations
where
the statutory rates are generally lower than the U.S. statutory
rate.
As a result of the factors discussed above, we reported $16.6
billion,
$17.7 billion and $16.4 billion of consolidated income from
continuing
operations for fiscal 2014, 2013 and 2012, respectively, a
decrease of
$1.1 billion for fiscal 2014 and an increase of $1.3 billion for
fiscal 2013,
when compared to the previous fiscal year. Diluted income per
common
share from continuing operations attributable to Walmart
(“EPS”) was
$4.85, $5.01 and $4.53 for fiscal 2014, 2013 and 2012,
respectively.
Walmart 2014 Annual Report 2524 Walmart 2014 Annual
Report
Management’s Discussion and Analysis of
Financial Condition and Results of Operations
Walmart U.S. Segment
(Amounts in millions,
Fiscal Years Ended January 31,
except unit counts) 2014 2013 2012
Net sales $279,406 $274,433 $264,186
Percentage change from
previous fiscal year 1.8% 3.9% 1.5%
Calendar comparable
store sales (0.6)% 2.0% 0.3%
Operating income $ 22,351 $ 21,491 $ 20,381
Operating income as a
percentage of net sales 8.0% 7.8% 7.7%
Unit counts at period end 4,203 4,005 3,868
Retail square feet at
period end 659 641 627
Net sales for the Walmart U.S. segment increased 1.8% and
3.9% for fiscal
2014 and 2013, respectively, when compared to the previous
fiscal year.
For fiscal 2014, the increase in net sales was due to year-over-
year growth
in retail square feet of 2.9%, partially offset by a decline in
comparable
store sales of (0.6)%. Our comparable store sales were
negatively impacted
by lower consumer spending primarily due to the slow recovery
in
general economic conditions, the 2% increase in the 2013
payroll tax
rate, and the reduction in government food benefits and severe
winter
storms that occurred in the fourth quarter. For fiscal 2013, the
increase in
net sales was due to a 2.0% increase in comparable store sales
as a result
of higher average ticket and an increase in customer traffic,
combined
with a 2.2% increase in retail square feet.
The fiscal 2014 gross profit rate declined slightly when
compared to
the previous fiscal year primarily due to our commitment to low
price
leadership, especially during fiscal 2014’s highly competitive
holiday
sales season, partially offset by cost of goods savings initiatives
and
supply chain productivity. Gross profit rate declined 16 basis
points for
fiscal 2013, when compared to the previous fiscal year,
primarily due
to our strategic focus on price investment and low price
leadership.
Walmart U.S. leveraged operating expenses for fiscal 2014 and
2013,
as operating expenses as a percentage of segment net sales
declined
18 and 27 basis points, respectively, compared to the previous
fiscal
year. The decrease in operating expenses as a percentage of
segment
net sales was driven by productivity initiatives in both years, as
well
as lower incentive expenses in fiscal 2014.
As a result of the factors discussed above, segment operating
income
was $22.4 billion, $21.5 billion and $20.4 billion during fiscal
2014, 2013
and 2012, respectively, and Walmart U.S. grew operating
income faster
than sales during fiscal 2014 and 2013.
Walmart International Segment
(Amounts in millions,
Fiscal Years Ended January 31,
except unit counts) 2014 2013 2012
Net sales $136,513 $134,748 $125,435
Percentage change from
previous fiscal year 1.3% 7.4% 15.3%
Operating income $ 5,454 $ 6,617 $ 6,113
Operating income as
a percentage of net sales 4.0% 4.9% 4.9%
Unit counts at period end 6,107 5,783 5,287
Retail square feet at period end 358 346 326
Net sales for the Walmart International segment increased 1.3%
and 7.4%
for fiscal 2014 and 2013, respectively, when compared to the
previous
fiscal year. For fiscal 2014, the increase in net sales was due to
year-over-
year growth in retail square feet of 3.6% and the impact of
fiscal 2013
acquisitions, which accounted for $730 million of the net sales
increase.
In addition, higher e-commerce sales in each country with e-
commerce
operations, particularly in the United Kingdom, Brazil and
China,
contributed to the increase in net sales. The increase in net
sales was
partially offset by $5.1 billion of negative impact from
fluctuations in
currency exchange rates. For fiscal 2013, the increase in net
sales was
due to year-over-year growth in retail square feet of 5.9% and
positive
comparable sales. In addition, net sales from fiscal 2012
acquisitions
accounted for $4.0 billion of the increase in net sales. The
increase in
net sales was partially offset by $4.5 billion of negative impact
from
fluctuations in currency exchange rates.
Gross profit rate decreased 10 basis points for fiscal 2014 and
was flat for
fiscal 2013, when compared to the previous fiscal year. The
fiscal 2014
decrease in gross profit rate was primarily due to price
investments in
certain countries, including Brazil, Canada and Mexico.
Walmart International did not leverage operating expenses for
fiscal 2014
as operating expenses as a percentage of segment net sales
increased
80 basis points, when compared to the previous fiscal year.
Operating
expenses as a percentage of segment net sales were impacted by
lower
than anticipated net sales, increased wages and strategic
investments,
including investments in e-commerce initiatives. In addition, we
incurred
nearly $1.0 billion of aggregated expenses for the following
matters that
contributed to the increase in our operating expenses as a
percentage
of segment net sales:
• Charges for contingencies for non-income taxes and
employment
claims in Brazil;
• Charges for the closure of 29 units in China and 25 units in
Brazil due
to poor performance;
• Store lease expenses in China and Mexico to correct a
historical
accounting practice that did not conform to our global
accounting
policies; and
• Expenses for the termination of the joint venture, franchise
and
supply agreements related to our former partner’s retail store
operations
in India.
Walmart 2014 Annual Report 2524 Walmart 2014 Annual
Report
Management’s Discussion and Analysis of
Financial Condition and Results of Operations
Operating expenses as a percentage of segment net sales
decreased
22 basis points in fiscal 2013, when compared to the previous
fiscal year.
Walmart International leveraged operating expenses in fiscal
2013 pri-
marily due to expense management. While each country is
focused on
leveraging operating expenses, the countries that generated the
most
leverage included Brazil, Chile and the United Kingdom in
fiscal 2013.
As a result of the factors discussed above, segment operating
income
was $5.5 billion, $6.6 billion and $6.1 billion for fiscal 2014,
2013 and 2012,
respectively. Fluctuations in currency exchange rates negatively
impacted operating income $26 million and $111 million in
fiscal 2014
and fiscal 2013, respectively, and positively impacted operating
income
$105 million in fiscal 2012. Walmart International did not grow
operating
income faster than net sales in fiscal 2014, but grew operating
income
faster than net sales in fiscal 2013.
Sam’s Club Segment
We believe the information in the following table under the
caption
“Excluding Fuel” is useful to investors because it permits
investors to
understand the effect of the Sam’s Club segment’s fuel sales on
its
results of operations, which are impacted by the volatility of
fuel prices.
Volatility in fuel prices may continue to impact the operating
results
of the Sam’s Club segment in the future.
(Amounts in millions,
Fiscal Years Ended January 31,
except unit counts) 2014 2013 2012
Including Fuel
Net sales $57,157 $56,423 $53,795
Percentage change from
comparable period 1.3% 4.9% 8.8%
Calendar comparable
club sales increase 0.3% 4.1% 8.4%
Operating income $ 1,975 $ 1,960 $ 1,844
Operating income as
a percentage of net sales 3.5% 3.5% 3.4%
Unit counts at period end 632 620 611
Retail square feet at period end 84 83 82
Excluding Fuel
Net sales $50,574 $49,789 $47,616
Percentage change from
previous fiscal year 1.6% 4.6% 5.4%
Operating income $ 1,949 $ 1,913 $ 1,805
Operating income as
a percentage of net sales 3.9% 3.8% 3.8%
Net sales for the Sam’s Club segment increased 1.3% and 4.9%
for fiscal
2014 and 2013, respectively, when compared to the previous
fiscal year.
The fiscal 2014 increase in net sales was due to year-over-year
growth in
retail square feet of 2.1%, driven by the addition of 12 new
clubs, as well
as positive comparable club sales of 0.3%. Our positive
comparable
club sales were the result of increased member traffic primarily
coming
from our Savings Members, partially offset by severe winter
storms that
occurred in the fourth quarter. The net sales increase in fiscal
2013 was
primarily due to positive comparable club sales, driven by an
increase
in customer traffic and average ticket. The addition of nine new
clubs
in fiscal 2013 also helped increase net sales.
Gross profit rate was flat for fiscal 2014 and 2013, when
compared to the
previous fiscal year. For fiscal 2014, our gross profit was
negatively impacted
by $39 million from an adjustment to our product warranty
liabilities,
which was offset by a favorable impact from merchandise mix.
Membership and other income increased 14.1% and 3.0% for
fiscal
2014 and 2013, respectively, when compared to the previous
fiscal year.
The fiscal 2014 increase was primarily due to the improved
contract terms
relating to the profit sharing arrangement with our credit card
provider,
increased membership fees that were introduced on May 15,
2013,
$24 million of income from the sale of two real estate properties
and
an increase in members from the opening of 12 new clubs. The
fiscal
2013 increase was primarily due to an increase in total members
aided
by the opening of nine new clubs.
Sam’s Club did not leverage expenses for fiscal 2014 as
operating
expenses as a percentage of segment net sales increased 26
basis points,
when compared to the previous fiscal year. The increase in
operating
expenses as a percentage of segment net sales was primarily due
to a
$59 million charge for the implementation of a new in-club
staffing
structure and the pending closure of one club, as well as a state
excise
tax refund credit we received in the previous fiscal year. Sam’s
Club
leveraged expenses for fiscal 2013 as operating expenses as a
percentage
of segment net sales decreased 9 basis points, when compared to
the
previous fiscal year. The fiscal 2013 decrease was due to
improved wage
management, a state excise tax refund credit we received and
lower
expenses in connection with club remodels.
As a result of the factors discussed above, operating income was
$2.0 billion, $2.0 billion and $1.8 billion for fiscal 2014, 2013
and 2012,
respectively. Sam’s Club did not grow operating income faster
than
net sales in fiscal 2014, but did grow operating income faster
than sales
in fiscal 2013.
Liquidity and Capital Resources
Liquidity
Cash flows provided by operating activities have historically
supplied us
with a significant source of liquidity. We use these cash flows,
supple-
mented with long-term debt and short-term borrowings, to fund
our
operations and global expansion activities. Generally, some or
all of the
remaining available cash flow funds all or part of the dividends
on our
common stock and share repurchases.
Fiscal Years Ended January 31,
(Amounts in millions) 2014 2013 2012
Net cash provided by
operating activities $ 23,257 $ 25,591 $ 24,255
Payments for property
and equipment (13,115) (12,898) (13,510)
Free cash flow $ 10,142 $ 12,693 $ 10,745
Net cash used in
investing activities (1) $(12,298) $(12,611) $(16,609)
Net cash used in
financing activities (11,017) (11,972) (8,458)
(1) “Net cash used in investing activities” includes payments
for property and equipment,
which is also included in our computation of free cash flow.
Walmart 2014 Annual Report 2726 Walmart 2014 Annual
Report
Management’s Discussion and Analysis of
Financial Condition and Results of Operations
Cash Flows Provided by Operating Activities
Cash flows provided by operating activities were $23.3 billion,
$25.6 billion
and $24.3 billion for fiscal 2014, 2013 and 2012, respectively.
The decrease
in cash flows provided by operating activities for fiscal 2014,
when
compared to the previous fiscal year, was primarily due to the
timing of
income tax payments, as well as lower income from continuing
operations.
The increase in cash flows provided by operating activities in
fiscal 2013,
when compared to the previous fiscal year, was primarily due to
higher
income for continuing operations.
Cash Equivalents and Working Capital
Cash and cash equivalents were $7.3 billion and $7.8 billion at
January 31,
2014 and 2013, respectively. Our working capital deficits were
$8.2 billion
and $11.9 billion at January 31, 2014 and 2013, respectively.
The decrease
in our working capital deficit was primarily attributable to a
decrease in
long-term debt due within one year and an increase in our
inventory
levels due to lower than anticipated sales across the Company.
Timing
differences also contributed to the decrease in our working
capital
Systems Analysis Problem Imagine that you, as Systems Analyst, h.docx

More Related Content

Similar to Systems Analysis Problem Imagine that you, as Systems Analyst, h.docx

Inf 220 Future Our Mission/newtonhelp.com
Inf 220 Future Our Mission/newtonhelp.comInf 220 Future Our Mission/newtonhelp.com
Inf 220 Future Our Mission/newtonhelp.comamaranthbeg40
 
INF 220 Learn/newtonhelp.com
INF 220 Learn/newtonhelp.comINF 220 Learn/newtonhelp.com
INF 220 Learn/newtonhelp.comlechenau48
 
INF 220 Possible Is Everything/newtonhelp.com
INF 220 Possible Is Everything/newtonhelp.comINF 220 Possible Is Everything/newtonhelp.com
INF 220 Possible Is Everything/newtonhelp.comlechenau71
 
INF 220 Inspiring Innovation/tutorialrank.com
 INF 220 Inspiring Innovation/tutorialrank.com INF 220 Inspiring Innovation/tutorialrank.com
INF 220 Inspiring Innovation/tutorialrank.comjonhson138
 
Online Training Information Security Management
Online Training Information Security ManagementOnline Training Information Security Management
Online Training Information Security Managementeasy2comply
 
Hide Assignment InformationTurnitin®This assignment will be subm.docx
Hide Assignment InformationTurnitin®This assignment will be subm.docxHide Assignment InformationTurnitin®This assignment will be subm.docx
Hide Assignment InformationTurnitin®This assignment will be subm.docxsimonithomas47935
 
Btpsec Sample Penetration Test Report
Btpsec Sample Penetration Test ReportBtpsec Sample Penetration Test Report
Btpsec Sample Penetration Test Reportbtpsec
 
1 Residency Research Project Acme Enterprise Scen.docx
1  Residency Research Project Acme Enterprise Scen.docx1  Residency Research Project Acme Enterprise Scen.docx
1 Residency Research Project Acme Enterprise Scen.docxoswald1horne84988
 
ISE 620 Final Project Guidelines and Rubric Overview .docx
ISE 620 Final Project Guidelines and Rubric  Overview .docxISE 620 Final Project Guidelines and Rubric  Overview .docx
ISE 620 Final Project Guidelines and Rubric Overview .docxchristiandean12115
 
METAL PRODUCTS DESIGN AND FABRICATION OF SMART SHELF SYSTEM
METAL PRODUCTS DESIGN AND FABRICATION OF SMART SHELF SYSTEMMETAL PRODUCTS DESIGN AND FABRICATION OF SMART SHELF SYSTEM
METAL PRODUCTS DESIGN AND FABRICATION OF SMART SHELF SYSTEMIRJET Journal
 
Many companies and agencies conduct IT audits to test and assess the.docx
Many companies and agencies conduct IT audits to test and assess the.docxMany companies and agencies conduct IT audits to test and assess the.docx
Many companies and agencies conduct IT audits to test and assess the.docxtienboileau
 
ECON 339, January 2017 Assignment 2 Economics 339 (A01),.docx
ECON 339, January 2017 Assignment 2 Economics 339 (A01),.docxECON 339, January 2017 Assignment 2 Economics 339 (A01),.docx
ECON 339, January 2017 Assignment 2 Economics 339 (A01),.docxSALU18
 
Cst 630 Extraordinary Success/newtonhelp.com
Cst 630 Extraordinary Success/newtonhelp.comCst 630 Extraordinary Success/newtonhelp.com
Cst 630 Extraordinary Success/newtonhelp.comamaranthbeg113
 
Cst 630 Motivated Minds/newtonhelp.com
Cst 630 Motivated Minds/newtonhelp.comCst 630 Motivated Minds/newtonhelp.com
Cst 630 Motivated Minds/newtonhelp.comamaranthbeg53
 
Cst 630 Education is Power/newtonhelp.com
Cst 630 Education is Power/newtonhelp.comCst 630 Education is Power/newtonhelp.com
Cst 630 Education is Power/newtonhelp.comamaranthbeg73
 
CIS 321 Case Study ‘Equipment Check-Out System’MILESTONE 3 – PRO.docx
CIS 321 Case Study ‘Equipment Check-Out System’MILESTONE 3 – PRO.docxCIS 321 Case Study ‘Equipment Check-Out System’MILESTONE 3 – PRO.docx
CIS 321 Case Study ‘Equipment Check-Out System’MILESTONE 3 – PRO.docxclarebernice
 
ISE 510 Final Project Guidelines and Rubric Overview The fi.docx
 ISE 510 Final Project Guidelines and Rubric Overview The fi.docx ISE 510 Final Project Guidelines and Rubric Overview The fi.docx
ISE 510 Final Project Guidelines and Rubric Overview The fi.docxaryan532920
 
Technologies in Support of Big Data Ethics
Technologies in Support of Big Data EthicsTechnologies in Support of Big Data Ethics
Technologies in Support of Big Data EthicsMark Underwood
 

Similar to Systems Analysis Problem Imagine that you, as Systems Analyst, h.docx (20)

Inf 220 Future Our Mission/newtonhelp.com
Inf 220 Future Our Mission/newtonhelp.comInf 220 Future Our Mission/newtonhelp.com
Inf 220 Future Our Mission/newtonhelp.com
 
INF 220 Learn/newtonhelp.com
INF 220 Learn/newtonhelp.comINF 220 Learn/newtonhelp.com
INF 220 Learn/newtonhelp.com
 
INF 220 Possible Is Everything/newtonhelp.com
INF 220 Possible Is Everything/newtonhelp.comINF 220 Possible Is Everything/newtonhelp.com
INF 220 Possible Is Everything/newtonhelp.com
 
INF 220 Inspiring Innovation/tutorialrank.com
 INF 220 Inspiring Innovation/tutorialrank.com INF 220 Inspiring Innovation/tutorialrank.com
INF 220 Inspiring Innovation/tutorialrank.com
 
Online Training Information Security Management
Online Training Information Security ManagementOnline Training Information Security Management
Online Training Information Security Management
 
Hide Assignment InformationTurnitin®This assignment will be subm.docx
Hide Assignment InformationTurnitin®This assignment will be subm.docxHide Assignment InformationTurnitin®This assignment will be subm.docx
Hide Assignment InformationTurnitin®This assignment will be subm.docx
 
Btpsec Sample Penetration Test Report
Btpsec Sample Penetration Test ReportBtpsec Sample Penetration Test Report
Btpsec Sample Penetration Test Report
 
Cmgt 400 cmgt400
Cmgt 400 cmgt400Cmgt 400 cmgt400
Cmgt 400 cmgt400
 
1 Residency Research Project Acme Enterprise Scen.docx
1  Residency Research Project Acme Enterprise Scen.docx1  Residency Research Project Acme Enterprise Scen.docx
1 Residency Research Project Acme Enterprise Scen.docx
 
ISE 620 Final Project Guidelines and Rubric Overview .docx
ISE 620 Final Project Guidelines and Rubric  Overview .docxISE 620 Final Project Guidelines and Rubric  Overview .docx
ISE 620 Final Project Guidelines and Rubric Overview .docx
 
METAL PRODUCTS DESIGN AND FABRICATION OF SMART SHELF SYSTEM
METAL PRODUCTS DESIGN AND FABRICATION OF SMART SHELF SYSTEMMETAL PRODUCTS DESIGN AND FABRICATION OF SMART SHELF SYSTEM
METAL PRODUCTS DESIGN AND FABRICATION OF SMART SHELF SYSTEM
 
Many companies and agencies conduct IT audits to test and assess the.docx
Many companies and agencies conduct IT audits to test and assess the.docxMany companies and agencies conduct IT audits to test and assess the.docx
Many companies and agencies conduct IT audits to test and assess the.docx
 
ECON 339, January 2017 Assignment 2 Economics 339 (A01),.docx
ECON 339, January 2017 Assignment 2 Economics 339 (A01),.docxECON 339, January 2017 Assignment 2 Economics 339 (A01),.docx
ECON 339, January 2017 Assignment 2 Economics 339 (A01),.docx
 
Cst 630 Extraordinary Success/newtonhelp.com
Cst 630 Extraordinary Success/newtonhelp.comCst 630 Extraordinary Success/newtonhelp.com
Cst 630 Extraordinary Success/newtonhelp.com
 
Cst 630 Motivated Minds/newtonhelp.com
Cst 630 Motivated Minds/newtonhelp.comCst 630 Motivated Minds/newtonhelp.com
Cst 630 Motivated Minds/newtonhelp.com
 
Cst 630 Education is Power/newtonhelp.com
Cst 630 Education is Power/newtonhelp.comCst 630 Education is Power/newtonhelp.com
Cst 630 Education is Power/newtonhelp.com
 
CIS 321 Case Study ‘Equipment Check-Out System’MILESTONE 3 – PRO.docx
CIS 321 Case Study ‘Equipment Check-Out System’MILESTONE 3 – PRO.docxCIS 321 Case Study ‘Equipment Check-Out System’MILESTONE 3 – PRO.docx
CIS 321 Case Study ‘Equipment Check-Out System’MILESTONE 3 – PRO.docx
 
Data flow diagram
Data flow diagramData flow diagram
Data flow diagram
 
ISE 510 Final Project Guidelines and Rubric Overview The fi.docx
 ISE 510 Final Project Guidelines and Rubric Overview The fi.docx ISE 510 Final Project Guidelines and Rubric Overview The fi.docx
ISE 510 Final Project Guidelines and Rubric Overview The fi.docx
 
Technologies in Support of Big Data Ethics
Technologies in Support of Big Data EthicsTechnologies in Support of Big Data Ethics
Technologies in Support of Big Data Ethics
 

More from ssuserf9c51d

Muslims in the Golden Age is the theme for the research project. You.docx
Muslims in the Golden Age is the theme for the research project. You.docxMuslims in the Golden Age is the theme for the research project. You.docx
Muslims in the Golden Age is the theme for the research project. You.docxssuserf9c51d
 
Multiple Sources of MediaExamine the impact of multiple sour.docx
Multiple Sources of MediaExamine the impact of multiple sour.docxMultiple Sources of MediaExamine the impact of multiple sour.docx
Multiple Sources of MediaExamine the impact of multiple sour.docxssuserf9c51d
 
Multicultural Event WrittenPlease choose and research a cult.docx
Multicultural Event WrittenPlease choose and research a cult.docxMulticultural Event WrittenPlease choose and research a cult.docx
Multicultural Event WrittenPlease choose and research a cult.docxssuserf9c51d
 
Multi-Party NegotiationFor this Essay, you will explore the co.docx
Multi-Party NegotiationFor this Essay, you will explore the co.docxMulti-Party NegotiationFor this Essay, you will explore the co.docx
Multi-Party NegotiationFor this Essay, you will explore the co.docxssuserf9c51d
 
Music has long been used by movements seeking social change.  In the.docx
Music has long been used by movements seeking social change.  In the.docxMusic has long been used by movements seeking social change.  In the.docx
Music has long been used by movements seeking social change.  In the.docxssuserf9c51d
 
MSW Advanced Clinical Concentration -Student Learning AgreementW.docx
MSW Advanced Clinical Concentration -Student Learning AgreementW.docxMSW Advanced Clinical Concentration -Student Learning AgreementW.docx
MSW Advanced Clinical Concentration -Student Learning AgreementW.docxssuserf9c51d
 
Multimedia Instructional MaterialsStaying current on technolog.docx
Multimedia Instructional MaterialsStaying current on technolog.docxMultimedia Instructional MaterialsStaying current on technolog.docx
Multimedia Instructional MaterialsStaying current on technolog.docxssuserf9c51d
 
Murray Bowen is one of the most respected family theorists in th.docx
Murray Bowen is one of the most respected family theorists in th.docxMurray Bowen is one of the most respected family theorists in th.docx
Murray Bowen is one of the most respected family theorists in th.docxssuserf9c51d
 
Mrs. Thomas is a 54, year old African American widow, mother and gra.docx
Mrs. Thomas is a 54, year old African American widow, mother and gra.docxMrs. Thomas is a 54, year old African American widow, mother and gra.docx
Mrs. Thomas is a 54, year old African American widow, mother and gra.docxssuserf9c51d
 
Multiple Source Essay, Speculating about CausesProposing a Solution.docx
Multiple Source Essay, Speculating about CausesProposing a Solution.docxMultiple Source Essay, Speculating about CausesProposing a Solution.docx
Multiple Source Essay, Speculating about CausesProposing a Solution.docxssuserf9c51d
 
Multiyear Plans Please respond to the followingDo you.docx
Multiyear Plans Please respond to the followingDo you.docxMultiyear Plans Please respond to the followingDo you.docx
Multiyear Plans Please respond to the followingDo you.docxssuserf9c51d
 
Multinational Financial ManagementDetermine key reasons wh.docx
Multinational Financial ManagementDetermine key reasons wh.docxMultinational Financial ManagementDetermine key reasons wh.docx
Multinational Financial ManagementDetermine key reasons wh.docxssuserf9c51d
 
Murder CasePreambleAn organization system administrator .docx
Murder CasePreambleAn organization system administrator .docxMurder CasePreambleAn organization system administrator .docx
Murder CasePreambleAn organization system administrator .docxssuserf9c51d
 
Multimodal Personal Narrative – Develop a multimodal document to bot.docx
Multimodal Personal Narrative – Develop a multimodal document to bot.docxMultimodal Personal Narrative – Develop a multimodal document to bot.docx
Multimodal Personal Narrative – Develop a multimodal document to bot.docxssuserf9c51d
 
Multigenre ProjectEN101O Fall 2019 Dr. WalterA Multigenre Pr.docx
Multigenre ProjectEN101O Fall 2019 Dr. WalterA Multigenre Pr.docxMultigenre ProjectEN101O Fall 2019 Dr. WalterA Multigenre Pr.docx
Multigenre ProjectEN101O Fall 2019 Dr. WalterA Multigenre Pr.docxssuserf9c51d
 
Multimedia activity Business OrganizationVisit the Choose Your .docx
Multimedia activity Business OrganizationVisit the Choose Your .docxMultimedia activity Business OrganizationVisit the Choose Your .docx
Multimedia activity Business OrganizationVisit the Choose Your .docxssuserf9c51d
 
Multicultural PerspectiveToday’s classrooms are diverse and .docx
Multicultural PerspectiveToday’s classrooms are diverse and .docxMulticultural PerspectiveToday’s classrooms are diverse and .docx
Multicultural PerspectiveToday’s classrooms are diverse and .docxssuserf9c51d
 
Muhammad Ali, how did his refusal to go into the army affect his.docx
Muhammad Ali, how did his refusal to go into the army affect his.docxMuhammad Ali, how did his refusal to go into the army affect his.docx
Muhammad Ali, how did his refusal to go into the army affect his.docxssuserf9c51d
 
MS 113 Some key concepts that you need to know to navigate th.docx
MS 113 Some key concepts that you need to know to navigate th.docxMS 113 Some key concepts that you need to know to navigate th.docx
MS 113 Some key concepts that you need to know to navigate th.docxssuserf9c51d
 
Much has been made of the new Web 2.0 phenomenon, including social n.docx
Much has been made of the new Web 2.0 phenomenon, including social n.docxMuch has been made of the new Web 2.0 phenomenon, including social n.docx
Much has been made of the new Web 2.0 phenomenon, including social n.docxssuserf9c51d
 

More from ssuserf9c51d (20)

Muslims in the Golden Age is the theme for the research project. You.docx
Muslims in the Golden Age is the theme for the research project. You.docxMuslims in the Golden Age is the theme for the research project. You.docx
Muslims in the Golden Age is the theme for the research project. You.docx
 
Multiple Sources of MediaExamine the impact of multiple sour.docx
Multiple Sources of MediaExamine the impact of multiple sour.docxMultiple Sources of MediaExamine the impact of multiple sour.docx
Multiple Sources of MediaExamine the impact of multiple sour.docx
 
Multicultural Event WrittenPlease choose and research a cult.docx
Multicultural Event WrittenPlease choose and research a cult.docxMulticultural Event WrittenPlease choose and research a cult.docx
Multicultural Event WrittenPlease choose and research a cult.docx
 
Multi-Party NegotiationFor this Essay, you will explore the co.docx
Multi-Party NegotiationFor this Essay, you will explore the co.docxMulti-Party NegotiationFor this Essay, you will explore the co.docx
Multi-Party NegotiationFor this Essay, you will explore the co.docx
 
Music has long been used by movements seeking social change.  In the.docx
Music has long been used by movements seeking social change.  In the.docxMusic has long been used by movements seeking social change.  In the.docx
Music has long been used by movements seeking social change.  In the.docx
 
MSW Advanced Clinical Concentration -Student Learning AgreementW.docx
MSW Advanced Clinical Concentration -Student Learning AgreementW.docxMSW Advanced Clinical Concentration -Student Learning AgreementW.docx
MSW Advanced Clinical Concentration -Student Learning AgreementW.docx
 
Multimedia Instructional MaterialsStaying current on technolog.docx
Multimedia Instructional MaterialsStaying current on technolog.docxMultimedia Instructional MaterialsStaying current on technolog.docx
Multimedia Instructional MaterialsStaying current on technolog.docx
 
Murray Bowen is one of the most respected family theorists in th.docx
Murray Bowen is one of the most respected family theorists in th.docxMurray Bowen is one of the most respected family theorists in th.docx
Murray Bowen is one of the most respected family theorists in th.docx
 
Mrs. Thomas is a 54, year old African American widow, mother and gra.docx
Mrs. Thomas is a 54, year old African American widow, mother and gra.docxMrs. Thomas is a 54, year old African American widow, mother and gra.docx
Mrs. Thomas is a 54, year old African American widow, mother and gra.docx
 
Multiple Source Essay, Speculating about CausesProposing a Solution.docx
Multiple Source Essay, Speculating about CausesProposing a Solution.docxMultiple Source Essay, Speculating about CausesProposing a Solution.docx
Multiple Source Essay, Speculating about CausesProposing a Solution.docx
 
Multiyear Plans Please respond to the followingDo you.docx
Multiyear Plans Please respond to the followingDo you.docxMultiyear Plans Please respond to the followingDo you.docx
Multiyear Plans Please respond to the followingDo you.docx
 
Multinational Financial ManagementDetermine key reasons wh.docx
Multinational Financial ManagementDetermine key reasons wh.docxMultinational Financial ManagementDetermine key reasons wh.docx
Multinational Financial ManagementDetermine key reasons wh.docx
 
Murder CasePreambleAn organization system administrator .docx
Murder CasePreambleAn organization system administrator .docxMurder CasePreambleAn organization system administrator .docx
Murder CasePreambleAn organization system administrator .docx
 
Multimodal Personal Narrative – Develop a multimodal document to bot.docx
Multimodal Personal Narrative – Develop a multimodal document to bot.docxMultimodal Personal Narrative – Develop a multimodal document to bot.docx
Multimodal Personal Narrative – Develop a multimodal document to bot.docx
 
Multigenre ProjectEN101O Fall 2019 Dr. WalterA Multigenre Pr.docx
Multigenre ProjectEN101O Fall 2019 Dr. WalterA Multigenre Pr.docxMultigenre ProjectEN101O Fall 2019 Dr. WalterA Multigenre Pr.docx
Multigenre ProjectEN101O Fall 2019 Dr. WalterA Multigenre Pr.docx
 
Multimedia activity Business OrganizationVisit the Choose Your .docx
Multimedia activity Business OrganizationVisit the Choose Your .docxMultimedia activity Business OrganizationVisit the Choose Your .docx
Multimedia activity Business OrganizationVisit the Choose Your .docx
 
Multicultural PerspectiveToday’s classrooms are diverse and .docx
Multicultural PerspectiveToday’s classrooms are diverse and .docxMulticultural PerspectiveToday’s classrooms are diverse and .docx
Multicultural PerspectiveToday’s classrooms are diverse and .docx
 
Muhammad Ali, how did his refusal to go into the army affect his.docx
Muhammad Ali, how did his refusal to go into the army affect his.docxMuhammad Ali, how did his refusal to go into the army affect his.docx
Muhammad Ali, how did his refusal to go into the army affect his.docx
 
MS 113 Some key concepts that you need to know to navigate th.docx
MS 113 Some key concepts that you need to know to navigate th.docxMS 113 Some key concepts that you need to know to navigate th.docx
MS 113 Some key concepts that you need to know to navigate th.docx
 
Much has been made of the new Web 2.0 phenomenon, including social n.docx
Much has been made of the new Web 2.0 phenomenon, including social n.docxMuch has been made of the new Web 2.0 phenomenon, including social n.docx
Much has been made of the new Web 2.0 phenomenon, including social n.docx
 

Recently uploaded

Andreas Schleicher presents at the launch of What does child empowerment mean...
Andreas Schleicher presents at the launch of What does child empowerment mean...Andreas Schleicher presents at the launch of What does child empowerment mean...
Andreas Schleicher presents at the launch of What does child empowerment mean...EduSkills OECD
 
BỘ LUYỆN NGHE TIẾNG ANH 8 GLOBAL SUCCESS CẢ NĂM (GỒM 12 UNITS, MỖI UNIT GỒM 3...
BỘ LUYỆN NGHE TIẾNG ANH 8 GLOBAL SUCCESS CẢ NĂM (GỒM 12 UNITS, MỖI UNIT GỒM 3...BỘ LUYỆN NGHE TIẾNG ANH 8 GLOBAL SUCCESS CẢ NĂM (GỒM 12 UNITS, MỖI UNIT GỒM 3...
BỘ LUYỆN NGHE TIẾNG ANH 8 GLOBAL SUCCESS CẢ NĂM (GỒM 12 UNITS, MỖI UNIT GỒM 3...Nguyen Thanh Tu Collection
 
Graduate Outcomes Presentation Slides - English (v3).pptx
Graduate Outcomes Presentation Slides - English (v3).pptxGraduate Outcomes Presentation Slides - English (v3).pptx
Graduate Outcomes Presentation Slides - English (v3).pptxneillewis46
 
會考英聽會考英聽會考英聽會考英聽會考英聽會考英聽會考英聽會考英聽會考英聽會考英聽
會考英聽會考英聽會考英聽會考英聽會考英聽會考英聽會考英聽會考英聽會考英聽會考英聽會考英聽會考英聽會考英聽會考英聽會考英聽會考英聽會考英聽會考英聽會考英聽會考英聽
會考英聽會考英聽會考英聽會考英聽會考英聽會考英聽會考英聽會考英聽會考英聽會考英聽中 央社
 
Đề tieng anh thpt 2024 danh cho cac ban hoc sinh
Đề tieng anh thpt 2024 danh cho cac ban hoc sinhĐề tieng anh thpt 2024 danh cho cac ban hoc sinh
Đề tieng anh thpt 2024 danh cho cac ban hoc sinhleson0603
 
TỔNG HỢP HƠN 100 ĐỀ THI THỬ TỐT NGHIỆP THPT TOÁN 2024 - TỪ CÁC TRƯỜNG, TRƯỜNG...
TỔNG HỢP HƠN 100 ĐỀ THI THỬ TỐT NGHIỆP THPT TOÁN 2024 - TỪ CÁC TRƯỜNG, TRƯỜNG...TỔNG HỢP HƠN 100 ĐỀ THI THỬ TỐT NGHIỆP THPT TOÁN 2024 - TỪ CÁC TRƯỜNG, TRƯỜNG...
TỔNG HỢP HƠN 100 ĐỀ THI THỬ TỐT NGHIỆP THPT TOÁN 2024 - TỪ CÁC TRƯỜNG, TRƯỜNG...Nguyen Thanh Tu Collection
 
會考英文會考英文會考英文會考英文會考英文會考英文會考英文會考英文會考英文會考英文會考英文
會考英文會考英文會考英文會考英文會考英文會考英文會考英文會考英文會考英文會考英文會考英文會考英文會考英文會考英文會考英文會考英文會考英文會考英文會考英文會考英文會考英文會考英文
會考英文會考英文會考英文會考英文會考英文會考英文會考英文會考英文會考英文會考英文會考英文中 央社
 
When Quality Assurance Meets Innovation in Higher Education - Report launch w...
When Quality Assurance Meets Innovation in Higher Education - Report launch w...When Quality Assurance Meets Innovation in Higher Education - Report launch w...
When Quality Assurance Meets Innovation in Higher Education - Report launch w...Gary Wood
 
SPLICE Working Group: Reusable Code Examples
SPLICE Working Group:Reusable Code ExamplesSPLICE Working Group:Reusable Code Examples
SPLICE Working Group: Reusable Code ExamplesPeter Brusilovsky
 
UChicago CMSC 23320 - The Best Commit Messages of 2024
UChicago CMSC 23320 - The Best Commit Messages of 2024UChicago CMSC 23320 - The Best Commit Messages of 2024
UChicago CMSC 23320 - The Best Commit Messages of 2024Borja Sotomayor
 
demyelinated disorder: multiple sclerosis.pptx
demyelinated disorder: multiple sclerosis.pptxdemyelinated disorder: multiple sclerosis.pptx
demyelinated disorder: multiple sclerosis.pptxMohamed Rizk Khodair
 
Spring gala 2024 photo slideshow - Celebrating School-Community Partnerships
Spring gala 2024 photo slideshow - Celebrating School-Community PartnershipsSpring gala 2024 photo slideshow - Celebrating School-Community Partnerships
Spring gala 2024 photo slideshow - Celebrating School-Community Partnershipsexpandedwebsite
 
How to Manage Website in Odoo 17 Studio App.pptx
How to Manage Website in Odoo 17 Studio App.pptxHow to Manage Website in Odoo 17 Studio App.pptx
How to Manage Website in Odoo 17 Studio App.pptxCeline George
 
e-Sealing at EADTU by Kamakshi Rajagopal
e-Sealing at EADTU by Kamakshi Rajagopale-Sealing at EADTU by Kamakshi Rajagopal
e-Sealing at EADTU by Kamakshi RajagopalEADTU
 
Sternal Fractures & Dislocations - EMGuidewire Radiology Reading Room
Sternal Fractures & Dislocations - EMGuidewire Radiology Reading RoomSternal Fractures & Dislocations - EMGuidewire Radiology Reading Room
Sternal Fractures & Dislocations - EMGuidewire Radiology Reading RoomSean M. Fox
 
Stl Algorithms in C++ jjjjjjjjjjjjjjjjjj
Stl Algorithms in C++ jjjjjjjjjjjjjjjjjjStl Algorithms in C++ jjjjjjjjjjjjjjjjjj
Stl Algorithms in C++ jjjjjjjjjjjjjjjjjjMohammed Sikander
 
male presentation...pdf.................
male presentation...pdf.................male presentation...pdf.................
male presentation...pdf.................MirzaAbrarBaig5
 

Recently uploaded (20)

Andreas Schleicher presents at the launch of What does child empowerment mean...
Andreas Schleicher presents at the launch of What does child empowerment mean...Andreas Schleicher presents at the launch of What does child empowerment mean...
Andreas Schleicher presents at the launch of What does child empowerment mean...
 
BỘ LUYỆN NGHE TIẾNG ANH 8 GLOBAL SUCCESS CẢ NĂM (GỒM 12 UNITS, MỖI UNIT GỒM 3...
BỘ LUYỆN NGHE TIẾNG ANH 8 GLOBAL SUCCESS CẢ NĂM (GỒM 12 UNITS, MỖI UNIT GỒM 3...BỘ LUYỆN NGHE TIẾNG ANH 8 GLOBAL SUCCESS CẢ NĂM (GỒM 12 UNITS, MỖI UNIT GỒM 3...
BỘ LUYỆN NGHE TIẾNG ANH 8 GLOBAL SUCCESS CẢ NĂM (GỒM 12 UNITS, MỖI UNIT GỒM 3...
 
Graduate Outcomes Presentation Slides - English (v3).pptx
Graduate Outcomes Presentation Slides - English (v3).pptxGraduate Outcomes Presentation Slides - English (v3).pptx
Graduate Outcomes Presentation Slides - English (v3).pptx
 
會考英聽會考英聽會考英聽會考英聽會考英聽會考英聽會考英聽會考英聽會考英聽會考英聽
會考英聽會考英聽會考英聽會考英聽會考英聽會考英聽會考英聽會考英聽會考英聽會考英聽會考英聽會考英聽會考英聽會考英聽會考英聽會考英聽會考英聽會考英聽會考英聽會考英聽
會考英聽會考英聽會考英聽會考英聽會考英聽會考英聽會考英聽會考英聽會考英聽會考英聽
 
Đề tieng anh thpt 2024 danh cho cac ban hoc sinh
Đề tieng anh thpt 2024 danh cho cac ban hoc sinhĐề tieng anh thpt 2024 danh cho cac ban hoc sinh
Đề tieng anh thpt 2024 danh cho cac ban hoc sinh
 
TỔNG HỢP HƠN 100 ĐỀ THI THỬ TỐT NGHIỆP THPT TOÁN 2024 - TỪ CÁC TRƯỜNG, TRƯỜNG...
TỔNG HỢP HƠN 100 ĐỀ THI THỬ TỐT NGHIỆP THPT TOÁN 2024 - TỪ CÁC TRƯỜNG, TRƯỜNG...TỔNG HỢP HƠN 100 ĐỀ THI THỬ TỐT NGHIỆP THPT TOÁN 2024 - TỪ CÁC TRƯỜNG, TRƯỜNG...
TỔNG HỢP HƠN 100 ĐỀ THI THỬ TỐT NGHIỆP THPT TOÁN 2024 - TỪ CÁC TRƯỜNG, TRƯỜNG...
 
會考英文會考英文會考英文會考英文會考英文會考英文會考英文會考英文會考英文會考英文會考英文
會考英文會考英文會考英文會考英文會考英文會考英文會考英文會考英文會考英文會考英文會考英文會考英文會考英文會考英文會考英文會考英文會考英文會考英文會考英文會考英文會考英文會考英文
會考英文會考英文會考英文會考英文會考英文會考英文會考英文會考英文會考英文會考英文會考英文
 
When Quality Assurance Meets Innovation in Higher Education - Report launch w...
When Quality Assurance Meets Innovation in Higher Education - Report launch w...When Quality Assurance Meets Innovation in Higher Education - Report launch w...
When Quality Assurance Meets Innovation in Higher Education - Report launch w...
 
SPLICE Working Group: Reusable Code Examples
SPLICE Working Group:Reusable Code ExamplesSPLICE Working Group:Reusable Code Examples
SPLICE Working Group: Reusable Code Examples
 
Mattingly "AI & Prompt Design: Named Entity Recognition"
Mattingly "AI & Prompt Design: Named Entity Recognition"Mattingly "AI & Prompt Design: Named Entity Recognition"
Mattingly "AI & Prompt Design: Named Entity Recognition"
 
UChicago CMSC 23320 - The Best Commit Messages of 2024
UChicago CMSC 23320 - The Best Commit Messages of 2024UChicago CMSC 23320 - The Best Commit Messages of 2024
UChicago CMSC 23320 - The Best Commit Messages of 2024
 
demyelinated disorder: multiple sclerosis.pptx
demyelinated disorder: multiple sclerosis.pptxdemyelinated disorder: multiple sclerosis.pptx
demyelinated disorder: multiple sclerosis.pptx
 
Spring gala 2024 photo slideshow - Celebrating School-Community Partnerships
Spring gala 2024 photo slideshow - Celebrating School-Community PartnershipsSpring gala 2024 photo slideshow - Celebrating School-Community Partnerships
Spring gala 2024 photo slideshow - Celebrating School-Community Partnerships
 
How to Manage Website in Odoo 17 Studio App.pptx
How to Manage Website in Odoo 17 Studio App.pptxHow to Manage Website in Odoo 17 Studio App.pptx
How to Manage Website in Odoo 17 Studio App.pptx
 
e-Sealing at EADTU by Kamakshi Rajagopal
e-Sealing at EADTU by Kamakshi Rajagopale-Sealing at EADTU by Kamakshi Rajagopal
e-Sealing at EADTU by Kamakshi Rajagopal
 
VAMOS CUIDAR DO NOSSO PLANETA! .
VAMOS CUIDAR DO NOSSO PLANETA!                    .VAMOS CUIDAR DO NOSSO PLANETA!                    .
VAMOS CUIDAR DO NOSSO PLANETA! .
 
Sternal Fractures & Dislocations - EMGuidewire Radiology Reading Room
Sternal Fractures & Dislocations - EMGuidewire Radiology Reading RoomSternal Fractures & Dislocations - EMGuidewire Radiology Reading Room
Sternal Fractures & Dislocations - EMGuidewire Radiology Reading Room
 
Stl Algorithms in C++ jjjjjjjjjjjjjjjjjj
Stl Algorithms in C++ jjjjjjjjjjjjjjjjjjStl Algorithms in C++ jjjjjjjjjjjjjjjjjj
Stl Algorithms in C++ jjjjjjjjjjjjjjjjjj
 
Mattingly "AI and Prompt Design: LLMs with NER"
Mattingly "AI and Prompt Design: LLMs with NER"Mattingly "AI and Prompt Design: LLMs with NER"
Mattingly "AI and Prompt Design: LLMs with NER"
 
male presentation...pdf.................
male presentation...pdf.................male presentation...pdf.................
male presentation...pdf.................
 

Systems Analysis Problem Imagine that you, as Systems Analyst, h.docx

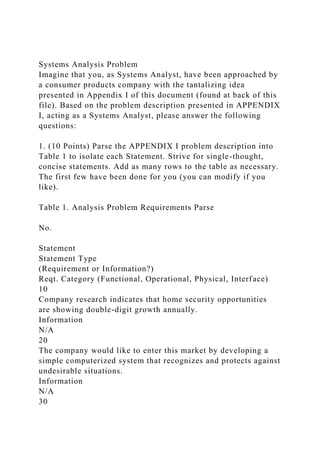
  • 1. Systems Analysis Problem Imagine that you, as Systems Analyst, have been approached by a consumer products company with the tantalizing idea presented in Appendix I of this document (found at back of this file). Based on the problem description presented in APPENDIX I, acting as a Systems Analyst, please answer the following questions: 1. (10 Points) Parse the APPENDIX I problem description into Table 1 to isolate each Statement. Strive for single-thought, concise statements. Add as many rows to the table as necessary. The first few have been done for you (you can modify if you like). Table 1. Analysis Problem Requirements Parse No. Statement Statement Type (Requirement or Information?) Reqt. Category (Functional, Operational, Physical, Interface) 10 Company research indicates that home security opportunities are showing double-digit growth annually. Information N/A 20 The company would like to enter this market by developing a simple computerized system that recognizes and protects against undesirable situations. Information N/A 30
  • 2. Undesirable situations may include, but are not limited to, illegal entry, fire, flooding and others Requirement Functional, Interface. Suggests categories of required Sensors. 40 50 60
  • 3. 2. (5 Points) When you have parsed all Statements into Table 1, next verify “Statement Type” (3rd column). Indicate which Statements are “Requirements”. Going forward, we are primarily only interested in the Requirements, although the other Statements help with overall context. 3. (5 Points) Next specify “Reqt. Category” (4th column) in Table 1. For the Requirements only, define a Category. Likely Categories are: Functional, User Interface, Operational, External Interface, but you may define others. 4. (10 Points) With Steps 1-3 complete, and based on Requirements, please draw a System Context diagram similar the one shown below in Figure 1. The primary goal is to show in a simple diagram what is “outside” the system and which major pieces of functionality are “inside” the system. Create then insert your own diagram. Clearly indicate all External Inputs, External Outputs and Major Internal Functions. Consider all external Actors. Please note that there is no one “right” answer. Figure 1. Sample Context Diagram 5. (10 points) With Steps 1-4 complete, consider all the “nouns / things” identified in the problem statement. Based on Requirements, propose the list of potential Classes/Objects by filling in the following Table 2. The first couple of potential entries are done for you.
  • 4. Note: You may find it helpful to review APPENDIX II – CLASS/OBJECT SELECTION RULES, which provide some time-honored guidance on how to make such a selection. Note that this should end up being your list of internal Classes based on your interpretation of the Problem Statement. Not all Potential Class/Object items should remain as a Class. Also provide Your Rationale. Please note that there is no one “right” answer. Table 2. List of Potential Classes / Objects Potential Class/Object General Classification Your Rationale Homeowner External Role, external entity Sensor External Entity 6. (10 points) Pick two (2) of your Classes from the above Table 2. Propose the list of Attributes associated with the selected Class and populate Table 3. Provide rationale for your proposed Attributes.
  • 5. Table 3. Selected Classes and Attributes Class No. Class Name Class Attributes Your Rationale 1 2 7. (5 points) Imagine that “Control Panel” is a Class. Using the concept of Superclass / Subclass and Inheritance, draw a picture that shows the relationship between the Control Panel and its associated Keypad, LCD Screen and Lights. 8. (10 points) Imagine that you have determined that the following Class Diagram, shown in Figure 2, has resulted from your analysis work on this project. Using the provided diagram, and using UML Cardinality rules, add in the relationships between the classes. (Note: These classes may be different than those being defined by your analysis. That is OK. To answer this question, please use this diagram). Figure 2. Class Diagram >> End of Questions. Appendix I and Appendix II follow << APPENDIX I – SYSTEMS ANALYSIS PROBLEM DESCRIPTION
  • 6. Introduction Company research indicates that home security opportunities are showing double-digit growth annually. The company would like to enter this market by developing a simple computerized system that recognizes and protects against undesirable situations. Undesirable situation may include, but are not limited to, illegal entry, fire, flooding and others. The code name for this product is “SecureAndSafe”. The SecureAndSafe system will use appropriate sensors to detect every situation. It can be programmed by an installer, homeowner or maintainer, and will automatically contact a monitoring agency when a situation is detected. If the homeowner has a Wi-Fi router and email system, the monitoring agency will be contacted by both email and phone. If no e-mail exists, the monitoring agency will be contacted by phone only. The homeowner will define the relevant e-mail address and phone numbers. The SecureAndSafe system is comprised of a wall control unit and software. A suggested example of the wall unit is shown below: The software enables the installer or homeowner to configure the security system. Once installed and operational, it monitors all sensors connected to the security system. It interacts with the homeowner through a key pad (numbers 1-9 plus star (*) and pound (#) keys. The system has “armed” and “power” light indicators. System Installation and Configuration During installation, the control panel is used to “program” and configure the system. Each sensor is assigned a number and type, a master password is programmed for arming and disarming the system, and e-mail addresses (if appropriate) and telephone numbers are input for dialing when a sensor event occurs.
  • 7. System Monitoring and Sensor Event Response Upon detection of a sensor event, it rings an audible alarm attached to the system. After a programmable delay time, software contacts the monitoring agency and provides location information and nature of the detected event. An e-mail is sent once, but the phone number is re-dialed every 30 seconds until a phone connection is made. User Interaction All keypad interaction is managed by a user-interaction subsystem that reads keypad input and function keys. The subsystem also displays prompting messages and system status messages on an integrated LCD Display. APPENDIX II – CLASS/OBJECT SELECTION RULES Peter Coad and Ed Yourdon, in their textbook titled Object- Oriented Analysis (Prentice-Hall, 1990), suggested six (6) rules that should be used to determine if a potential class/object should be included in an analysis model. According to Coad and Yourdon, “to be considered a legitimate object for inclusion in the requirements model, a potential object should satisfy all (or almost all) of the characteristics”. These rules are: No. Rule Description 1 Retained Information The potential object will be useful during analysis only if information about it must be remembered so that the system can function. 2 Needed Services
  • 8. The potential object must have a set if identifiable operations that can change the value of its attributes in some way. 3 Multiple Attributes During requirements analysis, the focus should be on “major” information; an object with a single attribute may, in fact, be useful during design, but is probably better represented as an attribute of another object during the analysis activity. 4 Common Attributes A set of attributes can be defined for the potential object and these attributes apply to all occurrences of the object. 5 Common Operations A set of operations can be defined for the potential object and these operations apply to all occurrences of the object. 6 Essential Requirements External entities that appear in the problem space and produce or consume information that is essential to the operation of any solution for the system will almost always be defined as objects in the requirements model. SecureAndSafeSystem BoundaryExternal InputsExternal OutputsMajor Internal Functions1.Function 12.Function 2:Function “n” SystemControl PanelAudible AlarmSensorSensor Event SecureAndSafe Associate
  • 9. career opportunities Walmart de Mexico promoted more than 22,700 associates in fiscal 2014. Putting low prices within reach We serve customers around the globe more than 250 million times each week. Affordable, healthier food In FY 2014, we opened 96 new stores in America’s food deserts, with 224 opened since our initiative began. Meeting community needs around the world Last year, Walmart and the Walmart Foundation gave more than $1 billion in cash and in-kind gifts to charitable organizations. Toward a more sustainable tomorrow Today, 24% of our electricity comes from renewable sources. Wal-Mart Stores, Inc. (NYSE: WMT) 702 S.W. 8th Street | Bentonville, Arkansas 72716 USA |
  • 10. 479-273-4000 | walmart.com So many ways to Save money. Live better. 2014 Annual Report 2014 A n n u al Rep o rt 147046_L01_CVR.indd 1 4/10/14 10:52 AM Walmart 2014 Annual Report 24 Walmart 2014 Annual Report So many opportunities for associates to serve customers 190,000 U.S. store/club associates promoted in fi scal 2014 2.2M dedicated associates
  • 11. globally 300K* associates have 10+ years of service Based on survey results from more than 2 million associates worldwide, approximately 4 of 5 are proud to work for Walmart. *Represents Walmart U.S. data only. The minimized environmental footprint of this report is the result of an extensive, collaborative effort of Walmart and our supply chain partners. The environmental and social impact continues to be an important consideration. It is printed on paper from well- managed forests containing recycled PCW fiber that is Elementally Chlorine Free (ECF). It is printed using 100 percent renewable wind power (RECs), along with environmental manufacturing principles that were utilized in the printing process. These practices include environ- mentally responsible procurement, lean manufacturing, green chemistry principles, the recycling of residual materials and reduced
  • 12. volatile organic compound inks and coatings. Our sustainable, next-generation report. 5.11 acre of forestland preserved via managed forestry 983 fewer trees consumed via recycling 129,537 kWh less energy – the same used by 5 homes for a year 472 metric tons of greenhouse gas offset – the equivalent of taking 94 cars off the road for a year 46,835 kWh converted to clean renewable sources (printing plant using RECs) 459,333 fewer gallons of water consumed Savings baselines were developed using the national averages of
  • 13. similar coated papers and printing practices by EarthColor Printing. FSC® is not responsible for any calculations on saving resources by choosing this paper. Walmart’s Global Responsibility Report highlights helping communities live better. Learn more about our workplace, social, environmental, sourcing and compliance initiatives by reading our Global Responsibility Report at corporate.walmart.com/ microsites/global-responsibility-report-2014 Walmart’s investor relations app is our company at your fi ngertips. Walmart’s IR app gives shareholders anytime and anywhere access to financial and company news from their mobile devices. Find presentations, quarterly results, virtual store tours, a global footprint map and the stock price on your iPad, iPhone or Android device. Download the free app from iTunes or Google Play. Walmart’s enhanced digital annual report has expanded content. We’re driving innovation and sustainability – and reducing costs – with our enhanced digital annual report. Visit www.stock.walmart.com to hear directly from our leaders, associates and customers. Also, visit this website to enroll to receive future materials electronically for our Annual Shareholders’ Meetings. P
  • 14. RI NT ED USIN G 1 0 0% W IND EN ER G Y Supplied by Community Energy 147046_L01_CVR.indd 2147046_L01_CVR.indd 2 4/9/14 8:48 PM4/9/14 8:48 PM Walmart 2014 Annual Report 1 100K honorably discharged U.S.
  • 15. veterans expected to be hired by Walmart U.S. and Sam’s Club by 2018 57% of our International associates are women *Represents Walmart U.S. data only. Approximately 75%* of store management joined Walmart as hourly associates Delivering for customers and shareholders Our Global eCommerce footprint spans 10 countries, creating digital access and physical distribution points for our customers worldwide.
  • 16. $68B* returned to shareholders through dividends and share repurchases 12%* total shareholder returns (CAGR) 30%* earnings per share growth 33M approximate retail square footage added in fiscal 2014 $68B* net sales growth over the past five years 250M customers served weekly in our stores in 27 countries *Data reflects five-year period including fiscal 2010 through 2014. To our shareholders, associates and
  • 17. customers: I’m deeply honored to lead Walmart at such an exciting time. Walmart has a rich history and is well-positioned for the future. We have an authentic and important purpose. We’re grounded with strong values and have millions of associates who share a culture and belief in doing what is right for our customers, our communities and each other. The future will bring a lot of change as the rapid growth of digital commerce enables us to serve customers in new and exciting ways. Our customers continue to search for value, a broad assortment and a shopping experience that saves them time and money. With greater convergence of digital and physical retail, we’re invest- ing in capabilities to provide customers even more choice and convenience. When I think about all these capabilities, I’m confident in Walmart’s continued growth and enthusiastic about our future. Positioning to serve our customers. Around the world, we deliver value for customers in different ways. We operate supercenters, Sam’s Clubs, e-commerce sites and many other formats that enable us to serve our customers. As we develop the combination of digital and physical interaction with customers, we’ll remain well positioned to grow. We’re laser-focused on delivering improved comparable store sales by sharpening our merchandising efforts, price leadership and enhancing service. We’re also intent on creating transformative growth by adding capabilities in e-commerce and mobile commerce. When we view our business through the eyes of our customers, we don’t think about our stores, clubs or websites independently. Instead, our goal is to have customers see these channels converge as one unified relationship with us. We want to deliver a relevant, personalized and seamless experience across all channels. So, our approach to investments will continue to evolve to support the singular goal of enhancing the customer experience to further grow sales.
  • 18. Change is nothing new for Walmart – it’s embedded in our DNA. After all, our company founder, Sam Walton, was the premier innovator in retail. He made Walmart better by questioning everything, every day – frequently asking customers and our store associates how we could do better. He was always in the market looking for new ideas. For Sam, the customer was always the boss, and the improvements he made to Walmart were Walmart 2014 Annual Report 3 Doug McMillon President and Chief Executive Officer Wal-Mart Stores, Inc. customer-driven. I intend to lead Walmart with this same customer-centric focus. Today, in addition to listening to our customers, we apply data and technology to this task. The millions of customer interactions that take place each week give us some of the world’s most robust data to analyze and leverage to improve our service. For example, customer insights led the Walmart U.S. team to expand our Black Friday 1-Hour Guarantee program this past year, and innovative systems enabled successful execution and on-time product delivery. The tools today may be different than the ones Sam employed, but the imperative that will guide our transforma- tional initiatives is the same – to connect more effectively with customers. Walmart is well-positioned for the future partially due to our unique assets. We have more than 10,900 physical points of
  • 19. distribution globally. No other retailer possesses such an extensive footprint. And, with our retail websites around the world, we’re doing more to leverage these physical assets to expand the intersection with digital retail. Last year, we grew e-commerce sales in Brazil and China at nearly twice the market rate. Asda’s Click and Collect program has been very successful, and Mexico is expanding grocery delivery beyond our Superama grocery stores to supercenters this year. We’re leveraging best practices to further test grocery delivery and customer pickup in the U.S. We’ve also broadened our e-commerce merchandise assortment. Last year, for example, we more than doubled walmart.com’s merchandise offerings in the U.S. to over 5 million SKUs, and our sites in Brazil and China greatly expanded their assortments as well. We invest in price to bring everyday low prices (EDLP) to more customers around the world. EDLP earns trust with customers because we’re driven to keep our cost structure low. That commitment to price is central to our brand – regardless of the format. We’re also giving customers greater access to the value we offer through different formats. In the U.S., our Neighborhood Markets offer fresh foods, pharmacy and fuel, and delivered healthy comp sales growth in fiscal 2014. This year, we’ll significantly accelerate their rollout to complement our core supercenter fleet. And, in Mexico and the U.K., we’ll open more small stores to deliver convenience, assortment and low prices. Expanding opportunities for associates. One of the most exciting things about serving more customers in new ways is the opportunity to create good jobs, attract new talent and expand current associates’ possibilities to build careers. Last year, we hired 776,000 new associates to jobs across our operations. The path of my own career attests to the
  • 20. exceptional opportunity at Walmart to advance professionally. In fact, we promoted about 190,000 U.S. store and club associates last year to jobs with more responsibility and higher pay. And, we’ll continue to invest in training and development because building the best team in retail is central to our strategy. Driving operational excellence. We remain focused on driving the productivity loop to leverage operating expenses. The most important way to deliver against this objective is to increase sales. By operating and buying for less, we’re able to lower prices that, in turn, prompt customers to make more purchases. We also foster an environment that leverages best practices across the enterprise to drive process improvements. Operational excellence requires capital discipline and efficiency, and our real estate and construction teams have made great progress in lowering the cost of new stores and remodels. Our focus on capital efficiency also is top of mind with our e-commerce capabilities. We’re more disciplined now in allocating capital to the right markets, the right formats and the right digital capabilities. Earning trust in communities. I’m proud of the value we add in the communities we serve and I know we will find new ways to contribute. We are deeply committed to com- pliance and social, environmental and local responsibility. Operating with integrity is a cornerstone for building trust. We have made tremendous progress toward our goal of developing a world-class compliance organization and this will continue to be a top priority going forward. Our training and leadership development programs reinforce the mission of upholding the highest standards of integrity, not just in retail, but in all of business. We’ll also continue to lead on key Walmart 2014 Annual Report 54 Walmart 2014 Annual Report
  • 21. Read Walmart’s 2014 Global Responsibility Report at stock.walmart.com to learn more about our workplace, social, environmental, sourcing and compliance initiatives. issues like women’s economic empowerment, healthier foods and renewable energy. Walmart’s initiatives, in partnership with many suppliers, have significantly increased sustainability throughout the global supply chain, and we will do even more. Solid performance in a challenging environment. In fiscal 2014, consolidated net sales increased $7.5 billion to more than $473 billion and diluted earnings per share from continuing operations were $4.85. While we certainly see areas where we can improve, it’s also a reality that we faced some challenging consumer environments around the world. Both developed and developing markets grew slower than most people would have hoped for. The value we offer enabled us to grow share almost everywhere, and we’re optimistic that conditions will moderately improve this year. Walmart U.S. delivered solid profit growth. Operating income grew 4 percent on a net sales increase of $5 billion. The U.S. team did a great job controlling costs and successfully lever- aged expenses. Walmart International’s net sales increased 1.3 percent to more than $136 billion. We took important steps to hone our international portfolio and focus investments on the most profitable opportunities to position the business for future growth. Sam’s Club continued to expand its footprint, opening 12 new clubs, and enhanced its merchandise offerings
  • 22. with a sharpened focus around value, quality and exciting merchandise. Our members saw the value of membership, and with the fee increase in May, Sam’s Club membership income continued to grow. Each operating segment strengthened its e-commerce platforms, and customers responded, driving annual Global eCommerce sales, including acquisitions, above the $10-billion mark, a 30 percent increase. A strong focus on e-commerce is now fully embedded within each of our businesses and we’ll increase our investment as e-commerce opportunities present themselves. Embracing the challenge to change. After just a few months into my new role, I have an even deeper appreciation for Mike Duke’s extraordinary contributions as CEO over the past 5 years. His work positioned Walmart for long-term success, and I am one of the many associates who benefitted from his guidance and leadership. His passion for our business and drive for continuous improvement greatly benefitted Walmart’s associates, customers and shareholders. I look to the future confident that Walmart has all the ingredients necessary to prosper in the new retail world that is unfolding. Our purpose remains clear – to save people money so they can live better – and the actions we’re taking will expand the opportunities to fulfill that purpose. We’ll analyze and review everything Walmart is today, and we’ll be willing to change whatever is necessary to serve customers better than ever. I first started working for Walmart 30 years ago when I was a teenager. I’ve fallen in love with our company, its people, our purpose and culture. We have a unique culture grounded on four basic beliefs: service to our customers, respect for the
  • 23. individual, striving for excellence and acting with integrity. As CEO, I want to continue to nourish and strengthen these foundational beliefs. And, I’m excited to increase the pace of change to ensure we’re serving the customers the way they want to be served in the future. Sincerely, Doug McMillon President and Chief Executive Officer Wal-Mart Stores, Inc. Walmart 2014 Annual Report 54 Walmart 2014 Annual Report Top left: We’ll purchase an additional $250B of U.S.-made products over the next 10 years. Top right: Produce, backed by our money-back guarantee, has the quality and value customers trust. Middle right: We’re bringing new, innovative grocery products to our broad assortment. Bottom right: Customers appreciate the convenient access to pharmacy, fresh foods, fuel and e-com- merce pickup at our Walmart Express pilot stores. Bottom left: In fiscal 2015, we expect to add about 200 new Neighborhood Markets to our portfolio. Nearly 140 million customers served
  • 24. each week Serving customers and delivering savings every day In fiscal 2014, Walmart U.S. attracted nearly 140 million weekly shoppers to our stores and delivered net sales of more than $279 billion, an increase of $5 billion, or 1.8 percent, from last year. Our focus on cost discipline helped drive 4 percent operating income growth, more than twice the rate of sales, despite a 0.6 percent decline in comp sales. Focused on customer needs. Customers choose Walmart for our broad assortment, including national brands and locally relevant merchandise, at everyday low prices (EDLP). It’s our winning formula and results in continued market share gains in key categories, such as food, consumables, over-the-counter and apparel. With our merchant mindset, we partner with suppliers to increase product innovation and bring exciting new brands to our stores, such as Russell, Avia and Calphalon. We also work hard to improve quality and execution, making great strides in areas such as produce and meat. And, our price investments are driving sales by providing a lower-priced basket relative to the market and building customers’ trust in our EDLP promise. In order to invest in price, we focus on everyday low cost (EDLC). Advancements in
  • 25. logistics and store operations continue to reduce costs and improve productivity. For instance, optimized transportation routes and distribution center mechanization are driving supply chain efficiencies. Greater flexibility at the store front-end, such as self- checkouts, is helping productivity and resonating with our customers. We believe we can drive cost savings by sourcing closer to the point of consumption. We made bold commitments to increase purchases of U.S.-made products by an additional $250 billion over the next 10 years. Our 1.2 million associates are essential to a customer-centric experience. Advancement opportunities abound for Walmart associates who are passionate about serving customers. Last year, we promoted over 170,000 associates and experienced more part-time associates accepting full-time roles, building long-term careers with Walmart. We also added over 30,000 honorably discharged veterans to our team. We’re strengthening career develop- ment pathways by expanding training to foster continued, strong associate engagement. Positioned to win at the convergence of digital and physical. Walmart is redefining the next generation of retail growth and is the best-positioned retailer to win at the convergence of digital and physical retail. In fiscal 2015, we’ll continue to grow our multi-format portfolio. Our core supercenter fleet serves the stock-up trip and accounts for the majority of our market share leadership. We’re accelerating
  • 26. the rollout of Neighborhood Markets to serve the quick-trip needs. And, our expanded pilot of Walmart Express focuses on the rural quick-trip. Neighborhood Markets and Express deliver convenience and customer access to fresh foods, pharmacy and fuel. Overall, we’ll add between 21 and 23 million retail square feet, representing between 385 and 415 units in fiscal 2015. We’ll also connect Walmart’s physical assets to the broad assortment that is available through nearby stores and online, delivering anytime access to our brand. We’re testing grocery delivery in several markets and also piloting an easy pickup option for online grocery and general merchandise. Innovations such as these expand our reach to more customers on their terms. Walmart 2014 Annual Report 7 “ We’re offering customers con- venient digital and physical access to Walmart’s broad merchandise assortment and investing in price leadership to provide even greater value.” Bill Simon President and CEO
  • 27. Walmart U.S. Positioning our portfolio for continued growth In fiscal 2014, Walmart International’s net sales, excluding the impact of currency exchange rate fluctuations and acquisitions, increased 4.6 percent to $140.9 billion. We added 12.5 million square feet and 324 stores, bringing our total portfolio to more than 6,100 stores. We also grew or maintained market share in most countries, despite a challenging macroeconomic environment where household incomes were stretched and competition remained high. Targeting the most promising opportunities. International will continue to be a growth vehicle for Walmart. We’re focused on driving comp sales in all markets and investing in relevant formats and channels, including e- commerce and mobile. During the year, we took steps to strengthen our position in Brazil, Chile, China and Mexico and expect these actions to help us deliver our financial priorities. We’re excited about opportunities for growth in e-commerce. Our investments in infrastructure and talent are accelerating International’s digital expansion and providing options for customers with diverse shopping habits. For example, Asda’s rapidly growing online grocery business exemplifies the physical-digital
  • 28. convergence, creating a customer experience that only Walmart can deliver. Brazil e-commerce sales grew at nearly twice the market rate last year, and Yihaodian is one of China’s fastest-growing e-commerce sites, offering customers both grocery and general merchandise. In addition, we’re increasing our investments in Mexico and Canada to drive growth. Customers around the world still want and need value. We’ll deliver EDLP for them by continuing to invest in price. EDLP builds trust with customers while saving them money, whether it’s “Worry Free” pricing in China or the “Asda Price Guarantee” in the U.K. Our objective is to fund this investment by being the lowest-cost operator in every market. We continue to expand our capabilities to buy, operate and sell for less. In partnership with our global leverage teams, we’re driving innovative technology and process improvements, all with a lens on greater customer relevance. Taking corporate responsibility to a higher level. At the core of International are the outstanding associates, who are dedicated to serving our customers. We continue to recruit some of the best global talent in retail to complement our current teams, and we’re investing in training and development of current associates. For example, in the last year, we ramped up our efforts with the merchant leadership academy to provide advanced training in merchandising strategy and execution.
  • 29. As a global company, we have responsibilities to the countries in which we operate, and we earn trust through our commitment to compliance, social and environmental issues. We remain vigilant in our focus to have the most compliant processes and capabilities, to support charities and to lead on environmental sustainability to improve the communities that we serve. International 8 Walmart 2014 Annual Report “ To drive sales and build long-term value, we’re focused on price leadership and operational excellence while investing in the formats and channels that customers want.” David Cheesewright President and CEO Walmart International Top left: Our EDLP strategy in Canada, supported by Rollbacks, provides one-stop shopping at great values. Top right: Bodega Express provides Mexican customers
  • 30. with convenient access to Walmart. Middle right: We expect to continue our growth in China by opening 110 additional facilities by 2016. Bottom right: Supercenters in Mexico provide a broad assortment with local relevance at everyday low prices. Bottom left: Asda customers enjoy the quality of George apparel. Overall, Asda will invest £1.25 billion in price and quality over the next 5 years. More than 6,100 retail units operated in 26 countries 1.6 million demos in 630 clubs last year Top left: Members appreciate our merchandise transformation focused on price, bulk, quality and excitement. Top right: Sam’s Club helps business members supply their needs in restaurants, convenience stores, and others.
  • 31. Middle top right: Initiatives to promote the health and wellness of members is a key priority. Middle bottom right: Sales of traffic-driving categories, such as fresh produce, saw strong growth in fiscal 2014. Bottom right: The Instant Savings Books add further value to a membership. Bottom left: We’ve expanded self checkouts, increasing convenience for our Savings, Plus and business members. Walmart 2014 Annual Report 11 Rosalind Brewer President and CEO Sam’s Club “ We’re focused on creating even more value for our members, through great merchandise at exceptional values. Our new membership enhancements will make a Sam’s Club membership more rewarding than ever. “
  • 32. Offering unique merchandise at exceptional values In fiscal 2014, Sam’s Club delivered greater value to members, opened new clubs and improved the ability to shop anytime, anywhere through e- commerce and mobile initiatives. Net sales increased 1.3 percent to $57.2 billion and operating income was $2.0 billion. Excluding the 30 basis point fuel impact, comp sales increased 0.7 percent. Membership income was the strongest it’s been in many years, growing 5.9 percent, primarily due to the fee increase implemented in May. More new ways to excite our members. The initial steps of our merchandise transformation are energizing members to buy. We boost member traffic by offering exciting new merchandise, including quality national brands, at exceptional values. We had great success in home and apparel and plan to continue rolling out even more new merchandise across our clubs. Our highly engaged associates drive member excitement by providing great service that enhances the membership experience. A seamless multi-channel offering creates an integrated member experience. Improved e-commerce and mobile platforms strengthen conversions, particularly in mobile trans- actions. We’re fully integrating our samsclub.com team with Walmart Global eCommerce to strengthen digital capabilities and support continued sales growth.
  • 33. We’re also focused on member relevance by leveraging Big Data to better understand our members’ needs. These insights increase efficiency and productivity in our clubs. Data helps us predict whether a mom is planning family meals or an entrepreneur is launching a new business and enables personalized interactions that make their membership experience more rewarding. Sam’s Club opened 20 new, relocated or expanded clubs in fiscal 2014, the largest number of openings in several years. We invested in membership acquisition to build a critical mass in our new club openings, including the use of social media marketing. In fiscal 2015, we plan to open between 17 and 22 new, relocated or expanded units. Making membership more rewarding than ever. We’re using Instant Savings Books (ISB) as an important tool to demonstrate price leadership. We discount top-selling brands, popular items and new products throughout the club and online to provide greater value. Offered several times throughout the year, ISBs also drive member awareness to categories they might not typically shop. This summer, we’ll launch two new membership enhancements. First, we’ll roll out cash rewards nationally, providing an opportunity to reward our best members, grow membership income and drive loyalty. Second, we’ll introduce a new cash-back credit
  • 34. card offering. Both enhancements will provide significant value to our members, making a membership with Sam’s Club more rewarding than ever. 12 Walmart 2014 Annual Report Accelerating growth through e-commerce integration Walmart 2014 Annual Report 12 In China, Yihaodian’s new, more intuitive mobile app has helped expand mobile transactions eightfold in one year. In the U.S., walmart.com customers enjoy an expanded online assortment of more than 5 million SKUs and convenient delivery options to their home or through Site to Store. We’re investing in new fulfillment centers to provide faster delivery in the U.S., U.K. and Brazil. 13 Walmart 2014 Annual Report Walmart 2014 Annual Report 13 Walmart To Go, now in test in the U.S., leverages
  • 35. best practices from our successful Asda grocery delivery business in the U.K. Traffic on Sam’s Club’s mobile platform nearly doubled in the last year. After a threefold increase in site traffic, walmart.com in Brazil consistently ranks as the #1 or #2 most visited retail site. “ Best in class e-commerce, plus the assets of the world’s largest retailer, allow Walmart to do for customers what no one else can.” Neil Ashe, President and CEO, Global eCommerce Walmart’s strength as a retailer has continued through more than five decades of economic change and retail industry transformation. It’s a remarkable record, based on our unique ability to deliver on our purpose for customers, the strength of our culture and the foundation of strong governance by our Board of Directors. All of this together allows Walmart to improve shareholder value. Our Board is more diverse than most public company boards, with broad global business expertise ranging from technology to retail, and finance to compliance. Our directors’ diverse per-
  • 36. spectives and experiences provide the support and foundation for our management team, as they refine our business strategy for changing customer needs. Walmart’s Board views succession planning as a critical responsibility, and it’s a topic upon which the company has spent considerable time and effort. This diligence has served shareholders well, as we’ve added talented new directors over the past few years. And, we were very pleased to name Doug McMillon to our Board and as Walmart’s new CEO following Mike Duke’s retirement. Stability and high governance standards. Doug becomes only the fourth CEO of Walmart since Dad separated the roles of Chairman and CEO in 1988. That, too, is a remarkable record of stability and the high governance standards established by our Board. Doug is a superb choice to lead Walmart. He has grown up in the company – starting as an hourly associate in one of our distribution centers at the age of 17. After complet- ing his MBA program, Doug began what is now a 23-year record of effective leadership that has prepared him to serve as CEO. He keenly understands everything Walmart – people, our core operations, opportunities and challenges at a fundamental level. Doug is deeply grounded in Walmart’s culture, including the importance of “staying out in front of change,” as Dad used to say. I’m confident that Doug’s leadership will provide Walmart a bright and robust future. Mike served exceptionally well as CEO for the past five years, and his contributions to Walmart over his 18-year career are many. In each leadership role, Mike demonstrated integrity in dealing with tough issues, displayed the greatest character and consideration for people, and had a steely determination to do the right thing for our associates, shareholders and the com- munities we serve. Among Mike’s signature contributions as
  • 37. CEO was his commitment to investing in our global e-commerce business, critical for Walmart’s long-term growth. In addition, Mike’s passion for increasing productivity re-engaged the company in leveraging expenses so that we can lower prices for our customers. Mike is a terrific leader, and I’m extremely pleased that we’ll continue to benefit from his insight as a member of our Board. A commitment to board independence. Our family is proud to have a representation in guiding Walmart’s future, but we’re committed to independent board governance. Today, 10 of our 16 incumbent directors are independent. These men and women are dedicated to serving shareholders. In fact, our directors attended 97 percent of Board and committee meet- ings in fiscal 2014. They challenge management on delivering business objectives and employing strategies to win in this shifting global retail landscape. And the Board consistently evaluates steps to strengthen governance. Since my letter to you last year, we increased the stock ownership guidelines for our CEO and certain executive officers to further align their interests with long-term shareholder value. We also amended Walmart’s bylaws to allow shareholders owning at least 10 percent of outstanding shares to request a special shareholders’ meeting. In addition, Dr. James Cash was appointed Presiding Director, bringing tremendous experience from his service on Walmart’s and other boards. And, reflecting our commitment to independence, the Board amended our Corporate Governance Guidelines to clarify and expand the roles and responsibilities of the Presiding Director. Our Board also has overseen significant enhancements to our global compliance program. For more details on this progress, I encourage you to review “Walmart’s Global Compliance Program: Report on Fiscal Year 2014,” on our website at stock.walmart.com. You can also review our proxy statement
  • 38. for further details about our board members, governance structure and executive compensation. In closing, Dad woke up every day trying to make things better, and was never satisfied when they were good or even great. Today, that passion for continuous improvement remains thoroughly embedded in Walmart, and especially in our new CEO. With an enduring commitment to strong corporate governance and effective leaders to chart our course, I’m confident that our remarkable story of progress will continue. S. Robson Walton Chairman of the Board of Directors Wal-Mart Stores, Inc. Strong governance: a commitment that endures Board Committees: Name Audit Comp., Nominating & Governance Executive Global Comp. Strategic Planning & Finance
  • 39. Tech & e-commerce S. Robson Walton Aida M. Alvarez James I. Cash, Jr., Ph.D.(FE) Roger C. Corbett Pamela J. Craig (FE) Douglas N. Daft Michael T. Duke (C) Timothy P. Flynn(FE) Name Audit Comp., Nominating & Governance Executive Global Comp. Strategic Planning & Finance Tech & e-commerce Marissa A. Mayer
  • 40. Doug McMillon (C) Gregory B. Penner (C) Steven S Reinemund (C) H. Lee Scott, Jr. Jim C. Walton Christopher J. Williams(FE) (C) Linda S. Wolf (C) (C) Committee Chair (FE) Financial Expert Walmart 2014 Annual Report 15 From Left to right: 1| Linda S. Wolf Ms. Wolf is the retired Chairman of the Board of Directors and Chief Executive Officer of Leo Burnett Worldwide, Inc., an advertising agency and division of Publicis Groupe S.A. 2| Steven S Reinemund Mr. Reinemund is the Dean of Business and Professor of Leadership and Strategy at Wake Forest University. He previously served as the Chairman of the Board and Chairman and Chief Executive Officer of PepsiCo, Inc. 3| James I. Cash, Jr., Ph.D. (Presiding director) Dr. Cash is the James E. Robison Emeritus Professor of Business Administration at Harvard Business School, where he served from July 1976 to October 2003.
  • 41. 4| H. Lee Scott, Jr. Mr. Scott is the former Chairman of the Executive Committee of the Board of Directors of Wal-Mart Stores, Inc. He is the former President and Chief Executive Of ficer of Wal-Mart Stores, Inc., serving in that position from Januar y 2000 to Januar y 2009. 5| Roger C. Corbett Mr. Corbett is the retired Chief Executive Officer and Group Managing Director of Woolworths Limited, the largest retail company in Australia. 6| Aida M. Alvarez Ms. Alvarez is the former Administrator of the U.S. Small Business Administration and was a member of President Clinton’s Cabinet from 1997 to 2001. 7| Jim C. Walton Mr. Walton is the Chairman of the Board of Directors and Chief Executive Officer of Arvest Bank Group, Inc., a group of banks operating in the states of Arkansas, Kansas, Missouri and Oklahoma. 8| S. Robson Walton Mr. Walton is the Chairman of the Board of Directors of Wal-Mart Stores, Inc. 9| Gregory B. Penner Mr. Penner is a General Partner at Madrone Capital Partners, an investment management firm. 10| Timothy P. Flynn Mr. Flynn is the retired Chairman of KPMG International, a professional services firm.
  • 42. 11| Michael T. Duke Mr. Duke is the Chairman of the Executive Committee of the Board of Directors of Wal-Mart Stores, Inc. He is the former President and Chief Executive Officer of Wal-Mart Stores, Inc., serving in that position from February 2009 to January 2014. 12| Marissa A. Mayer Ms. Mayer is the Chief Executive Officer and President and Director of Yahoo!, Inc., a digital media company. 13| Douglas N. Daft Mr. Daft is the retired Chairman of the Board of Directors and Chief Executive Officer of The Coca-Cola Company, a beverage manufacturer, where he served in that capacity from Februar y 2000 until May 2004, and in various other capacities since 1969. 14| C. Douglas McMillon Mr. McMillon is the President and Chief Executive Officer of Wal-Mart Stores, Inc. 15| Christopher J. Williams Mr. Williams is the Chairman of the Board of Directors and Chief Executive Officer of The Williams Capital Group, L.P., an investment bank. 16| Pamela J. Craig Ms. Craig is the retired Chief Financial Of ficer of Accenture plc, a global management consulting, technology services, and outsourcing company. Board of Directors
  • 43. 16 Walmart 2014 Annual Report Fiscal 2014 was a tough year for Walmart. Sales and earnings were not where we wanted them to be, as we faced a number of economic headwinds around the world. But I’m confident in our future because Walmart continues to have an extremely strong underlying business. We’re proud of our AA credit rating – the highest in the retail industry. We have a strong balance sheet, and our business consistently generates robust cash flows. Walmart’s EDLC-EDLP business model resonates with customers, and even in this challenging retail environment, we delivered more than $473 billion in net sales. We also have great opportunities for continued global growth, whether it’s through the intersection of digital and physical retail, small format stores, or our increasing membership in Sam’s Club. When I consider our opportunities ahead, I’m excited about our future, and specifically this new fiscal year. At Walmart, we’re guided by our financial priorities – growth, leverage and returns. Customers want to shop on their terms. We’re focused on growth by providing customers a unified shopping experience, whether they’re in our supercenters for a large “stock-up trip,” in our smaller stores for groceries, or on their mobile device at their child’s ball game. Our top priority is to increase comp sales in all markets and channels. We drive productivity to deliver EDLC so we can pass savings to customers. These price investments provide greater value under our EDLP position to propel comp sales. In fiscal 2015, we’ll also invest approximately $12.4 billion to $13.4 billion in physical and digital
  • 44. assets to better serve customers worldwide. We expect to add between 35 million and 39 million net new retail square feet. And to connect with customers more effectively, we’re accelerating the rollout of small format stores in many of our markets, including the U.S., the U.K. and Mexico. Global eCommerce saw strong growth in fiscal 2014, with a 30 percent increase in sales. We’ll continue to invest to enhance technology platforms and expand fulfillment networks, including new facilities in Pennsylvania, Indiana and Brazil. Infrastructure investments help us to be nimble platform, Pangaea, will deliver a world-class integrated customer experience and improve our website speed, flexibility and scalability when it begins to roll out later this year. We’re also leveraging global best practices to increase site visits and add services such as the Asda Direct kiosk – which allows customers to order from online catalogs while they’re still in the store – to grocery delivery and drive-through pickup, which we’re testing in Denver in the U.S. In fiscal 2015, we expect Global eCommerce gross merchandise value, which includes digital sales of Walmart goods and third-party sales through our sites, to exceed $13 billion. We’re committed to being the lowest cost operator globally and leveraging expenses. In fiscal 2014, Walmart U.S. did a great job of leveraging operating expenses, and International and Sam’s Club took steps to lower their cost structures. We’re sharpening our ability to drive efficiencies in all operations. Globally, our teams are identifying best practices and sharing these efficiency measures so that they can be applied across the organization.
  • 45. Returning value to shareholders remains a key priority. In fact, we returned $12.8 billion to shareholders through dividends and share repurchases last year, bringing our five-year total to nearly $68 billion. And, in February, we announced our 41st consecutive annual dividend increase to $1.92 per share. As I close, I encourage you to review our financial results in the next section. We’re focused on consistent execution in every market to continue to serve our customers and deliver growth, leverage and returns for shareholders. Charles M. Holley, Jr. Executive Vice President and Chief Financial Officer Wal-Mart Stores, Inc. Our FY 2014 Financial Performance “ At Walmart, we’re guided by our financial priorities – growth, leverage and returns.” Charles Holley, Jr. Walmart 2014 Annual Report 17 Executive Officers
  • 46. Neil M. Ashe Executive Vice President, President and Chief Executive Officer, Global eCommerce Daniel J. Bartlett Executive Vice President, Corporate Affairs Rosalind G. Brewer Executive Vice President, President and Chief Executive Officer, Sam’s Club M. Susan Chambers Executive Vice President, Global People David Cheesewright Executive Vice President, President and Chief Executive Officer, Walmart International Michael T. Duke Chairman of the Executive Committee of the Board of Directors Rollin L. Ford Executive Vice President and Chief Administrative Officer Jeffrey J. Gearhart Executive Vice President, Global Governance and Corporate Secretary Charles M. Holley, Jr. Executive Vice President and Chief Financial Officer C. Douglas McMillon President and Chief Executive Officer
  • 47. William S. Simon Executive Vice President, President and Chief Executive Officer, Walmart U.S. Steven P. Whaley Senior Vice President and Controller 18 Five-Year Financial Summary 19 Management’s Discussion and Analysis of Financial Condition and Results of Operations 36 Consolidated Statements of Income Consolidated Statements of Comprehensive Income 37 Consolidated Balance Sheets 38 Consolidated Statements of Shareholders’ Equity 39 Consolidated Statements of Cash Flows 40 Notes to Consolidated Financial Statements 60 Report of Independent Registered Public Accounting Firm 61 Report of Independent Registered Public Accounting Firm on Internal Control Over Financial Reporting 62 Management’s Report to Our Shareholders 63 Unit Counts as of January 31, 2014
  • 48. 64 Corporate and Stock Information Five-Year Financial Summary As of and for the Fiscal Years Ended January 31, (Amounts in millions, except per share and unit count data) 2014 2013 2012 2011 2010 Operating results Total revenues $476,294 $468,651 $446,509 $421,395 $407,697 Percentage change in total revenues from previous fiscal year 1.6% 5.0% 6.0% 3.4% 8.1% Net sales 473,076 465,604 443,416 418,500 404,743 Percentage change in net sales from previous fiscal year 1.6% 5.0% 6.0% 3.4% 0.9% Increase (decrease) in calendar comparable sales (1) in the United States (0.5)% 2.4% 1.6% (0.6)% (0.8)% Walmart U.S. (0.6)% 2.0% 0.3% (1.5)% (0.7)% Sam’s Club 0.3% 4.1% 8.4% 3.9% (1.4)% Gross profit margin 24.3% 24.3% 24.5% 24.8% 24.9% Operating, selling, general and administrative expenses, as a percentage of net sales 19.3% 19.0% 19.2% 19.4% 19.7% Operating income $ 26,872 $ 27,725 $ 26,491 $ 25,508 $ 23,969 Income from continuing operations attributable to Walmart 15,918 16,963 15,734 15,340 14,433 Net income per common share: Diluted income per common share from continuing operations attributable to Walmart $ 4.85 $ 5.01 $ 4.53 $ 4.18 $ 3.72 Dividends declared per common share 1.88 1.59 1.46 1.21 1.09 Financial position
  • 49. Inventories $ 44,858 $ 43,803 $ 40,714 $ 36,437 $ 32,713 Property, equipment and capital lease assets, net 117,907 116,681 112,324 107,878 102,307 Total assets 204,751 203,105 193,406 180,782 170,407 Long-term debt and long-term capital lease obligations (excluding amounts due within one year) 44,559 41,417 47,079 43,842 36,401 Total Walmart shareholders’ equity 76,255 76,343 71,315 68,542 70,468 Unit counts Walmart U.S. segment 4,203 4,005 3,868 3,804 3,755 Walmart International segment 6,107 5,783 5,287 4,191 3,739 Sam’s Club segment 632 620 611 609 605 Total units 10,942 10,408 9,766 8,604 8,099 (1) Comparable store and club sales include fuel. Comparable sales include sales from stores and clubs open for the previous 12 months, including remodels, relocations and expansions, as well as e-commerce sales. Walmart 2014 Annual Report 1918 Walmart 2014 Annual Report Management’s Discussion and Analysis of Financial Condition and Results of Operations Overview Wal-Mart Stores, Inc. (“Walmart,” the “Company” or “we”) operates retail and other stores in various formats around the world and is committed to saving people money so they can live better. Our operations
  • 50. consist of three reportable segments: Walmart U.S., Walmart International and Sam’s Club. • The Walmart U.S. segment includes the Company’s mass merchant concept in the United States (“U.S.”), operating under the “Walmart” or “Wal-Mart” brand with various formats, including supercenters, discount stores, Neighborhood Markets and other small stores, as well as walmart.com. Of our three segments, Walmart U.S. is the largest and has historically had the highest gross profit as a percentage of net sales (“gross profit rate”). In addition, Walmart U.S. has historically contributed the greatest amount to the Company’s net sales and operating income. • The Walmart International segment consists of the Company’s operations outside of the U.S., including various retail websites. Walmart International operates retail, wholesale and other types of units, including restaurants and some banks. The overall gross profit rate for Walmart International is lower than that of Walmart U.S. because of its merchandise mix. Walmart International has generally been our most rapidly growing segment, growing primarily through new stores and acquisitions and, in recent years, has been growing its net sales and operating income at a faster
  • 51. rate than our other segments. However, for fiscal 2014, Walmart International sales growth slowed due to fluctuations in currency exchange rates, as well as no significant acquisitions, and operating income declined as a result of certain operating expenses. • The Sam’s Club segment includes the warehouse membership clubs in the U.S., as well as samsclub.com. Sam’s Club operates as a membership club warehouse with a lower gross profit rate and lower operating expenses as a percentage of net sales than our other segments. At Walmart U.S., we earn the trust of our customers every day by providing a broad assortment of quality merchandise and services at everyday low prices (“EDLP”), while fostering a culture that rewards and embraces mutual respect, integrity and diversity. EDLP is our pricing philosophy under which we price items at a low price every day so that our customers trust that our prices will not change under frequent pro- motional activities. Our focus for Sam’s Club is to provide exceptional value on brand name and private label merchandise at “members only” prices for both business and personal use. Internationally, we operate with similar philosophies.
  • 52. Our fiscal year ends on January 31 for our U.S. and Canadian operations. We consolidate all other operations generally using a one-month lag and on a calendar year basis. Our business is seasonal to a certain extent due to different calendar events and national and religious holidays, as well as different weather patterns. Historically, our highest sales volume and operating income have occurred in the fiscal quarter ending January 31. This discussion, which presents our results for the fiscal years ended January 31, 2014 (“fiscal 2014”), January 31, 2013 (“fiscal 2013”) and January 31, 2012 (“fiscal 2012”), should be read in conjunction with our Consolidated Financial Statements and accompanying notes. We intend for this discussion to provide the reader with information that will assist in understanding our financial statements, the changes in certain key items in those financial statements from period to period and the pri- mary factors that accounted for those changes. We also discuss certain performance metrics that management uses to assess the Company’s performance. Additionally, the discussion provides information about the financial results of the various segments of our business to
  • 53. provide a better understanding of how those segments and their results affect the financial condition and results of operations of the Company as a whole. Throughout this Management’s Discussion and Analysis of Financial Condition and Results of Operations, we discuss segment operating income, comparable store and club sales and other measures. Manage- ment measures the results of the Company’s segments using, among other measures, each segment’s operating income, including certain corporate overhead allocations. From time to time, we revise the measurement of each segment’s operating income or other measures, which include certain corporate overhead allocations, as determined by the information regularly reviewed by our chief operating decision maker. When we do so, the previous period amounts and balances are reclassified to conform to the current period’s presentation. The amounts disclosed for “Corporate and support” in the leverage discussion of the Company’s performance metrics consist of corporate overhead and other items not allocated to any of the Company’s segments. Comparable store and club sales is a metric that indicates the performance of our existing U.S. stores and clubs by measuring the change in
  • 54. sales for such stores and clubs, including e-commerce sales, for a particular period from the corresponding period in the previous year. Walmart’s definition of comparable store and club sales includes sales from stores and clubs open for the previous 12 months, including remodels, relocations, expansions and conversions, as well as e-commerce sales. We measure the e-commerce sales impact by including those sales initiated through our websites and fulfilled through our dedicated e-commerce distribution facilities, as well as an estimate for sales initiated online, but fulfilled through our stores and clubs. Changes in format are excluded from comparable store and club sales when the conversion is accompanied by a relocation or expansion that results in a change in retail square feet of more than five percent. Comparable store and club sales are also referred to as “same-store” sales by others within the retail industry. The method of calculating comparable store and club sales varies across the retail industry. As a result, our calculation of comparable store and club sales is not necessarily comparable to similarly titled measures reported by other companies. In discussing our operating results, the term currency exchange rates
  • 55. refers to the currency exchange rates we use to convert the operating results for all countries where the functional currency is not the U.S. dollar. We calculate the effect of changes in currency exchange rates as the difference between current period activity translated using the current period’s currency exchange rates, and the comparable prior year period’s currency exchange rates. Throughout our discussion, we refer to the results of this calculation as the impact of currency exchange rate fluctuations. When we refer to constant currency operating results, we are referring to our operating results without the impact of the currency exchange rate fluctuations and without the impact of acquisitions until the acquisitions are included in both comparable periods. The disclosure of constant currency amounts or results permits investors to understand better Walmart’s underlying performance without the effects of cur- rency exchange rate fluctuations or acquisitions. Volatility in currency exchange rates may impact the results, including net sales and operating income, of the Company and the Walmart International segment in the future. Walmart 2014 Annual Report 1918 Walmart 2014 Annual Report
  • 56. Management’s Discussion and Analysis of Financial Condition and Results of Operations We made certain reclassifications to prior period amounts or balances to conform to the presentation in the current fiscal year. These reclassifications did not impact the Company’s operating income or consolidated net income. Additionally, certain prior period segment asset and expense allocations have been reclassified among segments to be comparable with the current period presentation. The Retail Industry We operate in the highly competitive retail industry in all of the countries we serve. We face strong sales competition from other discount, depart- ment, drug, dollar, variety and specialty stores, warehouse clubs and supermarkets, as well as internet-based retailers and catalog businesses. Many of these competitors are national, regional or international chains. We compete with a number of companies for prime retail site locations, as well as in attracting and retaining quality employees (whom we call “associates”). We, along with other retail companies, are influenced by a number of factors including, but not limited to: catastrophic
  • 57. events, climate change, competitive pressures, consumer disposable income, consumer debt levels and buying patterns, consumer credit availability, cost of goods, currency exchange rate fluctuations, customer preferences, deflation, fuel and energy prices, general economic conditions, inflation, insurance costs, interest rates, labor costs, tax rates, unemployment and weather patterns. Further information on the factors that can affect our operating results and on certain risks to our Company and an investment in its securities can be located in “Item 1A. Risk Factors” in our Annual Report on Form 10-K for the fiscal year ended January 31, 2014, and in the discussion under “Forward-Looking Statements.” Company Performance Metrics The Company’s performance metrics emphasize three priorities for improving shareholder value: growth, leverage and returns. The Company’s priority of growth focuses on sales through comparable store and club sales, including e-commerce sales, and unit square feet growth; the priority of leverage encompasses the Company’s objective to increase its operating income at a faster rate than the growth in net sales by growing its operating, selling, general and administrative expenses
  • 58. (“operating expenses”) at a slower rate than the growth of its net sales; and the priority of returns focuses on how efficiently the Company employs its assets through return on investment and how effectively the Company manages working capital through free cash flow. Growth Net Sales Fiscal Years Ended January 31, (Amounts in millions) 2014 2013 2012 Percent Percent Percent Percent Percent Net Sales of Total Change Net Sales of Total Change Net Sales of Total Walmart U.S. $279,406 59.0% 1.8% $274,433 59.0% 3.9% $264,186 59.6% Walmart International 136,513 28.9% 1.3% 134,748 28.9% 7.4% 125,435 28.3% Sam’s Club 57,157 12.1% 1.3% 56,423 12.1% 4.9% 53,795 12.1% Net sales $473,076 100.0% 1.6% $465,604 100.0% 5.0% $443,416 100.0% Our consolidated net sales increased 1.6% and 5.0% for fiscal 2014 and 2013, respectively, when compared to the previous fiscal year. The increase in net sales for fiscal 2014 was primarily due to 3.1% year- over-year growth in retail square feet, higher e-commerce sales, the impact of fiscal 2013 acquisitions, which accounted for $730 million of the net sales
  • 59. increase, and positive comparable club sales at Sam’s Club. The positive effect of these items was partially offset by $5.1 billion of negative impact from fluctuations in currency exchange rates and decreases in comparable store sales at Walmart U.S. and in a number of our international operations. The increase in net sales for fiscal 2013 was due to 3.3% growth in retail square feet and positive comparable store and club sales. Additionally, net sales from acquisitions, through their respective anniversary dates, accounted for $4.0 billion of the increase in net sales. The increase in net sales for fiscal 2013 was partially offset by $4.5 billion of negative impact from fluctuations in currency exchange rates. Walmart 2014 Annual Report 2120 Walmart 2014 Annual Report Management’s Discussion and Analysis of Financial Condition and Results of Operations Calendar Comparable Store and Club Sales Comparable store and club sales is a metric that indicates the performance of our existing U.S. stores and clubs by measuring the change in sales for such stores and clubs, including e-commerce sales, for a particular period over the corresponding period in the previous year. The retail industry generally reports comparable store and club sales using the retail calendar (also known as the 4-5-4 calendar) and, to be consistent with the retail industry, we provide comparable store and club sales using the retail calendar in our quarterly earnings releases. However,
  • 60. when we discuss our comparable store and club sales below, we are referring to our calendar comparable store and club sales calculated using our fiscal calendar. As our fiscal calendar differs from the retail calendar, our calendar comparable store and club sales also differ from the retail calendar comparable store and club sales provided in our quarterly earnings releases. Calendar comparable store and club sales, as well as the impact of fuel, for fiscal 2014 and 2013, were as follows: With Fuel Fuel Impact Fiscal Years Ended January 31, Fiscal Years Ended January 31, 2014 2013 2014 2013 Walmart U.S. (0.6)% 2.0% 0.0% 0.0% Sam’s Club 0.3% 4.1% (0.3)% 0.3% Total U.S. (0.5)% 2.4% (0.1)% 0.1% Comparable store and club sales in the U.S., including fuel, decreased 0.5% in fiscal 2014 and increased 2.4% in fiscal 2013, when compared to the previous fiscal year. The total U.S. comparable store and club sales for fiscal 2014 were negatively impacted by lower consumer spending primarily due to the slow recovery in general economic conditions, the 2% increase in the 2013 payroll tax rate, and the reduction in government food benefits and severe winter storms that occurred during the fourth quarter. These factors were partially offset by increased member traffic at Sam’s Club primarily coming from Savings Members. Additionally, e-commerce sales
  • 61. positively impacted Walmart U.S. comparable store and Sam’s Club comparable club sales percentages by approximately 0.3%. The total U.S. comparable store and club sales for fiscal 2013 increased as a result of improved average ticket and an increase in customer traffic. As we continue to add new stores and clubs in the U.S., we do so with an understanding that additional stores and clubs may take sales away from existing units. We estimate the negative impact on comparable store and club sales as a result of opening new stores and clubs was approximately 0.8% and 0.7% in fiscal 2014 and 2013, respectively. Our estimate is calculated primarily by comparing the sales trends of the impacted stores and clubs, which are identified based on their proximity to the new stores and clubs, to those of nearby non-impacted stores and clubs, in each case, as measured after the new stores and clubs are opened. Leverage Operating Income Fiscal Years Ended January 31, (Amounts in millions) 2014 2013 2012 Operating Percent Percent Operating Percent Percent Operating Percent Income of Total Change Income of Total Change Income of Total Walmart U.S. $22,351 83.2% 4.0% $21,491 77.5% 5.4% $20,381 76.9% Walmart International 5,454 20.3% (17.6)% 6,617 23.9% 8.2%
  • 62. 6,113 23.1% Sam’s Club 1,975 7.3% 0.8% 1,960 7.1% 6.3% 1,844 7.0% Corporate and support (2,908) (10.8)% 24.1% (2,343) (8.5)% 26.9% (1,847) (7.0)% Operating income $26,872 100.0% (3.1)% $27,725 100.0% 4.7% $26,491 100.0% We believe comparing both the growth of our operating expenses and our operating income to the growth of our net sales are meaningful measures as they indicate how effectively we manage costs and leverage operating expenses. Our objective for a fiscal year is to grow operating expenses at a slower rate than net sales and to grow operating income at a faster rate than net sales. On occasion, we may make strategic growth investments that may, at times, cause our operating expenses to grow at a faster rate than net sales and that may result in our operating income growing at a slower rate than net sales. Walmart 2014 Annual Report 2120 Walmart 2014 Annual Report Management’s Discussion and Analysis of Financial Condition and Results of Operations Operating Expenses For fiscal 2014, we did not meet our objective of growing operating expenses at a slower rate than net sales as operating expenses as a percentage of net sales increased 27 basis points. Overall,
  • 63. lower than anticipated net sales, higher investment in key areas, such as global leverage and e-commerce initiatives, and nearly $1.0 billion of increased expenses for various matters described in the Walmart International seg- ment discussion, were the primary causes for the increase in operating expenses as a percentage of net sales. Additional expenses related to the Foreign Corrupt Practices Act (“FCPA”) inquiries and investigations, as well as our global compliance program and related organizational enhancements, also contributed to the increase in operating expenses as a percentage of net sales. The negative leverage impact of these items was partially offset by lower incentive expenses for fiscal 2014. For fiscal 2013, we met our objective of growing operating expenses at a slower rate than net sales as operating expenses as a percentage of net sales decreased 14 basis points. The fiscal 2013 decrease in operating expenses as a percentage of net sales was primarily due to productivity improvements and expense management. Expenses incurred for the FCPA inquiries and investigations, as well as our global compliance program and related organizational enhancements, were $282 million and $157 million for fiscal 2014 and 2013, respectively.
  • 64. Operating Income For fiscal 2014, we did not meet our objective of growing operating income at a faster rate than net sales as operating income decreased 3.1% while net sales increased 1.6%, when compared to the previous fiscal year. This was primarily due to the factors we discussed for not leveraging operating expenses, partially offset by increases in member- ship and other income of 5.6%. For fiscal 2013, we also did not meet our objective of growing operating income at a faster rate than net sales as operating income increased 4.7% while net sales increased 5.0%, when compared to the previous fiscal year. The primary causes for operating income growing slower than net sales in fiscal 2013 were our increased investments in e-commerce initiatives, increased expenses related to the FCPA inquiries and investigations, as well as our global compliance program and related organizational enhancements, and investments in price, which reduced gross margin. Returns Return on Investment Management believes return on investment (“ROI”) is a meaningful metric to share with investors because it helps investors assess how
  • 65. effectively Walmart is deploying its assets. Trends in ROI can fluctuate over time as management balances long-term potential strategic initiatives with possible short-term impacts. ROI was 17.0% and 18.1% for fiscal 2014 and 2013, respectively. The decline in ROI was primarily due to a decline in operating income, investments in property and equipment and the impact of acquisitions. ROI is considered a non-GAAP financial measure. We consider return on assets (“ROA”) to be the financial measure computed in accordance with generally accepted accounting principles (“GAAP”) that is the most directly comparable financial measure to our calculation of ROI. ROA was 8.1% and 8.9% for fiscal 2014 and 2013, respectively. We define ROI as adjusted operating income (operating income plus interest income, depreciation and amortization, and rent expense) for the trailing twelve months or fiscal year divided by average invested capital during that period. We consider average invested capital to be the average of our beginning and ending total assets of continuing operations, plus average accumulated depreciation and amortization less average accounts payable and average accrued liabilities for that period, plus a rent factor equal to the rent for the fiscal year or
  • 66. trailing twelve months multiplied by a factor of eight. When we have discontinued operations, we exclude the impact of the discontinued operations. Our calculation of ROI is considered a non-GAAP financial measure because we calculate ROI using financial measures that exclude and include amounts that are included and excluded in the most directly comparable GAAP financial measure. For example, we exclude the impact of depreciation and amortization from our reported operating income in calculating the numerator of our calculation of ROI. In addi- tion, we include a factor of eight for rent expense that estimates the hypothetical capitalization of our operating leases. ROI differs from ROA (which is consolidated income from continuing operations for the period divided by average total assets of continuing operations for the period) because ROI: adjusts operating income to exclude certain expense items and adds interest income; adjusts total assets of continuing operations for the impact of accumulated depreciation and amortization, accounts payable and accrued liabilities; and incorporates a factor of rent to arrive at total invested capital.
  • 67. Although ROI is a standard financial metric, numerous methods exist for calculating a company’s ROI. As a result, the method used by management to calculate our ROI may differ from the methods used by other companies to calculate their ROI. We urge you to understand the methods used by other companies to calculate their ROI before comparing our ROI to that of such other companies. Walmart 2014 Annual Report 2322 Walmart 2014 Annual Report Management’s Discussion and Analysis of Financial Condition and Results of Operations The calculation of ROI, along with a reconciliation to the calculation of ROA, the most comparable GAAP financial measure, is as follows: Fiscal Years Ended January 31, (Amounts in millions) 2014 2013 CALCULATION OF RETURN ON INVESTMENT Numerator Operating income $ 26,872 $ 27,725 + Interest income 119 186 + Depreciation and amortization 8,870 8,478 + Rent 2,828 2,581
  • 68. = Adjusted operating income $ 38,689 $ 38,970 Denominator Average total assets of continuing operations (1) $203,680 $198,193 + Average accumulated depreciation and amortization (1) 57,907 51,829 - Average accounts payable (1) 37,748 37,344 - Average accrued liabilities (1) 18,802 18,481 + Rent x 8 22,624 20,648 = Average invested capital $227,661 $214,845 Return on investment (ROI) 17.0% 18.1% CALCULATION OF RETURN ON ASSETS Numerator Income from continuing operations $ 16,551 $ 17,704 Denominator Average total assets of continuing operations (1) $203,680 $198,193 Return on assets (ROA) 8.1% 8.9% As of January 31, 2014 2013 2012 Certain Balance Sheet Data Total assets of continuing operations (2) $204,291 $203,068 $193,317 Accumulated depreciation and amortization 60,771 55,043 48,614 Accounts payable 37,415 38,080 36,608
  • 69. Accrued liabilities 18,793 18,808 18,154 (1) The average is based on the addition of the account balance at the end of the current period to the account balance at the end of the prior period and dividing by 2. (2) Total assets of continuing operations as of January 31, 2014, 2013 and 2012 in the table exclude assets of discontinued operations that are reflected in the Company’s Consolidated Balance Sheets of $460 million, $37 million and $89 million, respectively. Free Cash Flow We define free cash flow as net cash provided by operating activities in a period minus payments for property and equipment made in that period. We generated free cash flow of $10.1 billion, $12.7 billion and $10.7 billion for fiscal 2014, 2013 and 2012, respectively. The decline in free cash flow for fiscal 2014, when compared to the previous fiscal year, was primarily due to the timing of income tax payments, as well as lower income from continuing operations and slightly higher capital expenditures. The fiscal 2013 increase in free cash flow was primarily due to higher income from continuing operations positively impacting net cash generated from operating activities and lower capital expenditures. Free cash flow is considered a non-GAAP financial measure.
  • 70. We consider net cash provided by operating activities to be the GAAP financial measure most directly comparable to free cash flow. Management believes that free cash flow, which measures our ability to generate additional cash from our business operations, is an important financial measure for use in evaluating the Company’s financial performance. Free cash flow should be considered in addition to, rather than as a substitute for, consolidated income from continuing operations as a measure of our performance and net cash provided by operating activities as a measure of our liquidity. Additionally, our definition of free cash flow is limited, in that it does not represent residual cash flows available for discretionary expenditures as the measure does not deduct the payments required for debt service and other contractual obligations or payments made for business acqui- sitions. Therefore, we believe it is important to view free cash flow as a measure that provides supplemental information to our Consolidated Statements of Cash Flows. Although other companies report their free cash flow, numerous methods may exist for calculating a company’s free cash flow. As a result,
  • 71. the method used by our management to calculate our free cash flow may differ from the methods used by other companies to calculate their free cash flow. We urge you to understand the methods used by other companies to calculate their free cash flow before comparing our free cash flow to that of such other companies. The following table sets forth a reconciliation of free cash flow to net cash provided by operating activities, as well as information regarding net cash used in investing activities and net cash used in financing activities. Fiscal Years Ended January 31, (Amounts in millions) 2014 2013 2012 Net cash provided by operating activities $ 23,257 $ 25,591 $ 24,255 Payments for property and equipment (13,115) (12,898) (13,510) Free cash flow $ 10,142 $ 12,693 $ 10,745 Net cash used in investing activities (1) $(12,298) $(12,611) $(16,609) Net cash used in financing activities (11,017) (11,972) (8,458) (1) “Net cash used in investing activities” includes payments for property and
  • 72. equipment, which is also included in our computation of free cash flow. Walmart 2014 Annual Report 2322 Walmart 2014 Annual Report Management’s Discussion and Analysis of Financial Condition and Results of Operations Results of Operations Consolidated Results of Operations (Amounts in millions, Fiscal Years Ended January 31, except unit counts) 2014 2013 2012 Total revenues $476,294 $468,651 $446,509 Percentage change in total revenues from previous fiscal year 1.6% 5.0% 6.0% Net sales $473,076 $465,604 $443,416 Percentage change in net sales from previous fiscal year 1.6% 5.0% 5.9% Total U.S. calendar comparable store and club sales (0.5)% 2.4% 1.6% Gross profit margin as a percentage of net sales 24.3% 24.3% 24.5% Operating income $ 26,872 $ 27,725 $ 26,491 Operating income as a percentage of net sales 5.7% 6.0% 6.0% Income from continuing
  • 73. operations $ 16,551 $ 17,704 $ 16,408 Unit counts at period end 10,942 10,408 9,766 Retail square feet at period end 1,101 1,070 1,035 Our total revenues, which are mostly comprised of net sales, but also include membership and other income, increased 1.6% and 5.0% for fiscal 2014 and 2013, respectively, when compared to the previous fiscal year. The increase in total revenues was primarily a result of increases in our net sales, which also increased 1.6% and 5.0% for fiscal 2014 and 2013, respectively. The increase in net sales for fiscal 2014 was primarily due to 3.1% year-over-year growth in retail square feet, higher e- commerce sales, the impact of fiscal 2013 acquisitions, which accounted for $730 million of the net sales increase, and positive comparable club sales at Sam’s Club. The positive effect of these items was partially offset by $5.1 billion of negative impact from fluctuations in currency exchange rates and decreases in comparable store sales at Walmart U.S. and in a number of our international operations. The increase in net sales for fiscal 2013 was due to 3.3% growth in retail square feet and positive comparable store and club sales. Additionally, net sales from acquisitions, through their respective anniversary dates, accounted for $4.0 billion of the increase in
  • 74. net sales. The increase in net sales for fiscal 2013 was partially offset by $4.5 billion of negative impact from fluctuations in currency exchange rates. Increases in membership and other income of 5.6%, primarily due to higher membership and other income at Sam’s Club, also contributed to the increase in total revenues for fiscal 2014 and 2013. Our gross profit rate decreased 3 basis points for fiscal 2014, when compared to the previous fiscal year, primarily due to our ongoing investment in price, as well as merchandise mix. For fiscal 2013, gross profit rate decreased 12 basis points, when compared to the previous fiscal year, primarily due to the Walmart U.S. segment’s strategic focus on price investment and low price leadership. For fiscal 2014, we did not meet our objective of growing operating expenses at a slower rate than net sales as operating expenses as a percentage of net sales increased 27 basis points. Overall, lower than anticipated net sales, higher investment in key areas, such as global leverage and e-commerce initiatives, and nearly $1.0 billion of increased expenses for various matters described in the Walmart International segment discussion, were the primary cause for the increase in operating
  • 75. expenses as a percentage of net sales. Additional expenses related to the FCPA inquiries and investigations, as well as our global compliance pro- gram and related organizational enhancements also contributed to the increase in operating expenses as a percentage of net sales. The negative leverage impact of these items was partially offset by lower incentive expenses for fiscal 2014. For fiscal 2013, we met our objective of growing operating expenses at a slower rate than net sales as operating expenses as a percentage of net sales decreased 14 basis points. The fiscal 2013 decrease in operating expenses as a percentage of net sales was primarily due to productivity improvements and expense management. For fiscal 2014, we did not meet our objective of growing operating income at a faster rate than net sales as operating income decreased 3.1% while net sales increased 1.6%, when compared to the previous fiscal year. This was primarily due to the factors we discussed for not leveraging operating expenses, partially offset by increases in member- ship and other income. For fiscal 2013, we also did not meet our objective of growing operating income at a faster rate than net sales as operating income increased 4.7% while net sales increased 5.0%, when compared to the previous fiscal year. The primary causes for
  • 76. operating income growing slower than net sales in fiscal 2013 were investments in e-commerce initiatives, increased expenses related to the FCPA inquiries and investigations, as well as our global compliance program and related organizational enhancements, and investments in price, which reduced gross margin. Our effective income tax rates were 32.9%, 31.0% and 32.6% for fiscal 2014, 2013 and 2012, respectively. The reconciliation from the U.S. statutory rate to the effective income tax rates for fiscal 2014, 2013 and 2012 is presented in Note 9 in the “Notes to Consolidated Financial Statements.” Our effective income tax rate for fiscal 2014 was higher than in fiscal 2013 primarily due to the tax impacts attributable to repatriated international earnings during fiscal 2014. Our fiscal 2013 effective income tax rate was lower than in fiscal 2012 primarily because the fiscal 2013 rate benefited from a number of discrete tax items, including the positive impact from fiscal 2013 legislative changes arising at the end of the fiscal 2012 year, most notably the American Taxpayer Relief Act of 2012. Our effective income tax rate may fluctuate from period to period as a result of factors including changes in our assessment of certain tax
  • 77. contingencies, increases or decreases in valuation allowances, changes in tax law, outcomes of administrative audits, the impact of discrete items and the mix of earnings among our U.S. and international operations where the statutory rates are generally lower than the U.S. statutory rate. As a result of the factors discussed above, we reported $16.6 billion, $17.7 billion and $16.4 billion of consolidated income from continuing operations for fiscal 2014, 2013 and 2012, respectively, a decrease of $1.1 billion for fiscal 2014 and an increase of $1.3 billion for fiscal 2013, when compared to the previous fiscal year. Diluted income per common share from continuing operations attributable to Walmart (“EPS”) was $4.85, $5.01 and $4.53 for fiscal 2014, 2013 and 2012, respectively. Walmart 2014 Annual Report 2524 Walmart 2014 Annual Report Management’s Discussion and Analysis of Financial Condition and Results of Operations Walmart U.S. Segment (Amounts in millions,
  • 78. Fiscal Years Ended January 31, except unit counts) 2014 2013 2012 Net sales $279,406 $274,433 $264,186 Percentage change from previous fiscal year 1.8% 3.9% 1.5% Calendar comparable store sales (0.6)% 2.0% 0.3% Operating income $ 22,351 $ 21,491 $ 20,381 Operating income as a percentage of net sales 8.0% 7.8% 7.7% Unit counts at period end 4,203 4,005 3,868 Retail square feet at period end 659 641 627 Net sales for the Walmart U.S. segment increased 1.8% and 3.9% for fiscal 2014 and 2013, respectively, when compared to the previous fiscal year. For fiscal 2014, the increase in net sales was due to year-over- year growth in retail square feet of 2.9%, partially offset by a decline in comparable store sales of (0.6)%. Our comparable store sales were negatively impacted by lower consumer spending primarily due to the slow recovery in general economic conditions, the 2% increase in the 2013 payroll tax rate, and the reduction in government food benefits and severe winter storms that occurred in the fourth quarter. For fiscal 2013, the increase in net sales was due to a 2.0% increase in comparable store sales as a result
  • 79. of higher average ticket and an increase in customer traffic, combined with a 2.2% increase in retail square feet. The fiscal 2014 gross profit rate declined slightly when compared to the previous fiscal year primarily due to our commitment to low price leadership, especially during fiscal 2014’s highly competitive holiday sales season, partially offset by cost of goods savings initiatives and supply chain productivity. Gross profit rate declined 16 basis points for fiscal 2013, when compared to the previous fiscal year, primarily due to our strategic focus on price investment and low price leadership. Walmart U.S. leveraged operating expenses for fiscal 2014 and 2013, as operating expenses as a percentage of segment net sales declined 18 and 27 basis points, respectively, compared to the previous fiscal year. The decrease in operating expenses as a percentage of segment net sales was driven by productivity initiatives in both years, as well as lower incentive expenses in fiscal 2014. As a result of the factors discussed above, segment operating income was $22.4 billion, $21.5 billion and $20.4 billion during fiscal 2014, 2013 and 2012, respectively, and Walmart U.S. grew operating
  • 80. income faster than sales during fiscal 2014 and 2013. Walmart International Segment (Amounts in millions, Fiscal Years Ended January 31, except unit counts) 2014 2013 2012 Net sales $136,513 $134,748 $125,435 Percentage change from previous fiscal year 1.3% 7.4% 15.3% Operating income $ 5,454 $ 6,617 $ 6,113 Operating income as a percentage of net sales 4.0% 4.9% 4.9% Unit counts at period end 6,107 5,783 5,287 Retail square feet at period end 358 346 326 Net sales for the Walmart International segment increased 1.3% and 7.4% for fiscal 2014 and 2013, respectively, when compared to the previous fiscal year. For fiscal 2014, the increase in net sales was due to year-over- year growth in retail square feet of 3.6% and the impact of fiscal 2013 acquisitions, which accounted for $730 million of the net sales increase. In addition, higher e-commerce sales in each country with e- commerce operations, particularly in the United Kingdom, Brazil and China, contributed to the increase in net sales. The increase in net sales was partially offset by $5.1 billion of negative impact from
  • 81. fluctuations in currency exchange rates. For fiscal 2013, the increase in net sales was due to year-over-year growth in retail square feet of 5.9% and positive comparable sales. In addition, net sales from fiscal 2012 acquisitions accounted for $4.0 billion of the increase in net sales. The increase in net sales was partially offset by $4.5 billion of negative impact from fluctuations in currency exchange rates. Gross profit rate decreased 10 basis points for fiscal 2014 and was flat for fiscal 2013, when compared to the previous fiscal year. The fiscal 2014 decrease in gross profit rate was primarily due to price investments in certain countries, including Brazil, Canada and Mexico. Walmart International did not leverage operating expenses for fiscal 2014 as operating expenses as a percentage of segment net sales increased 80 basis points, when compared to the previous fiscal year. Operating expenses as a percentage of segment net sales were impacted by lower than anticipated net sales, increased wages and strategic investments, including investments in e-commerce initiatives. In addition, we incurred nearly $1.0 billion of aggregated expenses for the following matters that contributed to the increase in our operating expenses as a
  • 82. percentage of segment net sales: • Charges for contingencies for non-income taxes and employment claims in Brazil; • Charges for the closure of 29 units in China and 25 units in Brazil due to poor performance; • Store lease expenses in China and Mexico to correct a historical accounting practice that did not conform to our global accounting policies; and • Expenses for the termination of the joint venture, franchise and supply agreements related to our former partner’s retail store operations in India. Walmart 2014 Annual Report 2524 Walmart 2014 Annual Report Management’s Discussion and Analysis of Financial Condition and Results of Operations Operating expenses as a percentage of segment net sales decreased 22 basis points in fiscal 2013, when compared to the previous fiscal year. Walmart International leveraged operating expenses in fiscal
  • 83. 2013 pri- marily due to expense management. While each country is focused on leveraging operating expenses, the countries that generated the most leverage included Brazil, Chile and the United Kingdom in fiscal 2013. As a result of the factors discussed above, segment operating income was $5.5 billion, $6.6 billion and $6.1 billion for fiscal 2014, 2013 and 2012, respectively. Fluctuations in currency exchange rates negatively impacted operating income $26 million and $111 million in fiscal 2014 and fiscal 2013, respectively, and positively impacted operating income $105 million in fiscal 2012. Walmart International did not grow operating income faster than net sales in fiscal 2014, but grew operating income faster than net sales in fiscal 2013. Sam’s Club Segment We believe the information in the following table under the caption “Excluding Fuel” is useful to investors because it permits investors to understand the effect of the Sam’s Club segment’s fuel sales on its results of operations, which are impacted by the volatility of fuel prices. Volatility in fuel prices may continue to impact the operating results of the Sam’s Club segment in the future.
  • 84. (Amounts in millions, Fiscal Years Ended January 31, except unit counts) 2014 2013 2012 Including Fuel Net sales $57,157 $56,423 $53,795 Percentage change from comparable period 1.3% 4.9% 8.8% Calendar comparable club sales increase 0.3% 4.1% 8.4% Operating income $ 1,975 $ 1,960 $ 1,844 Operating income as a percentage of net sales 3.5% 3.5% 3.4% Unit counts at period end 632 620 611 Retail square feet at period end 84 83 82 Excluding Fuel Net sales $50,574 $49,789 $47,616 Percentage change from previous fiscal year 1.6% 4.6% 5.4% Operating income $ 1,949 $ 1,913 $ 1,805 Operating income as a percentage of net sales 3.9% 3.8% 3.8% Net sales for the Sam’s Club segment increased 1.3% and 4.9% for fiscal 2014 and 2013, respectively, when compared to the previous fiscal year. The fiscal 2014 increase in net sales was due to year-over-year growth in retail square feet of 2.1%, driven by the addition of 12 new clubs, as well as positive comparable club sales of 0.3%. Our positive comparable club sales were the result of increased member traffic primarily
  • 85. coming from our Savings Members, partially offset by severe winter storms that occurred in the fourth quarter. The net sales increase in fiscal 2013 was primarily due to positive comparable club sales, driven by an increase in customer traffic and average ticket. The addition of nine new clubs in fiscal 2013 also helped increase net sales. Gross profit rate was flat for fiscal 2014 and 2013, when compared to the previous fiscal year. For fiscal 2014, our gross profit was negatively impacted by $39 million from an adjustment to our product warranty liabilities, which was offset by a favorable impact from merchandise mix. Membership and other income increased 14.1% and 3.0% for fiscal 2014 and 2013, respectively, when compared to the previous fiscal year. The fiscal 2014 increase was primarily due to the improved contract terms relating to the profit sharing arrangement with our credit card provider, increased membership fees that were introduced on May 15, 2013, $24 million of income from the sale of two real estate properties and an increase in members from the opening of 12 new clubs. The fiscal 2013 increase was primarily due to an increase in total members aided by the opening of nine new clubs.
  • 86. Sam’s Club did not leverage expenses for fiscal 2014 as operating expenses as a percentage of segment net sales increased 26 basis points, when compared to the previous fiscal year. The increase in operating expenses as a percentage of segment net sales was primarily due to a $59 million charge for the implementation of a new in-club staffing structure and the pending closure of one club, as well as a state excise tax refund credit we received in the previous fiscal year. Sam’s Club leveraged expenses for fiscal 2013 as operating expenses as a percentage of segment net sales decreased 9 basis points, when compared to the previous fiscal year. The fiscal 2013 decrease was due to improved wage management, a state excise tax refund credit we received and lower expenses in connection with club remodels. As a result of the factors discussed above, operating income was $2.0 billion, $2.0 billion and $1.8 billion for fiscal 2014, 2013 and 2012, respectively. Sam’s Club did not grow operating income faster than net sales in fiscal 2014, but did grow operating income faster than sales in fiscal 2013. Liquidity and Capital Resources Liquidity
  • 87. Cash flows provided by operating activities have historically supplied us with a significant source of liquidity. We use these cash flows, supple- mented with long-term debt and short-term borrowings, to fund our operations and global expansion activities. Generally, some or all of the remaining available cash flow funds all or part of the dividends on our common stock and share repurchases. Fiscal Years Ended January 31, (Amounts in millions) 2014 2013 2012 Net cash provided by operating activities $ 23,257 $ 25,591 $ 24,255 Payments for property and equipment (13,115) (12,898) (13,510) Free cash flow $ 10,142 $ 12,693 $ 10,745 Net cash used in investing activities (1) $(12,298) $(12,611) $(16,609) Net cash used in financing activities (11,017) (11,972) (8,458) (1) “Net cash used in investing activities” includes payments for property and equipment, which is also included in our computation of free cash flow. Walmart 2014 Annual Report 2726 Walmart 2014 Annual Report
  • 88. Management’s Discussion and Analysis of Financial Condition and Results of Operations Cash Flows Provided by Operating Activities Cash flows provided by operating activities were $23.3 billion, $25.6 billion and $24.3 billion for fiscal 2014, 2013 and 2012, respectively. The decrease in cash flows provided by operating activities for fiscal 2014, when compared to the previous fiscal year, was primarily due to the timing of income tax payments, as well as lower income from continuing operations. The increase in cash flows provided by operating activities in fiscal 2013, when compared to the previous fiscal year, was primarily due to higher income for continuing operations. Cash Equivalents and Working Capital Cash and cash equivalents were $7.3 billion and $7.8 billion at January 31, 2014 and 2013, respectively. Our working capital deficits were $8.2 billion and $11.9 billion at January 31, 2014 and 2013, respectively. The decrease in our working capital deficit was primarily attributable to a decrease in long-term debt due within one year and an increase in our inventory levels due to lower than anticipated sales across the Company. Timing differences also contributed to the decrease in our working capital