Download free for 30 days
Sign in
Upload
Language (EN)
Support
Business
Mobile
Social Media
Marketing
Technology
Art & Photos
Career
Design
Education
Presentations & Public Speaking
Government & Nonprofit
Healthcare
Internet
Law
Leadership & Management
Automotive
Engineering
Software
Recruiting & HR
Retail
Sales
Services
Science
Small Business & Entrepreneurship
Food
Environment
Economy & Finance
Data & Analytics
Investor Relations
Sports
Spiritual
News & Politics
Travel
Self Improvement
Real Estate
Entertainment & Humor
Health & Medicine
Devices & Hardware
Lifestyle
Change Language
Language
English
Español
Português
Français
Deutsche
Cancel
Save
Submit search
EN
Uploaded by
SrikantKapoor1
PPTX, PDF
11 views
Swink_MOAS_5e_Ch03S_AccessiblePPT_ms_Output.pptx
Supply chain & Operations
Business
◦
Read more
0
Save
Share
Embed
Embed presentation
Download
Download to read offline
1
/ 27
2
/ 27
3
/ 27
4
/ 27
5
/ 27
6
/ 27
7
/ 27
8
/ 27
9
/ 27
10
/ 27
11
/ 27
12
/ 27
13
/ 27
14
/ 27
15
/ 27
16
/ 27
17
/ 27
18
/ 27
19
/ 27
20
/ 27
21
/ 27
22
/ 27
23
/ 27
24
/ 27
25
/ 27
26
/ 27
27
/ 27
More Related Content
DOCX
Copyright © 2014 McGraw-Hill Higher Education. All rights .docx
by
vanesaburnand
PPT
15804959 for the sustainable practices.ppt
by
akkaderpro
PDF
Process mapping
by
Inga Tanaino-Mitenberga
PPTX
Business process mapping
by
DAVIS THOMAS
PPT
6 sigma-process-mapping-1233778357447980-3
by
jseets
KEY
smalBiz
by
clearskybusinessanalysis
KEY
Process Mapping and Process Improvement for the Small Business Owner
by
Michiko Diby
PPTX
Process Mapping
by
Driscoll Organizational Solutions, LLC
Copyright © 2014 McGraw-Hill Higher Education. All rights .docx
by
vanesaburnand
15804959 for the sustainable practices.ppt
by
akkaderpro
Process mapping
by
Inga Tanaino-Mitenberga
Business process mapping
by
DAVIS THOMAS
6 sigma-process-mapping-1233778357447980-3
by
jseets
smalBiz
by
clearskybusinessanalysis
Process Mapping and Process Improvement for the Small Business Owner
by
Michiko Diby
Process Mapping
by
Driscoll Organizational Solutions, LLC
Similar to Swink_MOAS_5e_Ch03S_AccessiblePPT_ms_Output.pptx
DOCX
Chapter 3Product DesignOperations Management in the.docx
by
DinahShipman862
PPT
Chap 3 - Process Design.ppt
by
SmartWorld13
PPTX
Process Maps
by
ljmcneill33
PPT
Bpr 05 Process Mapping Tools
by
msq2004
PDF
How Process Mapping Can Streamline Your Business Tips and Best Practices
by
Kashish Trivedi
PDF
Process Maturity Model by 3P Associates
by
Brian Pettit
PDF
Metrics-Based Process Mapping
by
TKMG, Inc.
PDF
Process Discovery Mapping
by
Charles White
PDF
Workflow Modeling Tools For Process Improvement And Application Development 2...
by
metkajakuro
PPTX
Power point operations management i (1)
by
ocagnen
PPT
090 Process Mapping
by
Dr Fereidoun Dejahang
PPT
ch02-Improvement Program.ppt
by
LuckySaigon1
PPTX
2011 business process management
by
Areté Partners
PDF
Metrics-Based Process Mapping
by
TKMG, Inc.
PDF
Process analysis
by
HelpWithAssignment.com
PPTX
process analysis presentation_modified_final.pptx
by
DrMarwaElsherif
PPTX
Copy of Colorful Pastel Illustrative Effective Study Presentation.pptx
by
aldwaynegarganera22
PDF
Controlling Financial Processes at a Municipality
by
Process mining Evangelist
PDF
Process improvement guide
by
Eng Marzouk
PPTX
Business process mapping
by
Niyati Mehta
Chapter 3Product DesignOperations Management in the.docx
by
DinahShipman862
Chap 3 - Process Design.ppt
by
SmartWorld13
Process Maps
by
ljmcneill33
Bpr 05 Process Mapping Tools
by
msq2004
How Process Mapping Can Streamline Your Business Tips and Best Practices
by
Kashish Trivedi
Process Maturity Model by 3P Associates
by
Brian Pettit
Metrics-Based Process Mapping
by
TKMG, Inc.
Process Discovery Mapping
by
Charles White
Workflow Modeling Tools For Process Improvement And Application Development 2...
by
metkajakuro
Power point operations management i (1)
by
ocagnen
090 Process Mapping
by
Dr Fereidoun Dejahang
ch02-Improvement Program.ppt
by
LuckySaigon1
2011 business process management
by
Areté Partners
Metrics-Based Process Mapping
by
TKMG, Inc.
Process analysis
by
HelpWithAssignment.com
process analysis presentation_modified_final.pptx
by
DrMarwaElsherif
Copy of Colorful Pastel Illustrative Effective Study Presentation.pptx
by
aldwaynegarganera22
Controlling Financial Processes at a Municipality
by
Process mining Evangelist
Process improvement guide
by
Eng Marzouk
Business process mapping
by
Niyati Mehta
More from SrikantKapoor1
PPTX
Frank_MB_2024_Release_PPT_Ch08_ACCESS(1).pptx
by
SrikantKapoor1
PPTX
Frank_MB_2024_Release_PPT_Ch06_ACCESS(1).pptx
by
SrikantKapoor1
PPTX
Kinicki_2024Release_PPT_Ch16_ACCESS.pptx11
by
SrikantKapoor1
PPTX
Chapter4.pptx management principles in action
by
SrikantKapoor1
PPTX
Chapter3(1).pptx management principles in action
by
SrikantKapoor1
PPTX
Chapter1.pptx Management principles in Action
by
SrikantKapoor1
PPTX
Chapter5.pptx Management Principles in Action
by
SrikantKapoor1
PPTX
Jaggia_BA_2e_Chap010_Accessible.pptx12345
by
SrikantKapoor1
PPTX
Bateman_M7e_PPT_Ch07_accessible.pptx12345
by
SrikantKapoor1
PPTX
Kinicki_2024Release_PPT_Ch12_ACCESS.pptx
by
SrikantKapoor1
PPTX
Kinicki_2024Release_PPT_Ch08_ACCESS.pptx
by
SrikantKapoor1
PPTX
Kinicki_2024Release_PPT_Ch05_ACCESS.pptx
by
SrikantKapoor1
PPTX
Kinicki_2024Release_PPT_LM1_ACCESS.pptx11
by
SrikantKapoor1
PPTX
Swink_MOAS_5e_Ch01_AccessiblePPT_ms_Output.pptx
by
SrikantKapoor1
PPTX
IBA_Chapter_12_Slides_Final_Accessible.pptx
by
SrikantKapoor1
PPTX
IBA_Chapter_11_Slides_Final_Accessible.pptx
by
SrikantKapoor1
PPTX
Module_01_Introduction_to_Higher_Education.pptx
by
SrikantKapoor1
PPTX
Module_02_Time_Management.pptx12345678910
by
SrikantKapoor1
PPTX
Ferrett_12e_Peak_Performance_Chapter_2_Accessible.pptx
by
SrikantKapoor1
PPTX
Ferrett_12e_Peak_Performance_Chapter_1_Accessible.pptx
by
SrikantKapoor1
Frank_MB_2024_Release_PPT_Ch08_ACCESS(1).pptx
by
SrikantKapoor1
Frank_MB_2024_Release_PPT_Ch06_ACCESS(1).pptx
by
SrikantKapoor1
Kinicki_2024Release_PPT_Ch16_ACCESS.pptx11
by
SrikantKapoor1
Chapter4.pptx management principles in action
by
SrikantKapoor1
Chapter3(1).pptx management principles in action
by
SrikantKapoor1
Chapter1.pptx Management principles in Action
by
SrikantKapoor1
Chapter5.pptx Management Principles in Action
by
SrikantKapoor1
Jaggia_BA_2e_Chap010_Accessible.pptx12345
by
SrikantKapoor1
Bateman_M7e_PPT_Ch07_accessible.pptx12345
by
SrikantKapoor1
Kinicki_2024Release_PPT_Ch12_ACCESS.pptx
by
SrikantKapoor1
Kinicki_2024Release_PPT_Ch08_ACCESS.pptx
by
SrikantKapoor1
Kinicki_2024Release_PPT_Ch05_ACCESS.pptx
by
SrikantKapoor1
Kinicki_2024Release_PPT_LM1_ACCESS.pptx11
by
SrikantKapoor1
Swink_MOAS_5e_Ch01_AccessiblePPT_ms_Output.pptx
by
SrikantKapoor1
IBA_Chapter_12_Slides_Final_Accessible.pptx
by
SrikantKapoor1
IBA_Chapter_11_Slides_Final_Accessible.pptx
by
SrikantKapoor1
Module_01_Introduction_to_Higher_Education.pptx
by
SrikantKapoor1
Module_02_Time_Management.pptx12345678910
by
SrikantKapoor1
Ferrett_12e_Peak_Performance_Chapter_2_Accessible.pptx
by
SrikantKapoor1
Ferrett_12e_Peak_Performance_Chapter_1_Accessible.pptx
by
SrikantKapoor1
Recently uploaded
PPTX
Project Management Tools for Faster, Smarter Execution
by
Blue Sky Index
PDF
J Hamilton - Pensions Playpen 16.12.2025 (1).pdf
by
Henry Tapper
PDF
How to Buy USA Facebook Accounts in 2026 .pdf
by
wc0fr9qf43i5qo5kn3
PDF
Where to Buy Verified Cash App Accounts for Long-term ... (1).pdf
by
h55oga0kd25m12iaza2
PDF
Mobile and Online Banking_ Open an Account Today.pdf
by
kmn4gloa39pwajpujj
PDF
The Easiest Way to Buy Snapchat Accounts (1).pdf
by
idc1w3adizw383go
PDF
How to Buy Twitter Accounts in 2026 .pdf
by
wc0fr9qf43i5qo5kn3
PDF
Step-by-Step Guide to Purchasing USA Facebook ....pdf
by
yl62ghphl9tyxn3q8lv5
PDF
How to Buy a USA Facebook Accounts Safely.pdf
by
yl62ghphl9tyxn3q8lv5
PDF
Co-operative and Mutual Economy 2025.pdf
by
Henry Tapper
PDF
Christopher Elwell Woburn, MA - An Experienced IT Executive
by
Christopher Elwell Woburn, MA
PDF
Buy Twitter Accounts and Platforms account in 2026.,..pdf
by
h3lfp4332e3gctbnm22w
PDF
Unlock the Power of Leadership: The Electrolux Manufacturing System (EMS) Way
by
KaiNexus
PDF
Step-by-Step Guide to Buying LinkedIn Accounts in 2026.pdf
by
asikurrhmanxyzit
PDF
Pengelolaan SDM Terintegrasi Berbasis Manajemen Risiko 2025
by
Seta Wicaksana
PDF
LCP-Pension-Submisson-CDC-Superfund-December-2025.pdf
by
Henry Tapper
PDF
Buy Verified PayPal Accounts Search Intent Analysis for 2025–26.pdf
by
Usaservicepoint
PDF
How to Buy Instagram Accounts in 2026.pdf
by
h55oga0kd25m12iaza2
PDF
Back to the future - the return of DB surpluses (slides) - 9 December 2025.pdf
by
Henry Tapper
PDF
Where to Buy Verified Chime Accounts for Quick ....pdf
by
kmn4gloa39pwajpujj
Project Management Tools for Faster, Smarter Execution
by
Blue Sky Index
J Hamilton - Pensions Playpen 16.12.2025 (1).pdf
by
Henry Tapper
How to Buy USA Facebook Accounts in 2026 .pdf
by
wc0fr9qf43i5qo5kn3
Where to Buy Verified Cash App Accounts for Long-term ... (1).pdf
by
h55oga0kd25m12iaza2
Mobile and Online Banking_ Open an Account Today.pdf
by
kmn4gloa39pwajpujj
The Easiest Way to Buy Snapchat Accounts (1).pdf
by
idc1w3adizw383go
How to Buy Twitter Accounts in 2026 .pdf
by
wc0fr9qf43i5qo5kn3
Step-by-Step Guide to Purchasing USA Facebook ....pdf
by
yl62ghphl9tyxn3q8lv5
How to Buy a USA Facebook Accounts Safely.pdf
by
yl62ghphl9tyxn3q8lv5
Co-operative and Mutual Economy 2025.pdf
by
Henry Tapper
Christopher Elwell Woburn, MA - An Experienced IT Executive
by
Christopher Elwell Woburn, MA
Buy Twitter Accounts and Platforms account in 2026.,..pdf
by
h3lfp4332e3gctbnm22w
Unlock the Power of Leadership: The Electrolux Manufacturing System (EMS) Way
by
KaiNexus
Step-by-Step Guide to Buying LinkedIn Accounts in 2026.pdf
by
asikurrhmanxyzit
Pengelolaan SDM Terintegrasi Berbasis Manajemen Risiko 2025
by
Seta Wicaksana
LCP-Pension-Submisson-CDC-Superfund-December-2025.pdf
by
Henry Tapper
Buy Verified PayPal Accounts Search Intent Analysis for 2025–26.pdf
by
Usaservicepoint
How to Buy Instagram Accounts in 2026.pdf
by
h55oga0kd25m12iaza2
Back to the future - the return of DB surpluses (slides) - 9 December 2025.pdf
by
Henry Tapper
Where to Buy Verified Chime Accounts for Quick ....pdf
by
kmn4gloa39pwajpujj
Swink_MOAS_5e_Ch03S_AccessiblePPT_ms_Output.pptx
1.
Because learning changes
everything.® Chapter 3 - Supplement Process Mapping and Analysis © McGraw Hill LLC. All rights reserved. No reproduction or distribution without the prior written consent of McGraw Hill
2.
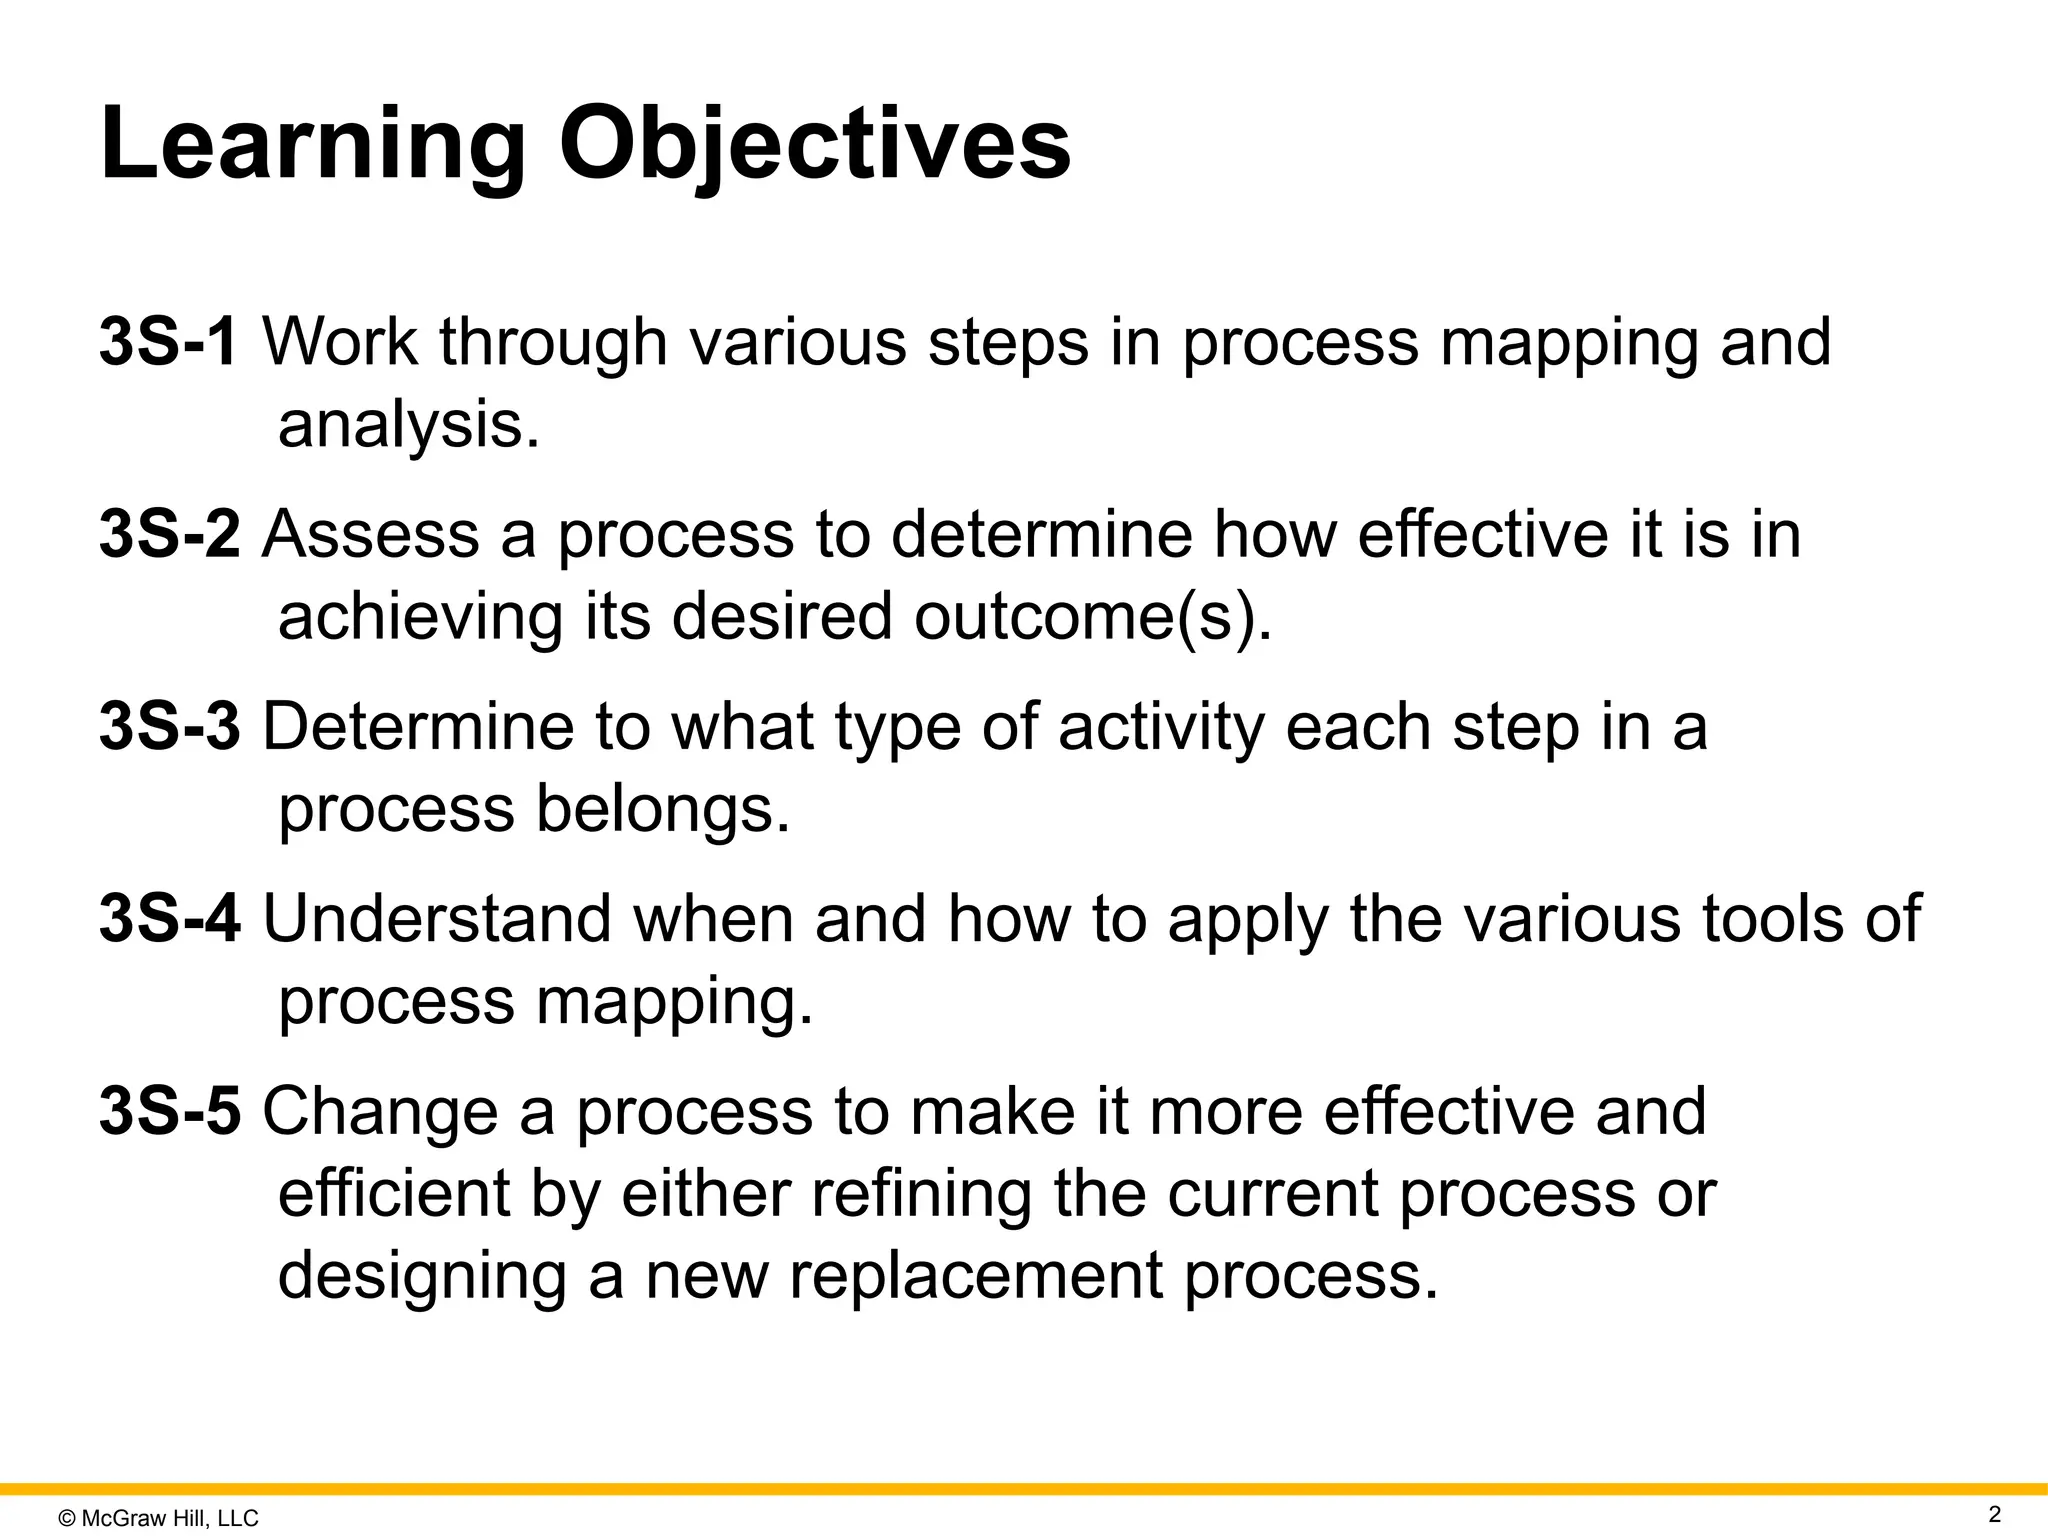
© McGraw Hill,
LLC 2 Learning Objectives 3S-1 Work through various steps in process mapping and analysis. 3S-2 Assess a process to determine how effective it is in achieving its desired outcome(s). 3S-3 Determine to what type of activity each step in a process belongs. 3S-4 Understand when and how to apply the various tools of process mapping. 3S-5 Change a process to make it more effective and efficient by either refining the current process or designing a new replacement process.
3.
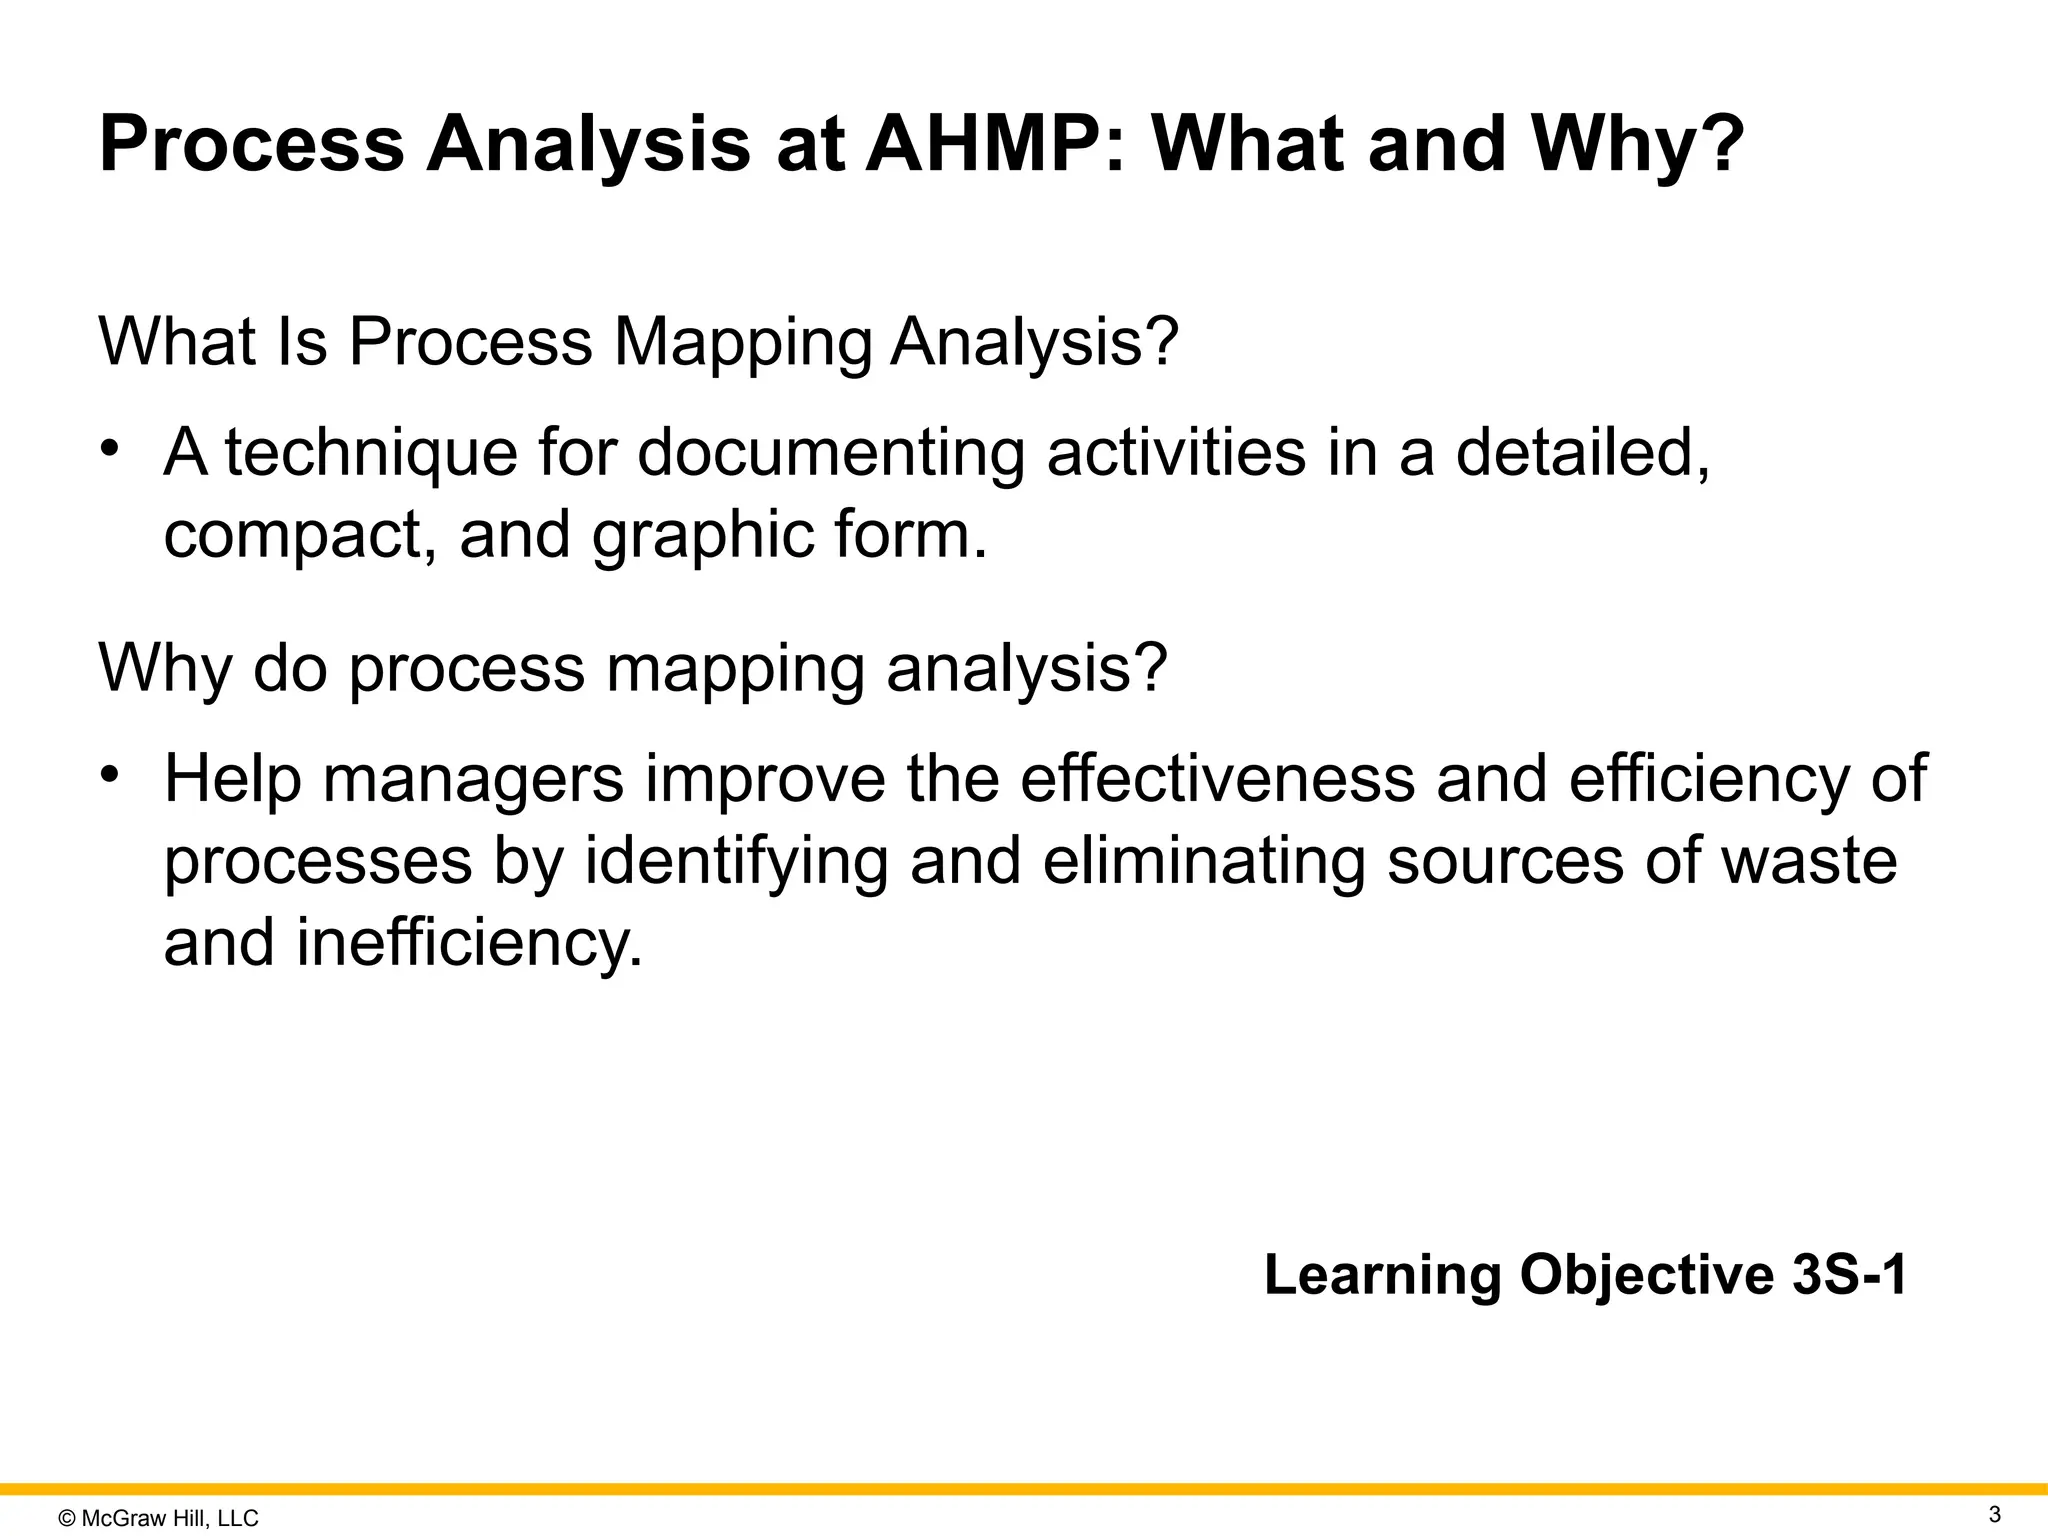
© McGraw Hill,
LLC 3 Process Analysis at AHMP: What and Why? What Is Process Mapping Analysis? • A technique for documenting activities in a detailed, compact, and graphic form. Why do process mapping analysis? • Help managers improve the effectiveness and efficiency of processes by identifying and eliminating sources of waste and inefficiency. Learning Objective 3S-1
4.
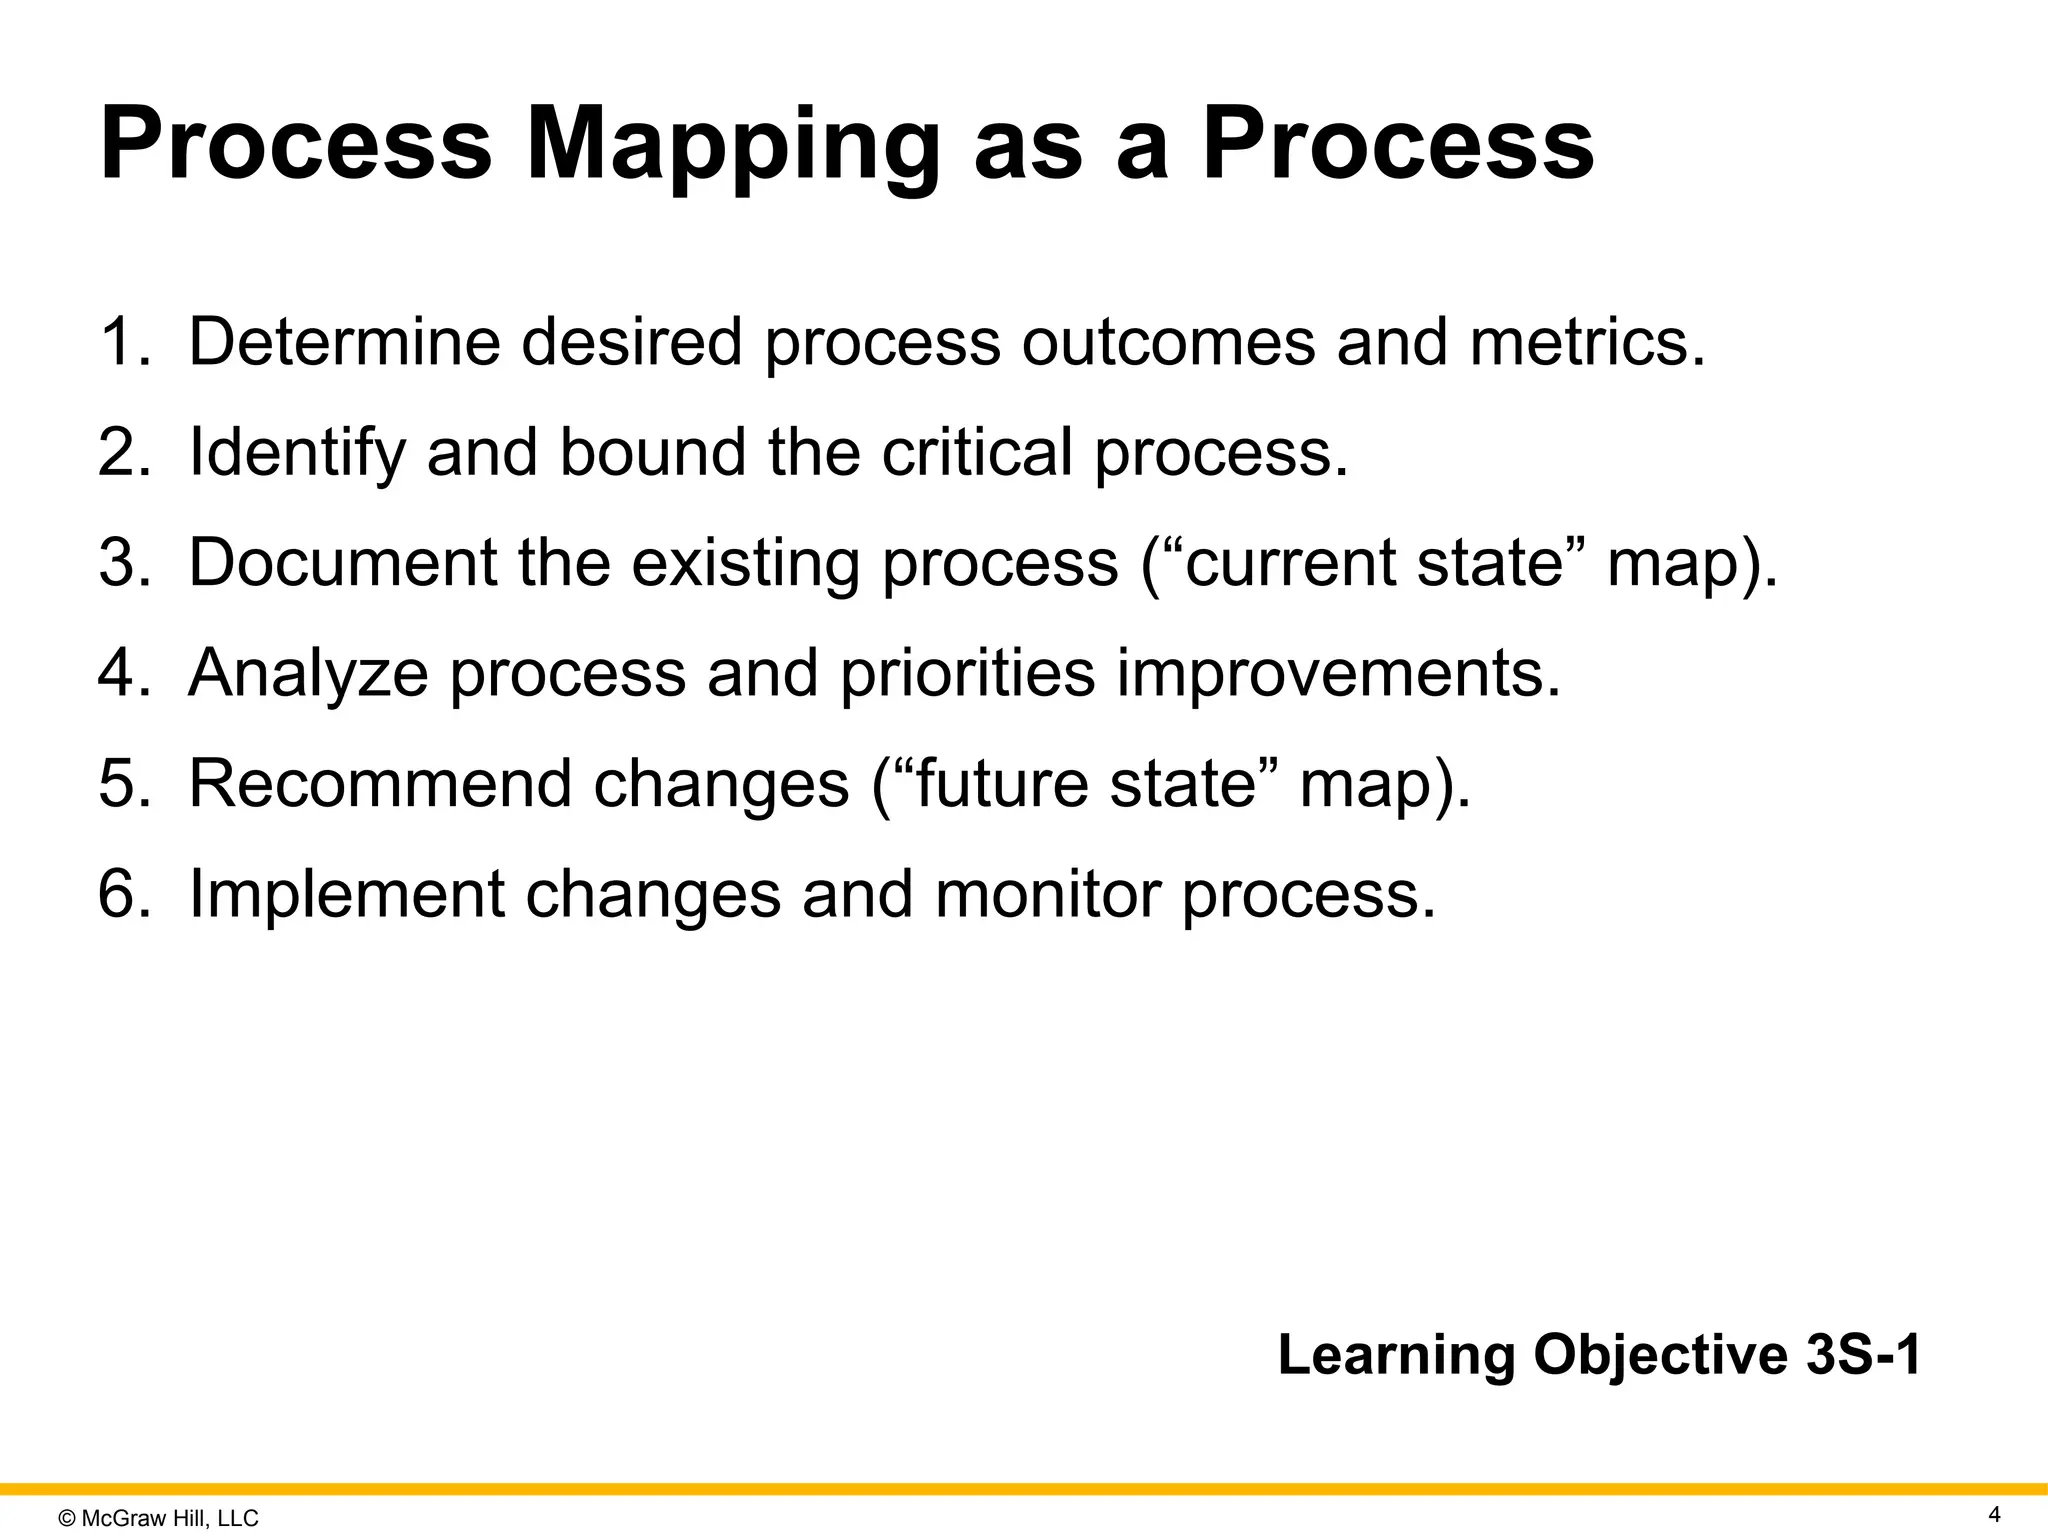
© McGraw Hill,
LLC 4 Process Mapping as a Process 1. Determine desired process outcomes and metrics. 2. Identify and bound the critical process. 3. Document the existing process (“current state” map). 4. Analyze process and priorities improvements. 5. Recommend changes (“future state” map). 6. Implement changes and monitor process. Learning Objective 3S-1
5.
© McGraw Hill,
LLC 5 Step 1: Determine Desired Outcomes What should the process achieve? • Reduced cost. • Shorter lead time. • Improved quality. • Availability/reliable deliveries. Learning Objective 3S-2
6.
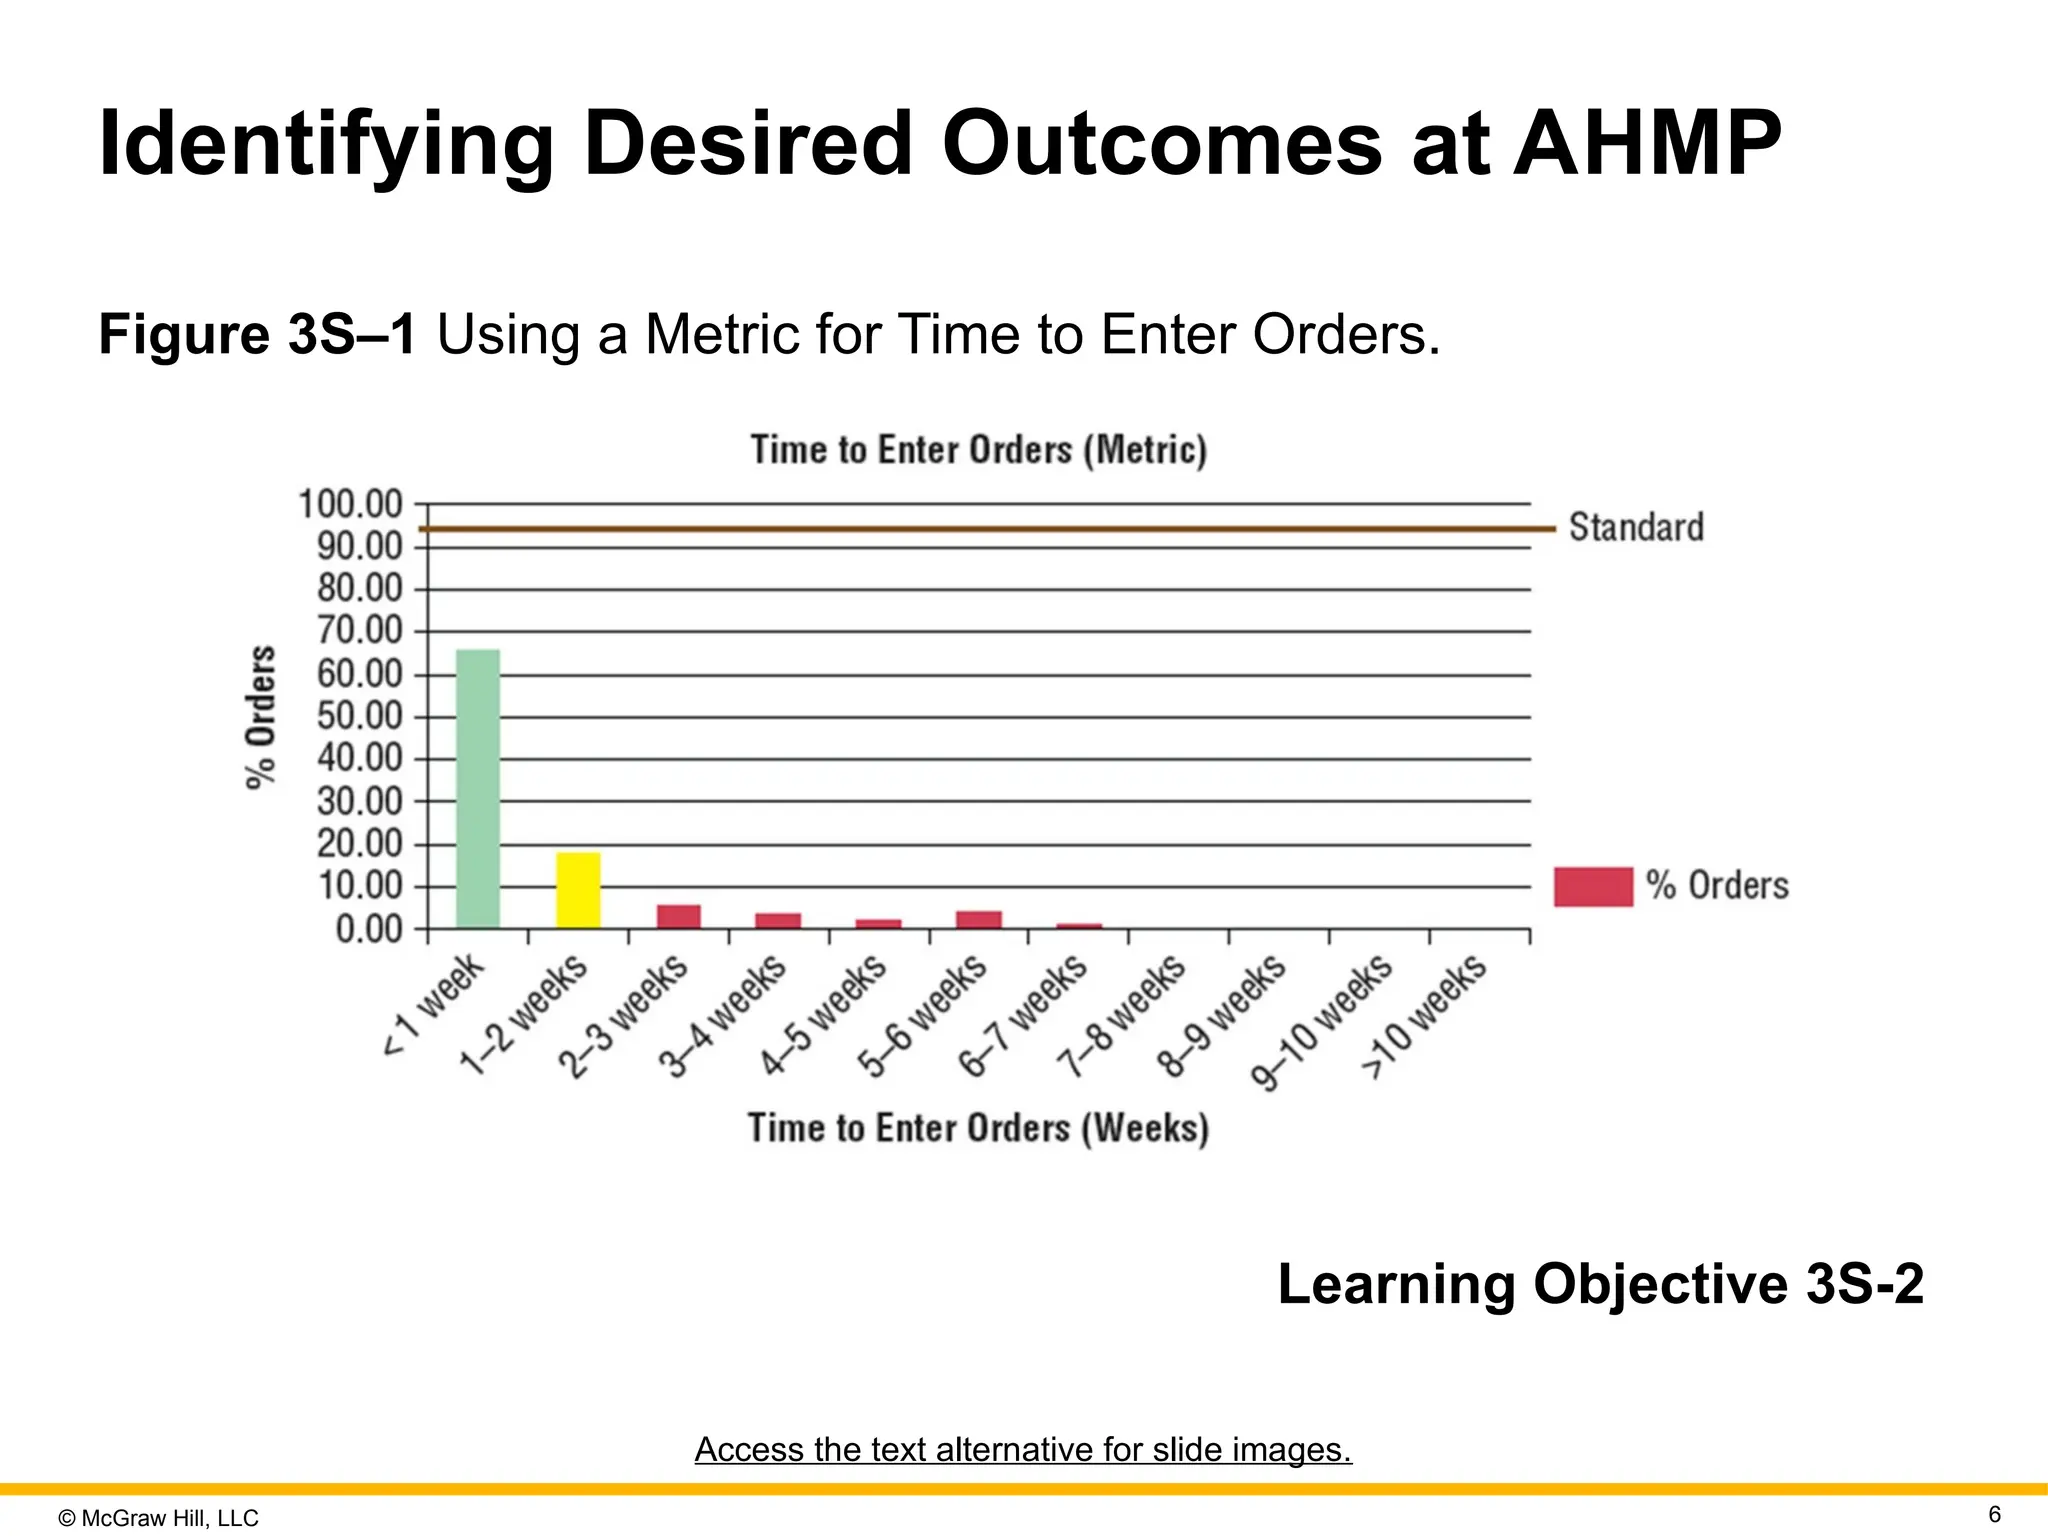
© McGraw Hill,
LLC 6 Identifying Desired Outcomes at AHMP Figure 3S–1 Using a Metric for Time to Enter Orders. Learning Objective 3S-2 Access the text alternative for slide images.
7.
© McGraw Hill,
LLC 7 Step 2: Identify and Set Bounds on Critical Process Critical processes typically are one of the following: 1. A bottleneck. 2. Visible to the customer. 3. Consumes largest amounts of resources. 4. A shared process. 5. Highest level of variance. 6. A unique skill or core competency. Discussion question: What are the risks of bounding the process too narrowly? Too broadly? Learning Objective 3S-2
8.
© McGraw Hill,
LLC 8 Step 3: “Current State” Map 1 • Current State: the “as is” of the processes. • A process map is a diagram of the process activities. • Identify minimum acceptable level of detail on map. • Use different process mapping and analysis techniques. • Watch for “hidden” steps. • Capture relevant data. Learning Objective 3S-3
9.
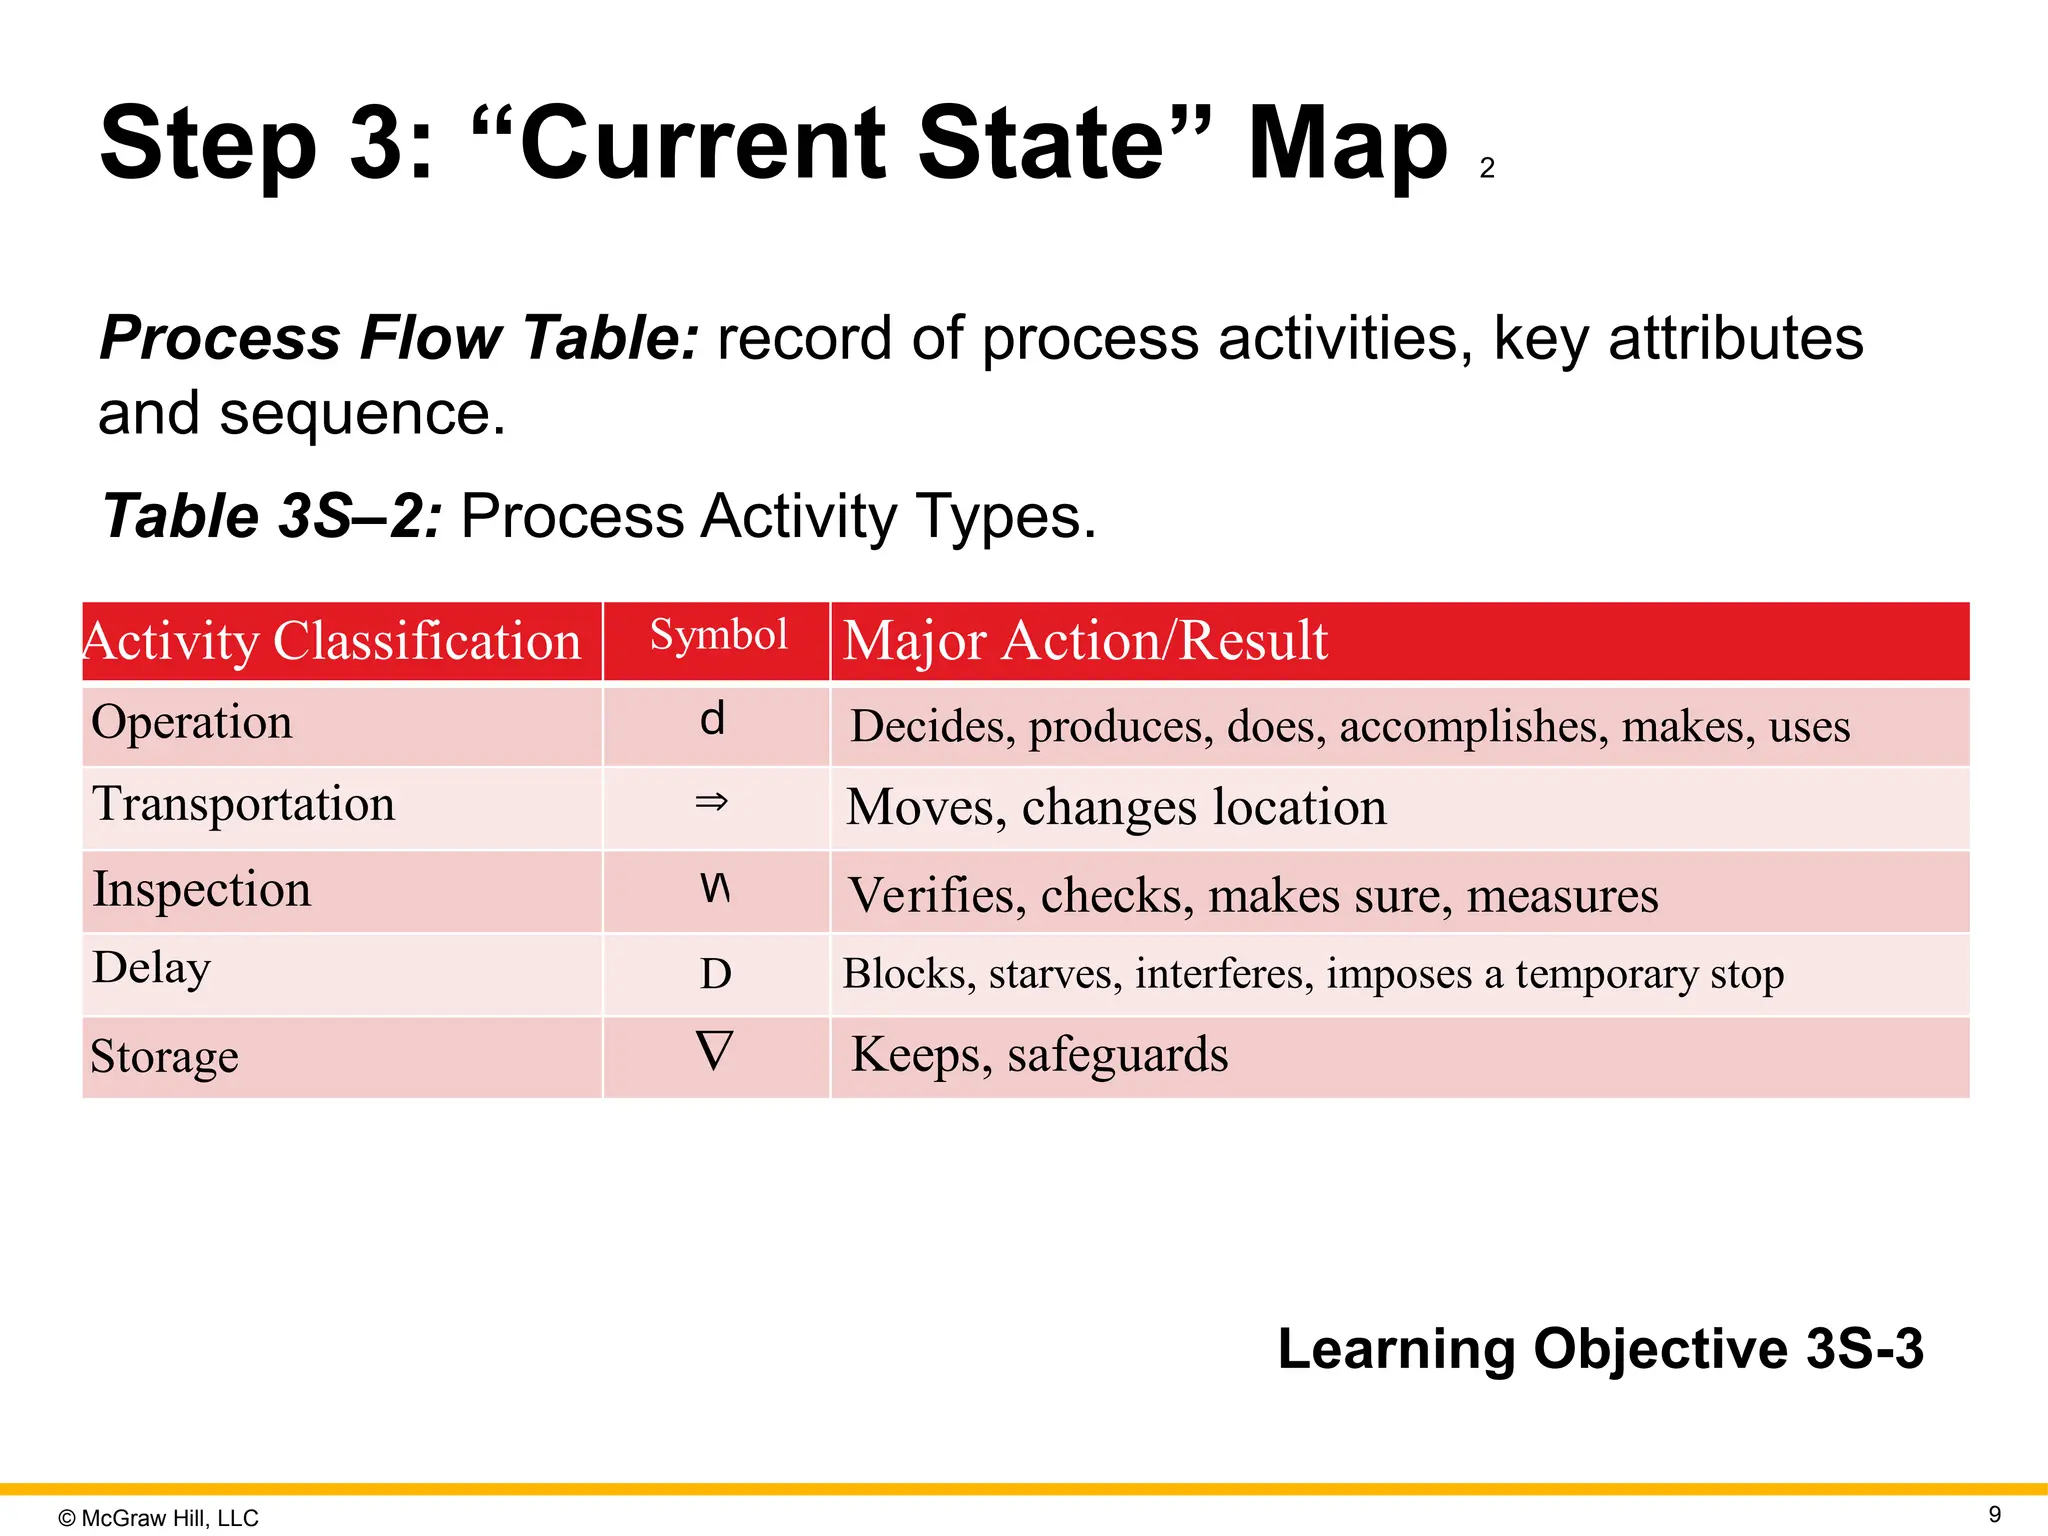
© McGraw Hill,
LLC 9 Step 3: “Current State” Map 2 Process Flow Table: record of process activities, key attributes and sequence. Table 3S–2: Process Activity Types. Activity Classification Symbol Major Action/Result Operation d Decides, produces, does, accomplishes, makes, uses Transportation Moves, changes location Inspection W Verifies, checks, makes sure, measures Delay D Blocks, starves, interferes, imposes a temporary stop Storage Keeps, safeguards Learning Objective 3S-3
10.
© McGraw Hill,
LLC 10 Student Activity 1 “Staple Yourself to an Order.” Pick a process and become the order within it. What steps were involved? How long did it take for the process to complete operations? What did you learn? What surprises did you uncover? Learning Objective 3S-3
11.
© McGraw Hill,
LLC 11 Three Basic Charting and Analysis Tools for Meaningful Process Mapping 1. Process flow table. 2. Physical layout diagram. 3. Process summary table.
12.
© McGraw Hill,
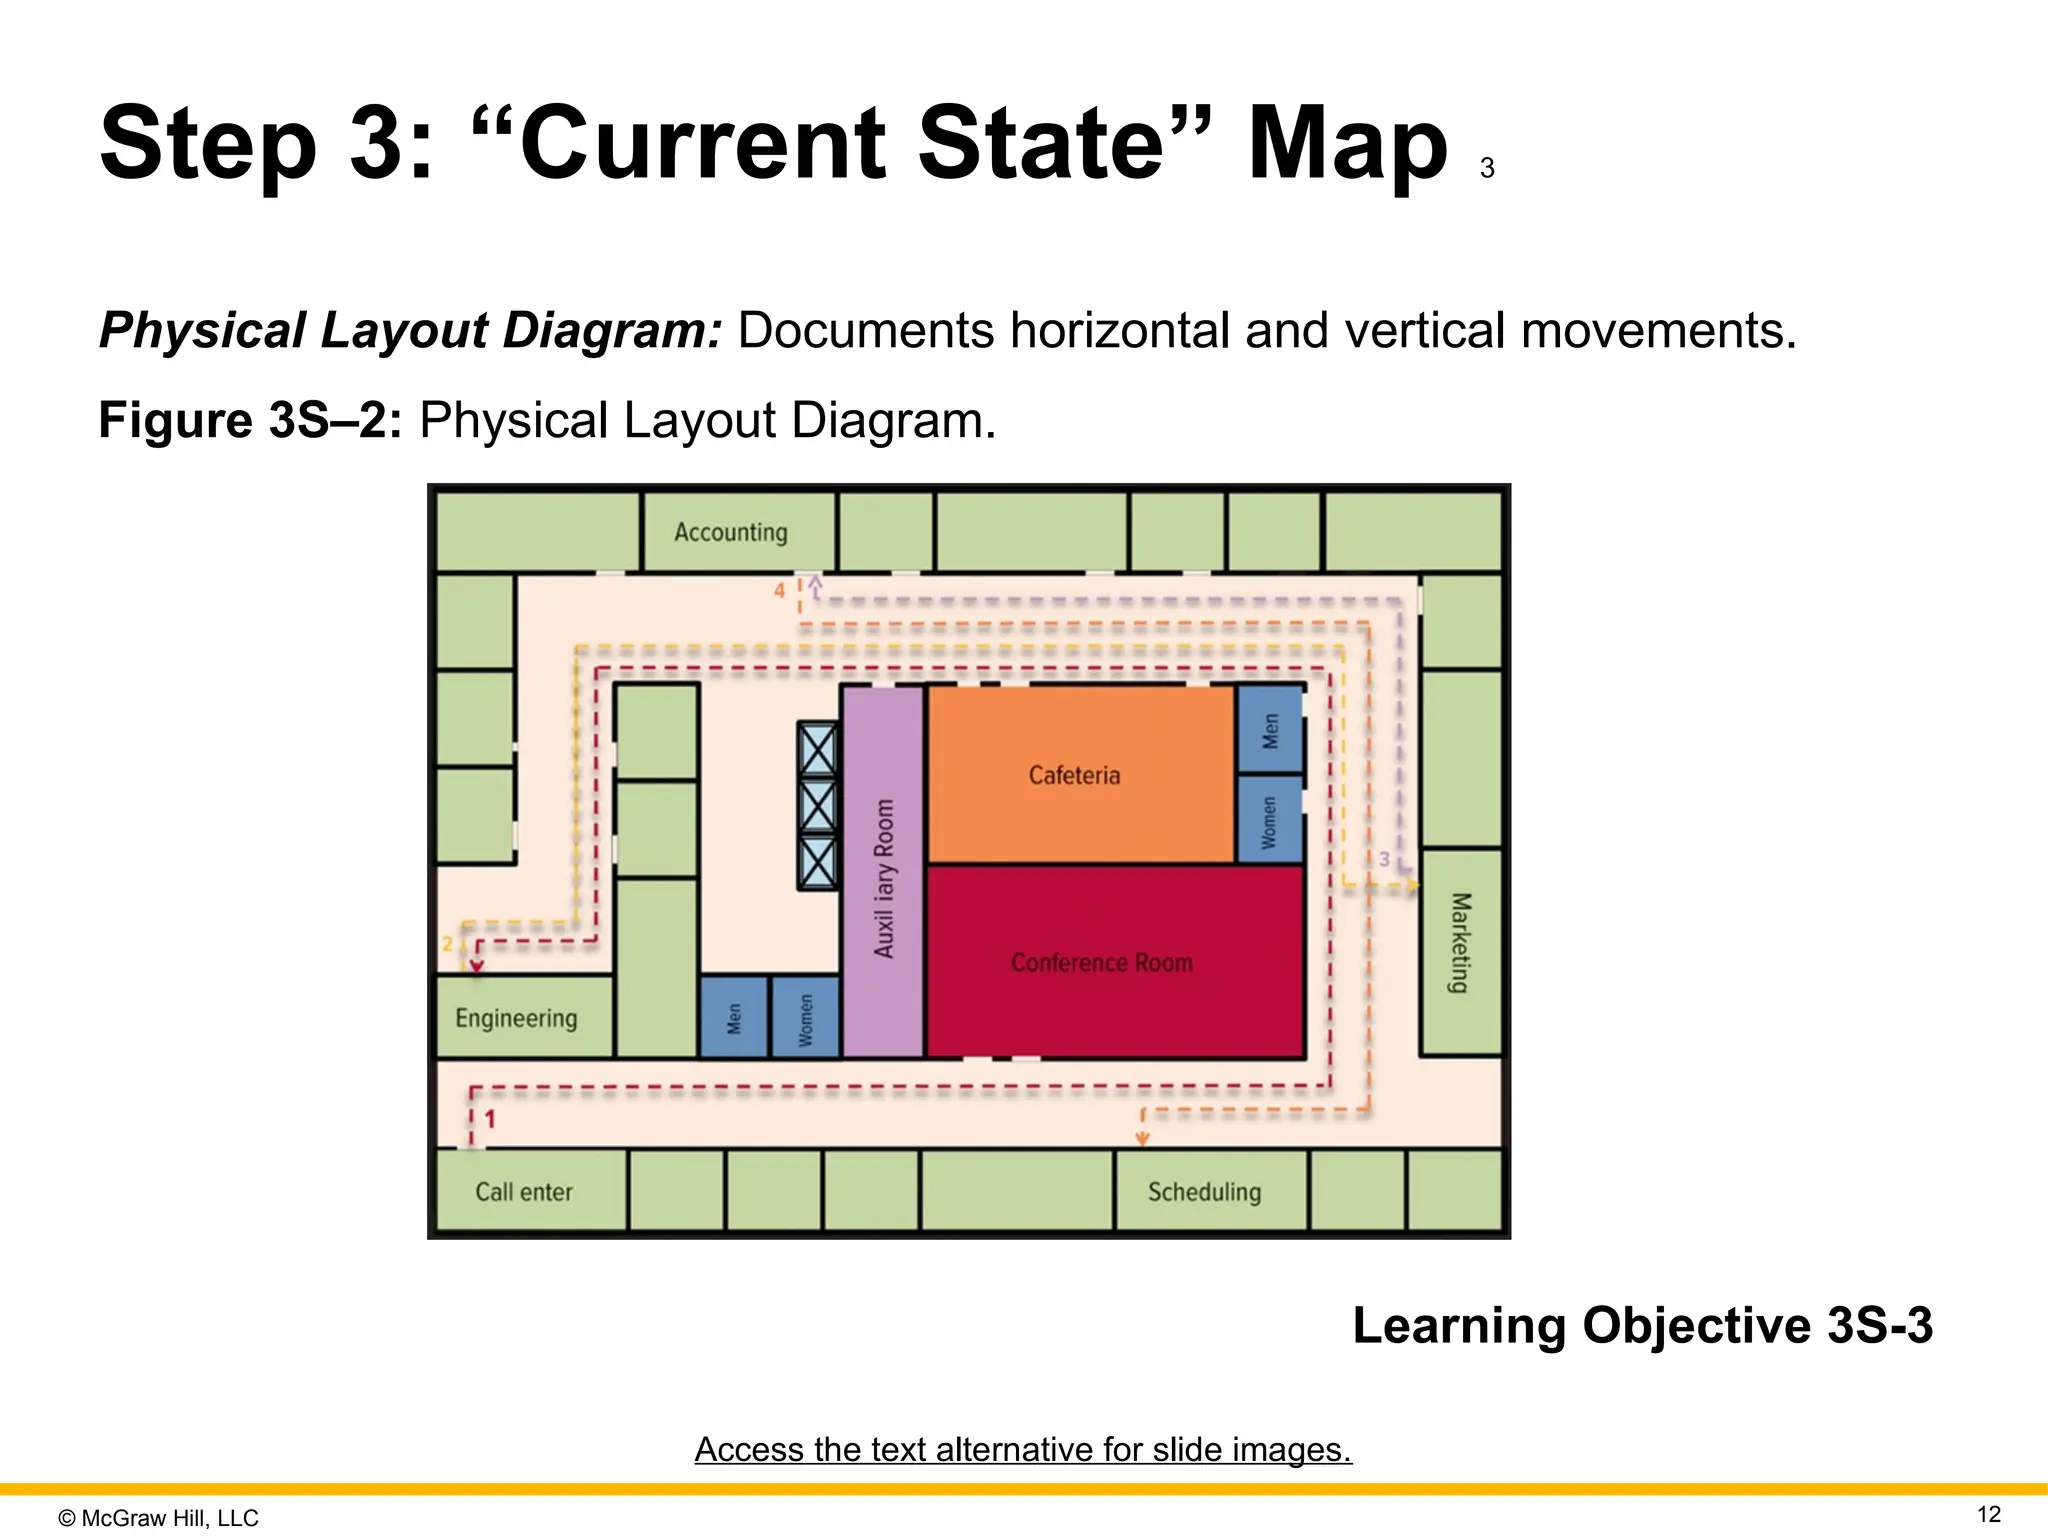
LLC 12 Step 3: “Current State” Map 3 Physical Layout Diagram: Documents horizontal and vertical movements. Figure 3S–2: Physical Layout Diagram. Learning Objective 3S-3 Access the text alternative for slide images.
13.
© McGraw Hill,
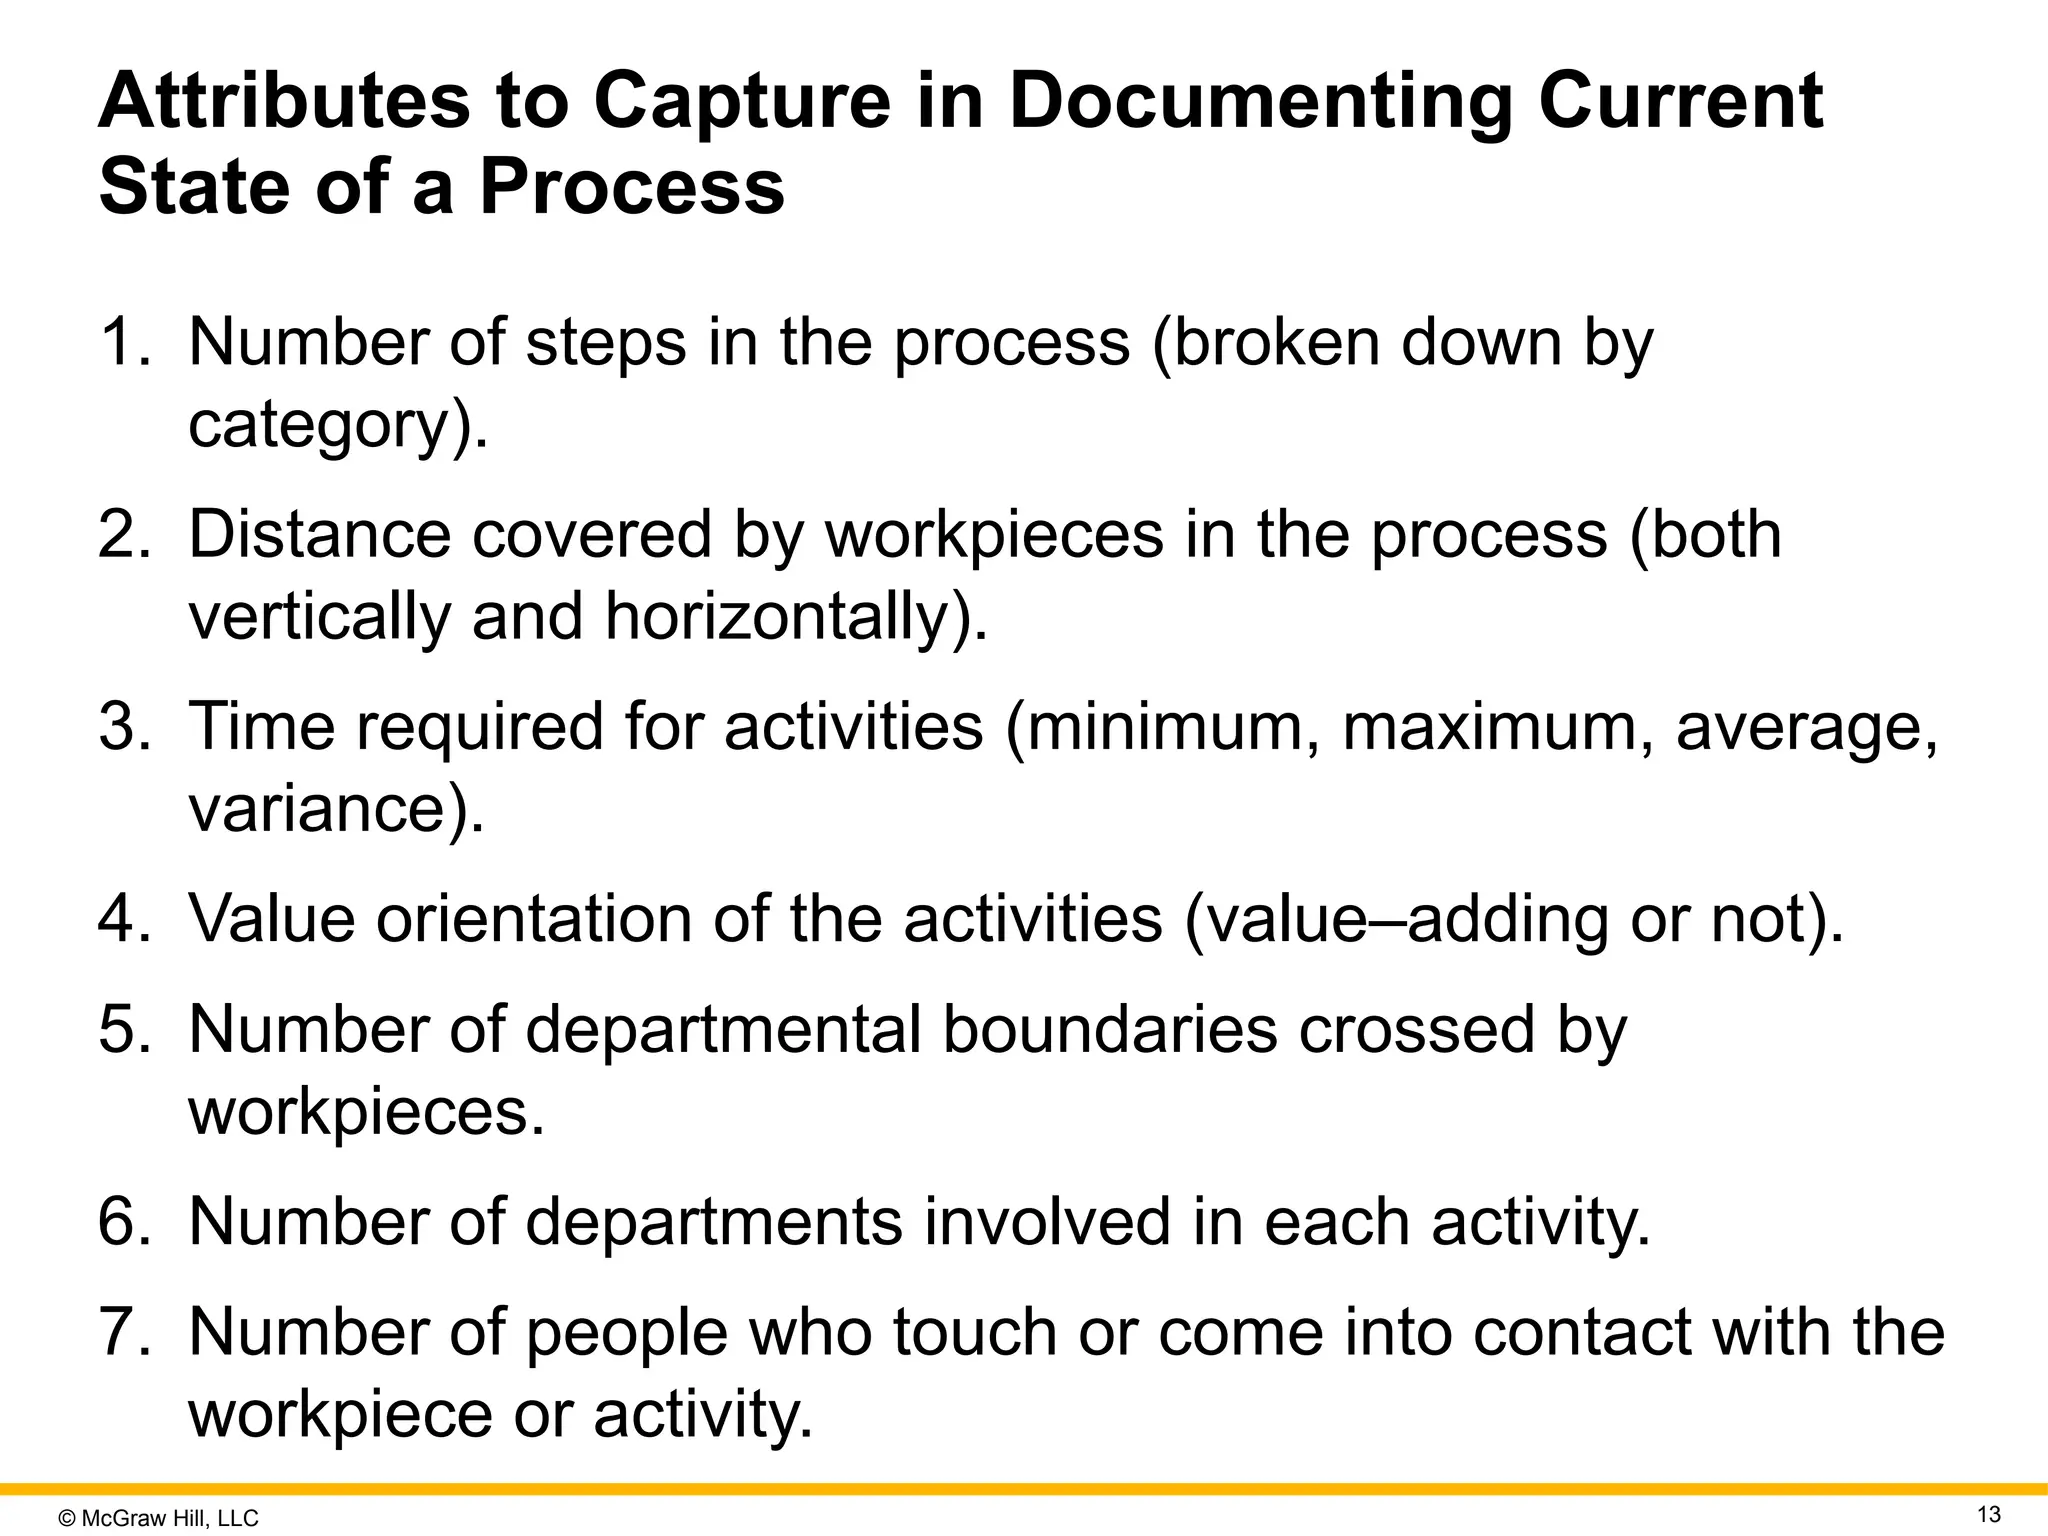
LLC 13 Attributes to Capture in Documenting Current State of a Process 1. Number of steps in the process (broken down by category). 2. Distance covered by workpieces in the process (both vertically and horizontally). 3. Time required for activities (minimum, maximum, average, variance). 4. Value orientation of the activities (value–adding or not). 5. Number of departmental boundaries crossed by workpieces. 6. Number of departments involved in each activity. 7. Number of people who touch or come into contact with the workpiece or activity.
14.
© McGraw Hill,
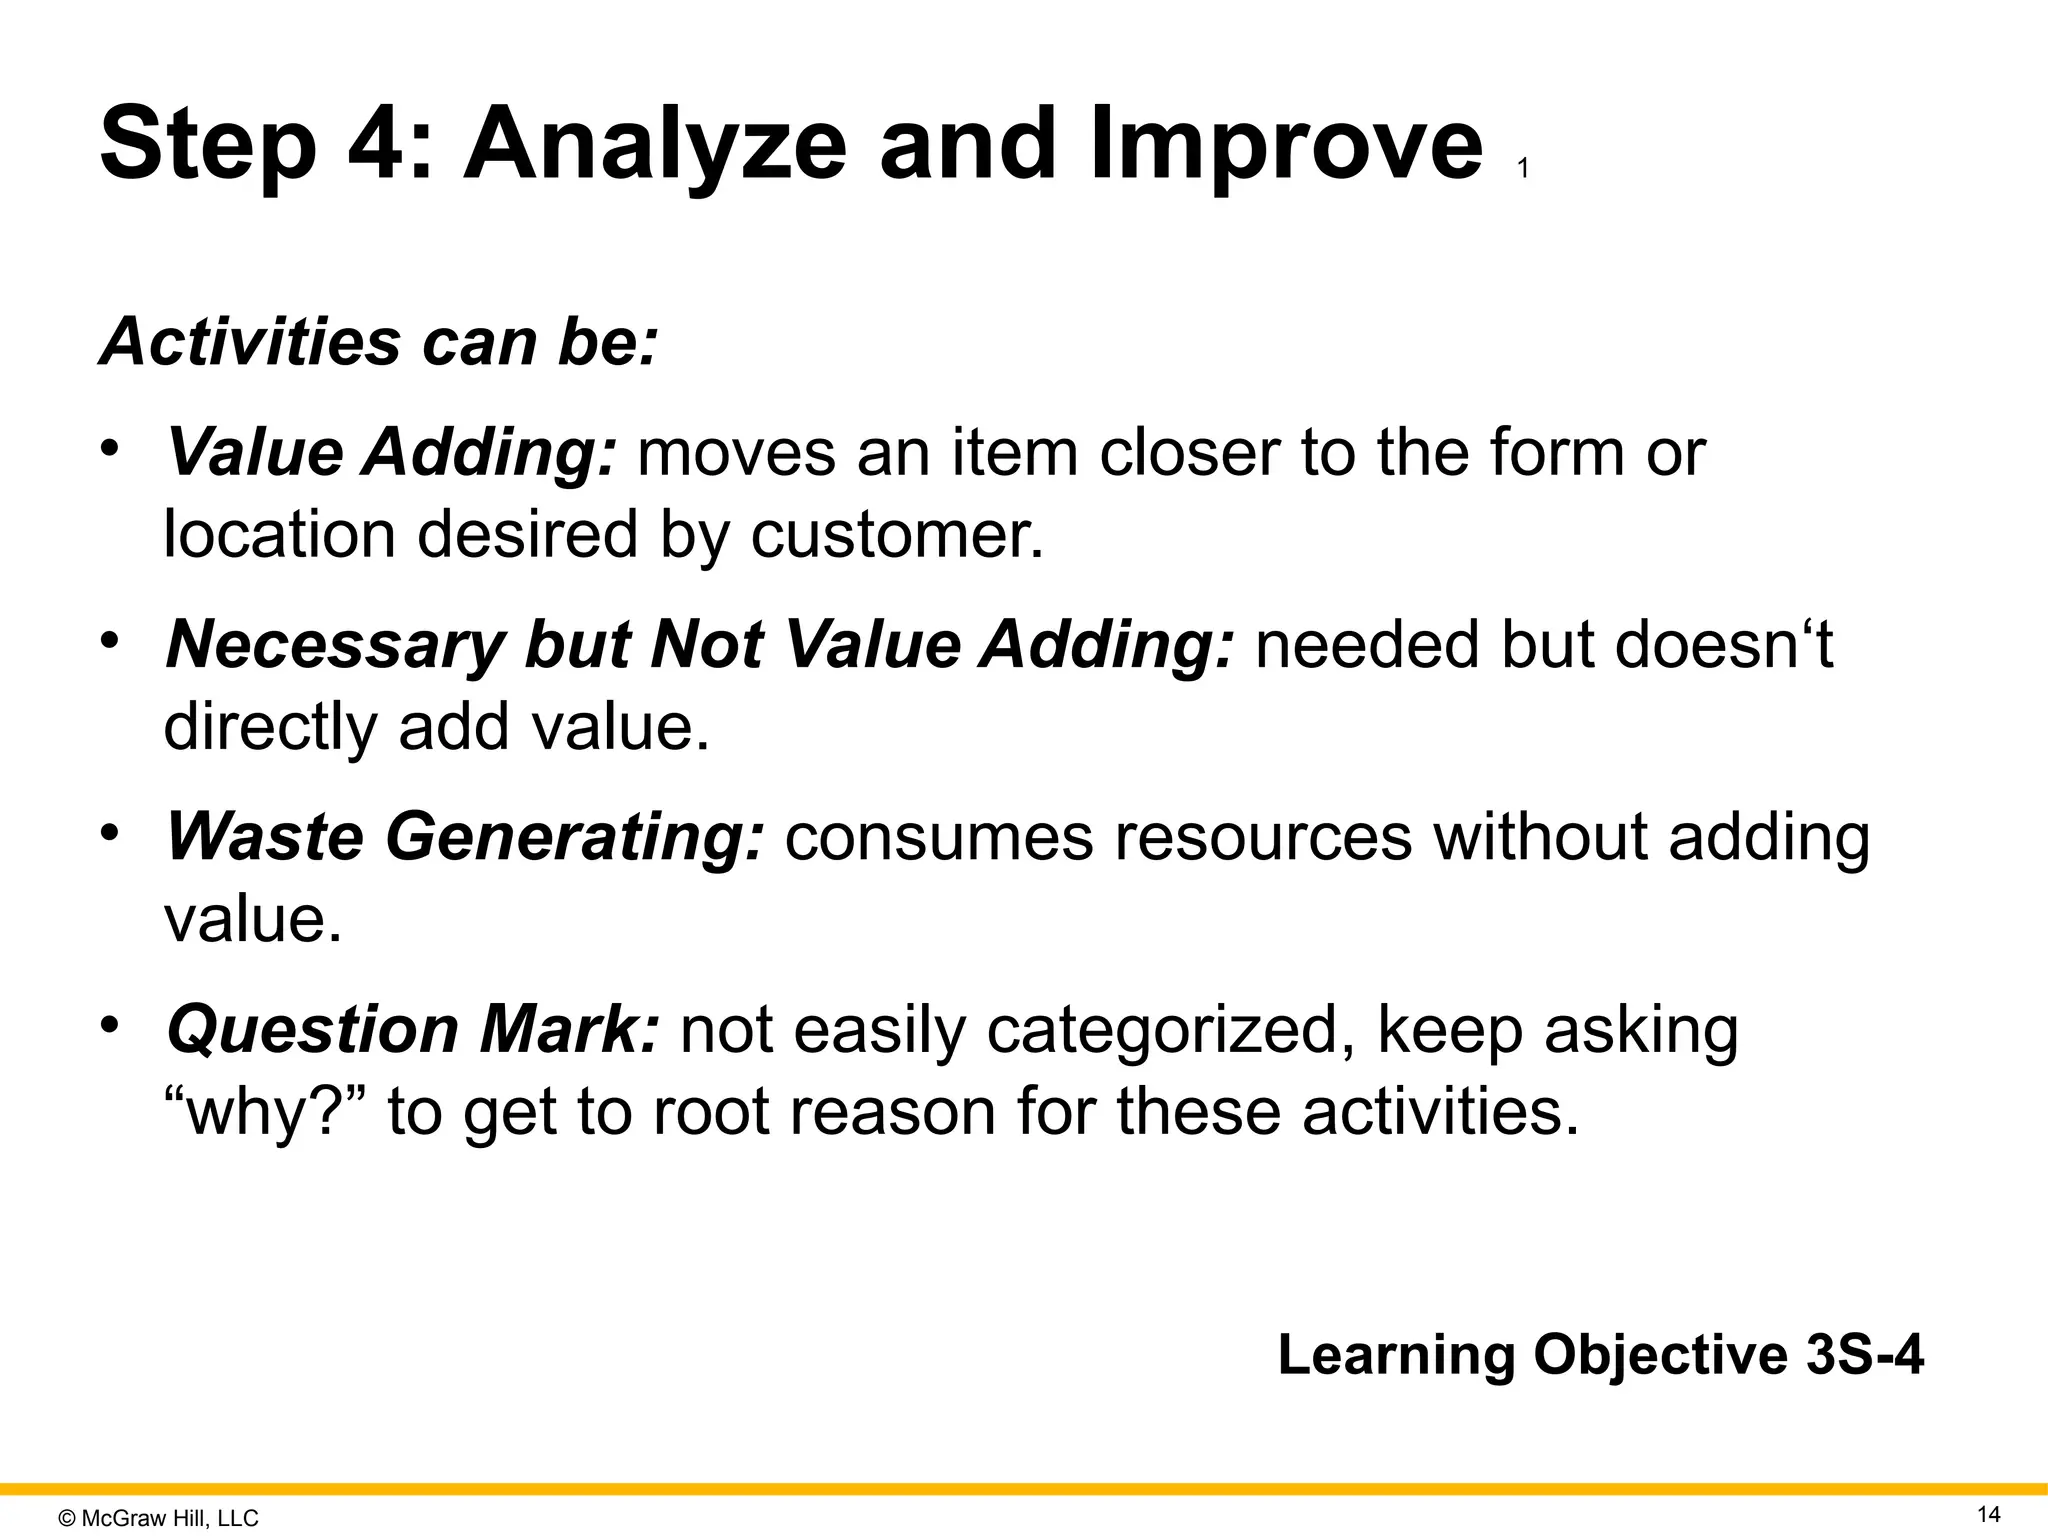
LLC 14 Step 4: Analyze and Improve 1 Activities can be: • Value Adding: moves an item closer to the form or location desired by customer. • Necessary but Not Value Adding: needed but doesn‘t directly add value. • Waste Generating: consumes resources without adding value. • Question Mark: not easily categorized, keep asking “why?” to get to root reason for these activities. Learning Objective 3S-4
15.
© McGraw Hill,
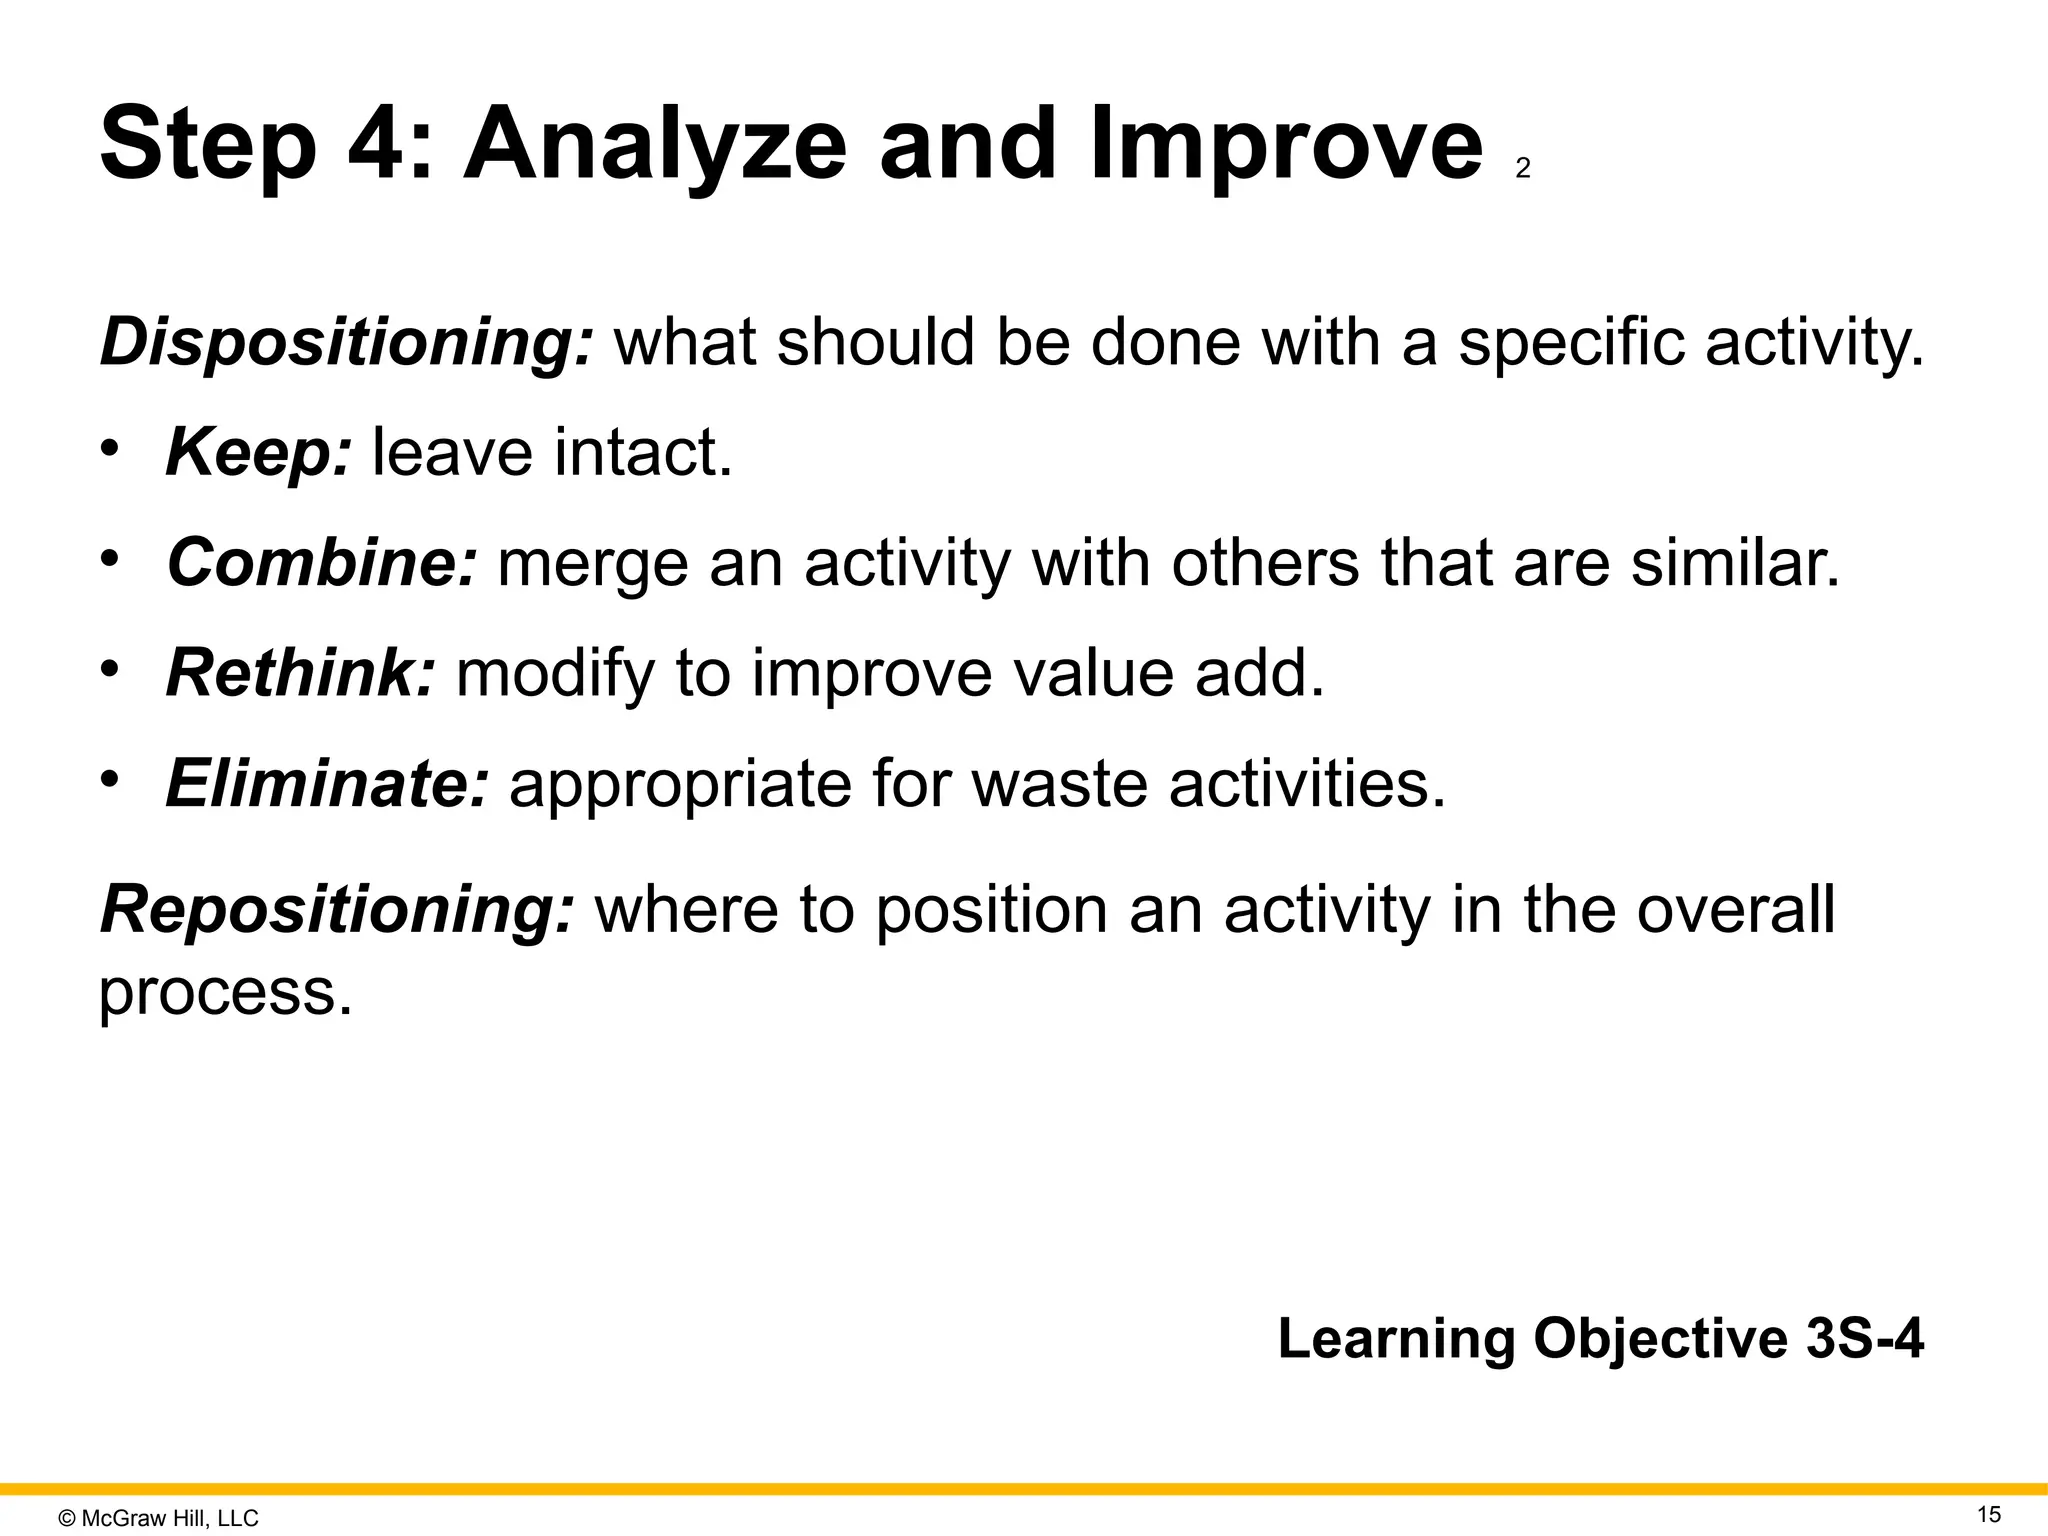
LLC 15 Step 4: Analyze and Improve 2 Dispositioning: what should be done with a specific activity. • Keep: leave intact. • Combine: merge an activity with others that are similar. • Rethink: modify to improve value add. • Eliminate: appropriate for waste activities. Repositioning: where to position an activity in the overall process. Learning Objective 3S-4
16.
© McGraw Hill,
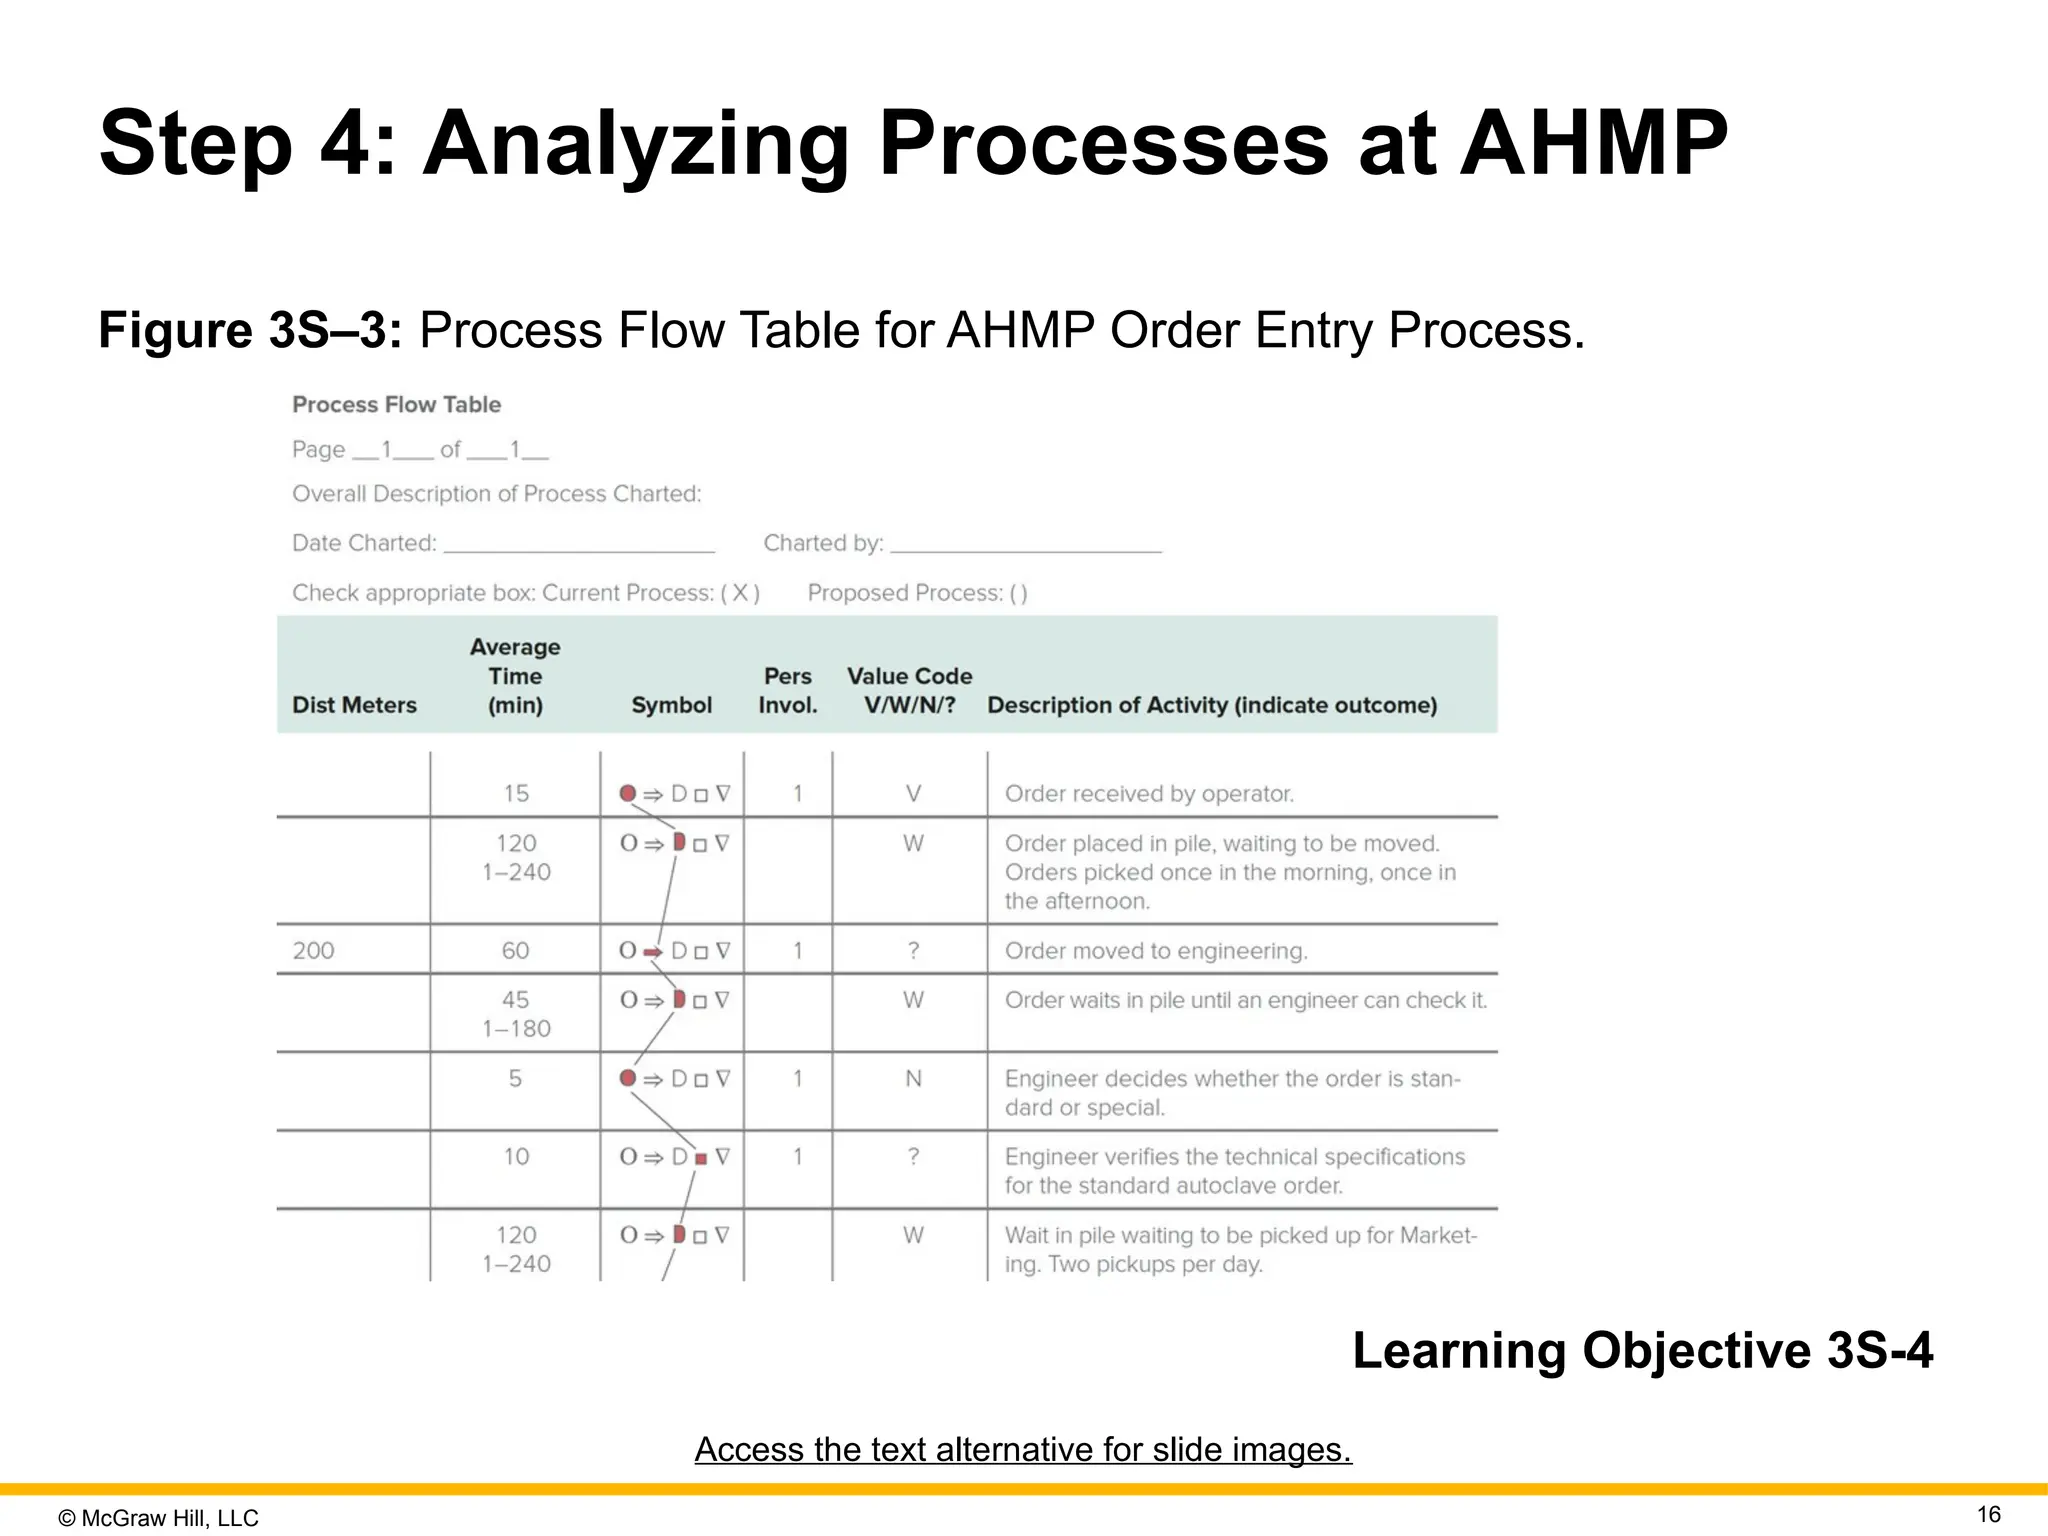
LLC 16 Step 4: Analyzing Processes at AHMP Figure 3S–3: Process Flow Table for AHMP Order Entry Process. Learning Objective 3S-4 Access the text alternative for slide images.
17.
© McGraw Hill,
LLC 17 Step 5: “Future State” Map Prioritize identified process improvements: 1. Make change immediately. 2. Postpone change pending resources. 3. Determine if change is not desirable or feasible. Learning Objective 3S-5
18.
© McGraw Hill,
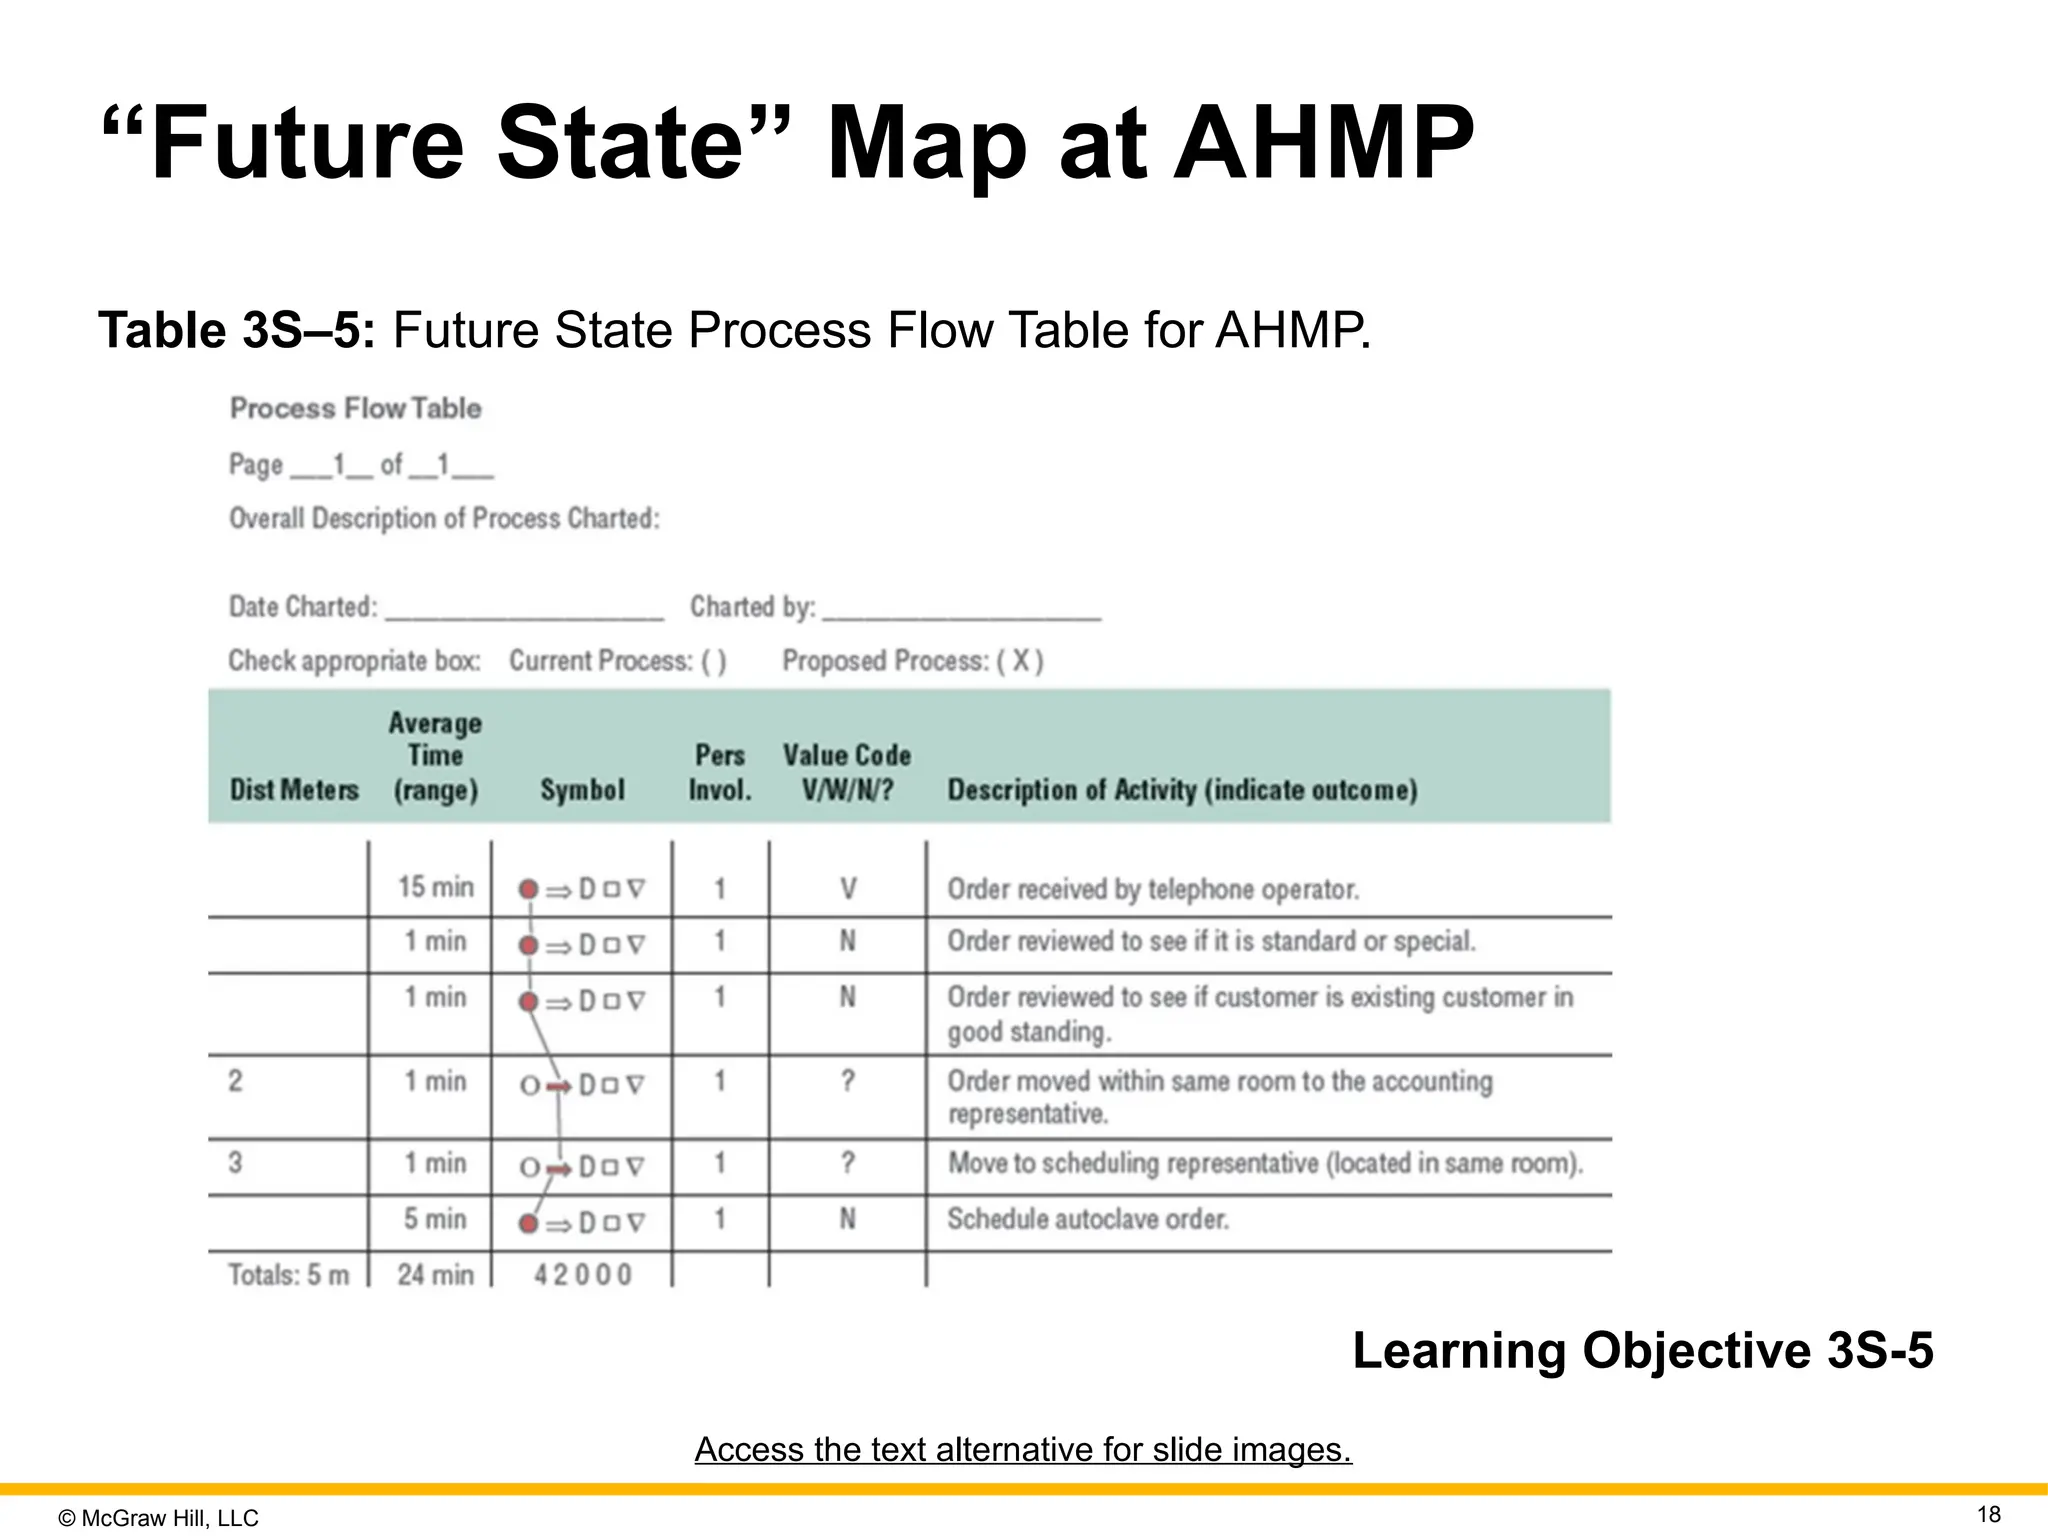
LLC 18 “Future State” Map at AHMP Table 3S–5: Future State Process Flow Table for AHMP. Learning Objective 3S-5 Access the text alternative for slide images.
19.
© McGraw Hill,
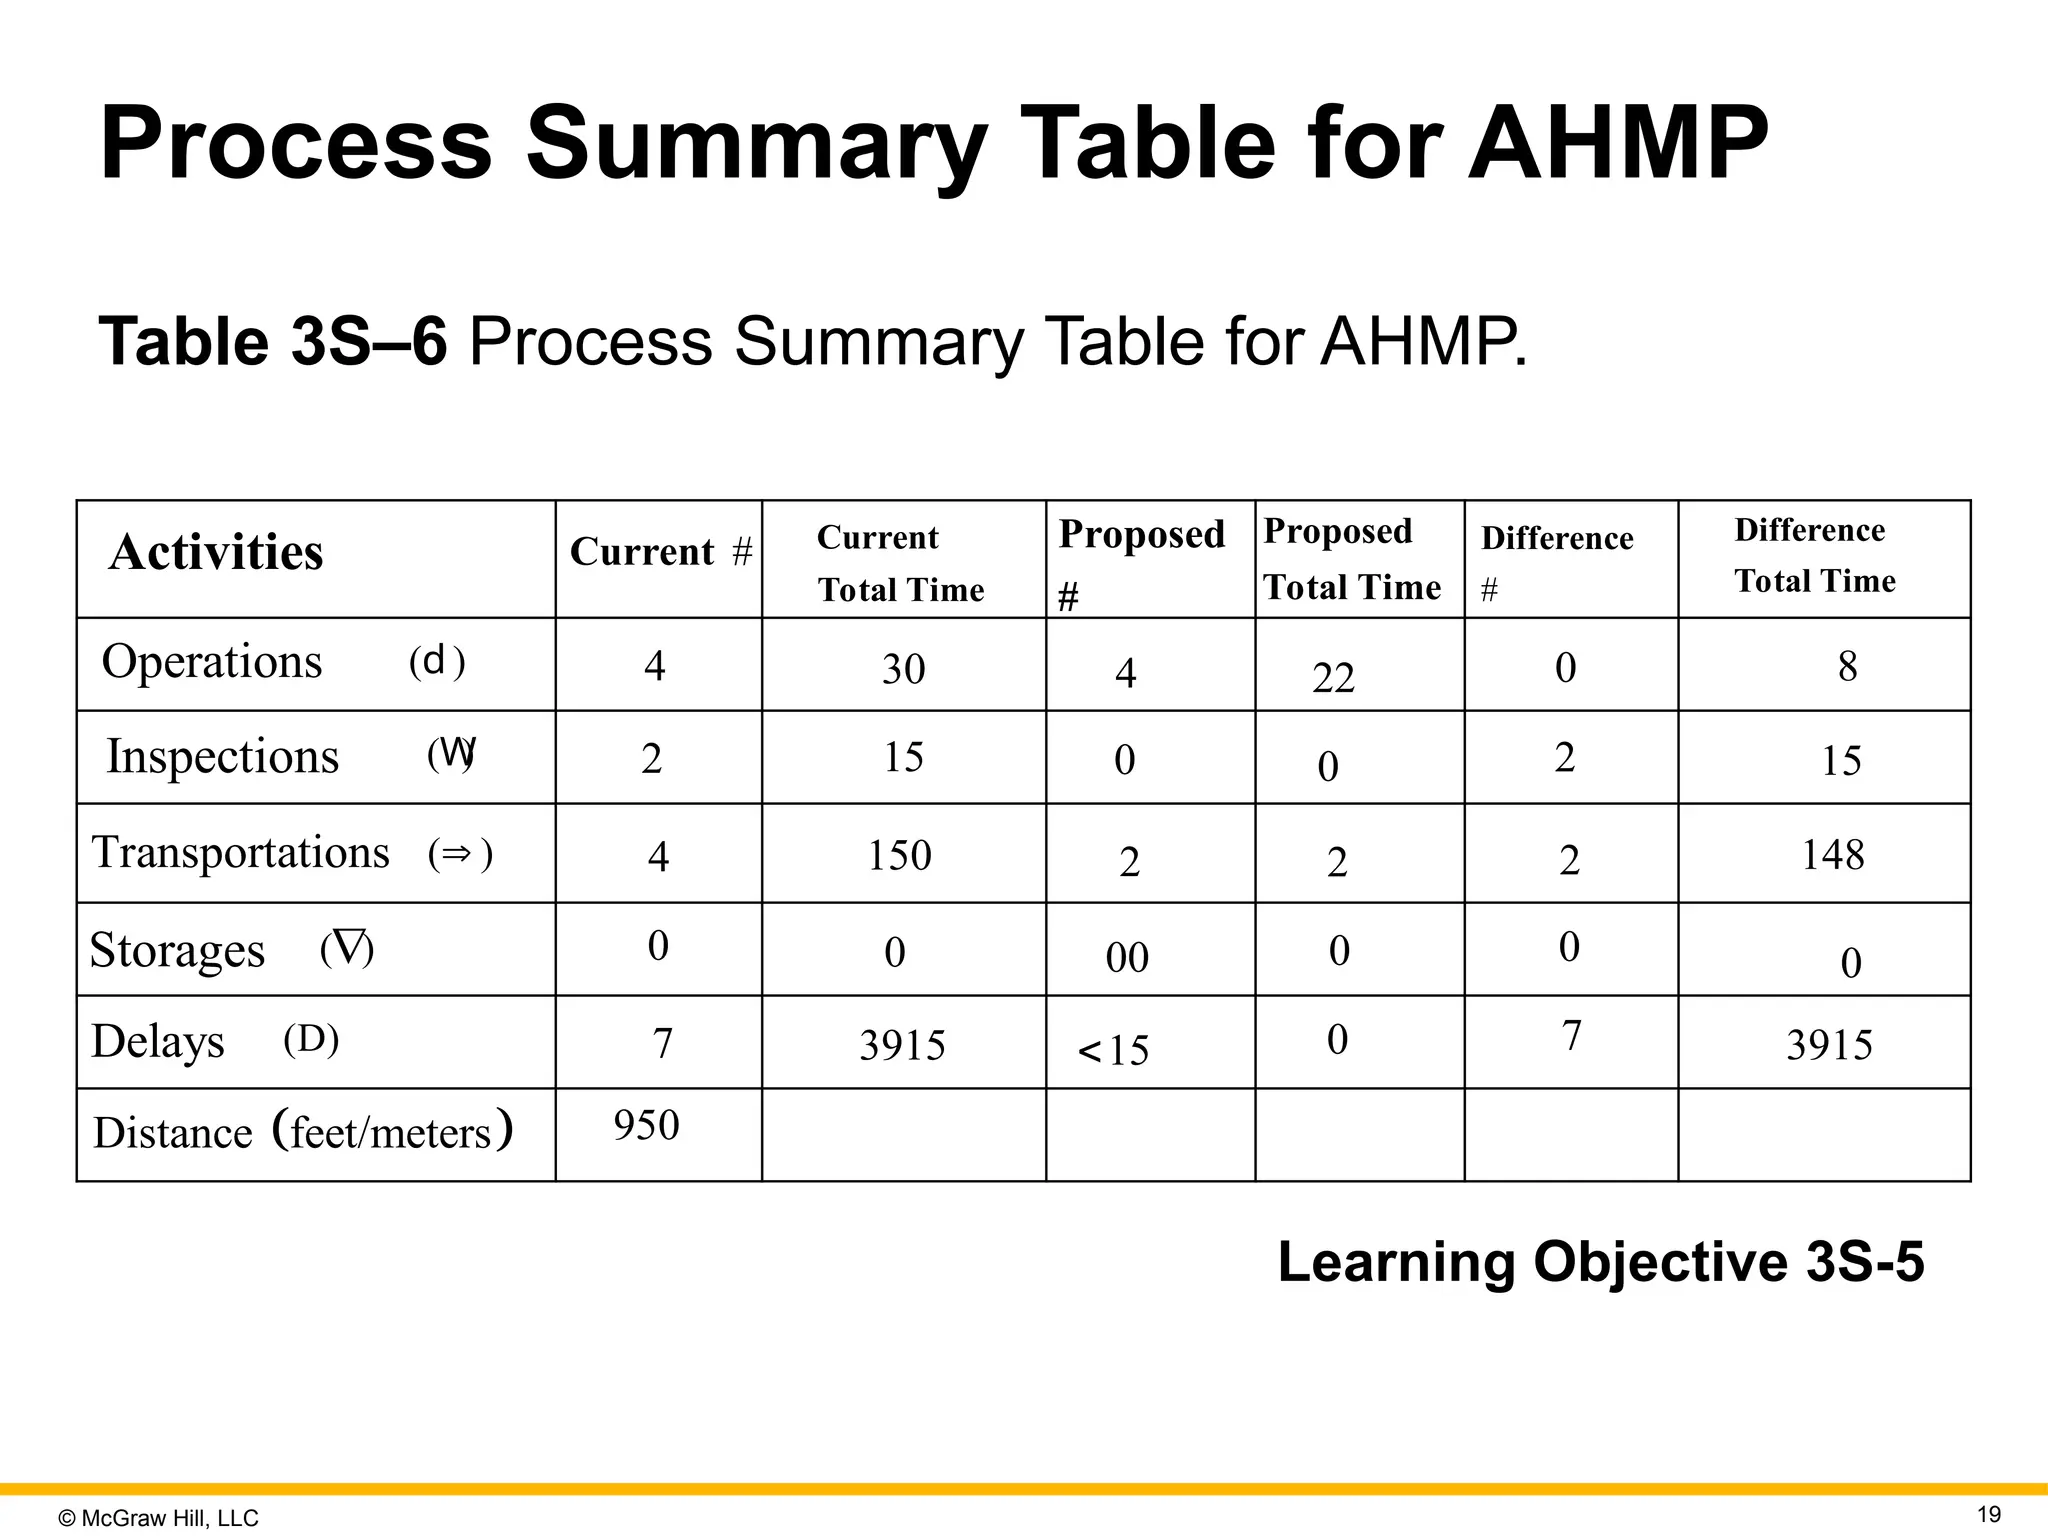
LLC 19 Process Summary Table for AHMP Table 3S–6 Process Summary Table for AHMP. Activities Operations ( ) d Inspections ( ) W Transportations ( ) Storages ( ) Delays (D) Distance feet/meters # Current 4 2 4 0 7 950 Current Total Time 30 15 150 0 3915 Proposed # 4 0 2 00 15 Proposed Total Time 22 0 2 0 0 # Difference 0 2 2 0 7 Difference Total Time 8 15 148 0 3915 Learning Objective 3S-5
20.
© McGraw Hill,
LLC 20 Step 6: Implement and Monitor Improvements Process Improvement demands. . . • Multiple iterations. • Trial and error. • Monitoring and support. Learning Objective 3S-5
21.
© McGraw Hill,
LLC 21 Other Process Mapping Tools • Process flow diagramming – a technique used to indicate the general flow of plant processes and equipment. • Value stream mapping – a mapping technique that analyzes the flow of material and information needed to bring a product to the customer. • Swim lanes – visual element in process flow diagrams or flowcharts that organizes the activities into groups based on tasks. • Service blueprinting – an approach similar to process mapping that analyzes the interface between customers and service processes.
22.
© McGraw Hill,
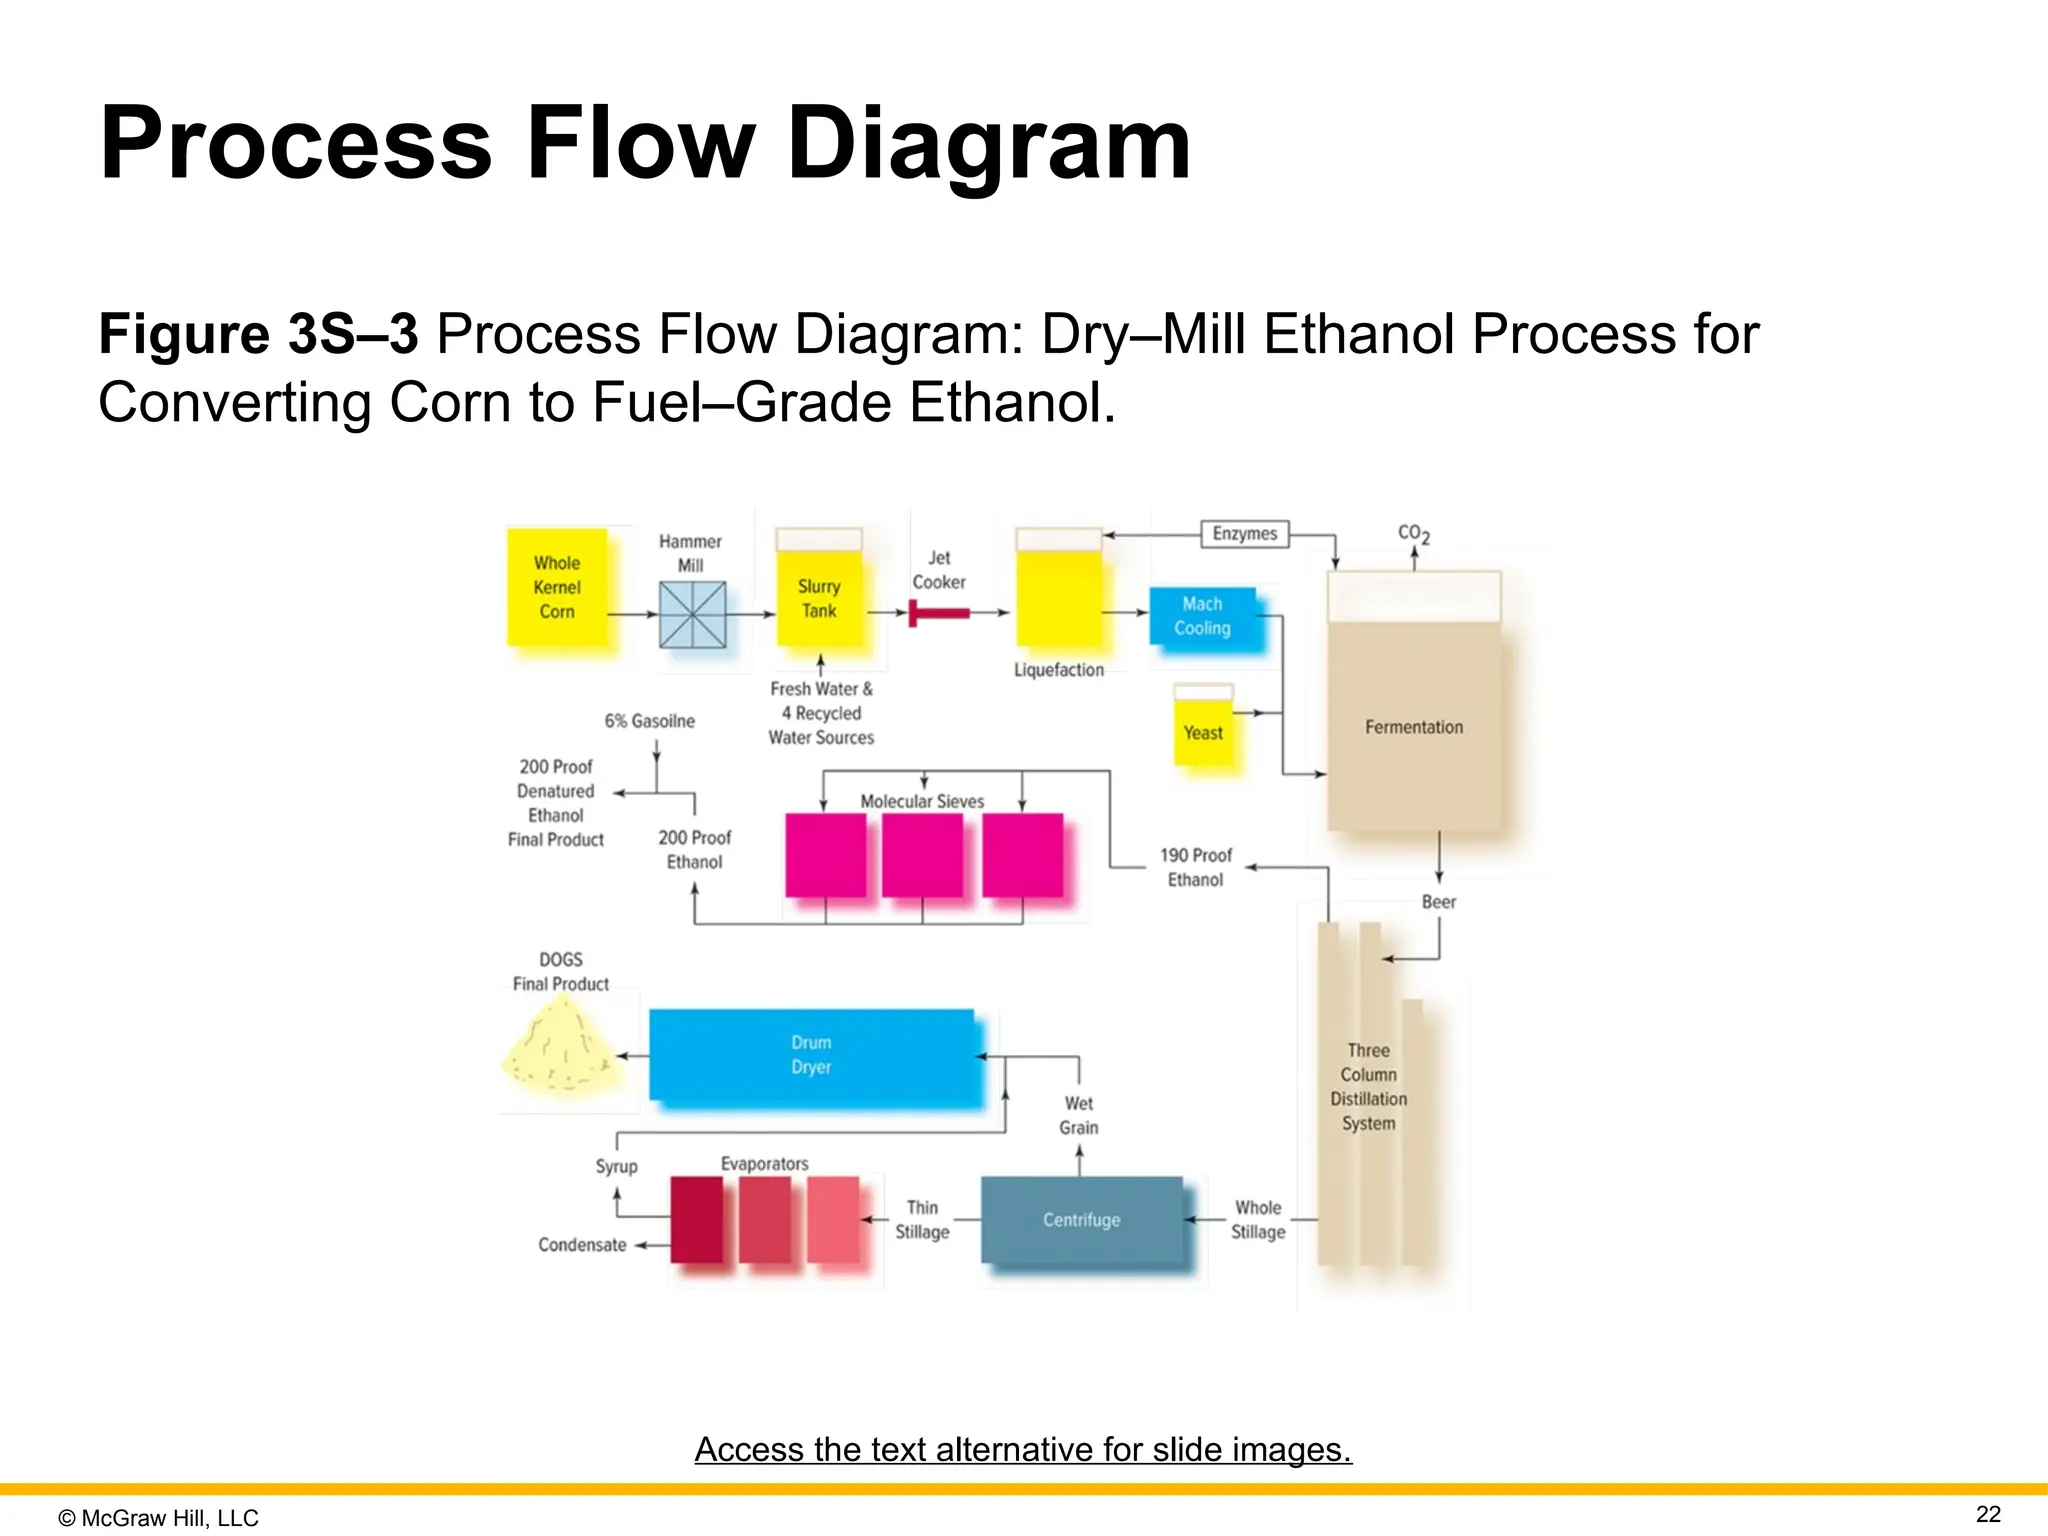
LLC 22 Process Flow Diagram Figure 3S–3 Process Flow Diagram: Dry–Mill Ethanol Process for Converting Corn to Fuel–Grade Ethanol. Access the text alternative for slide images.
23.
© McGraw Hill,
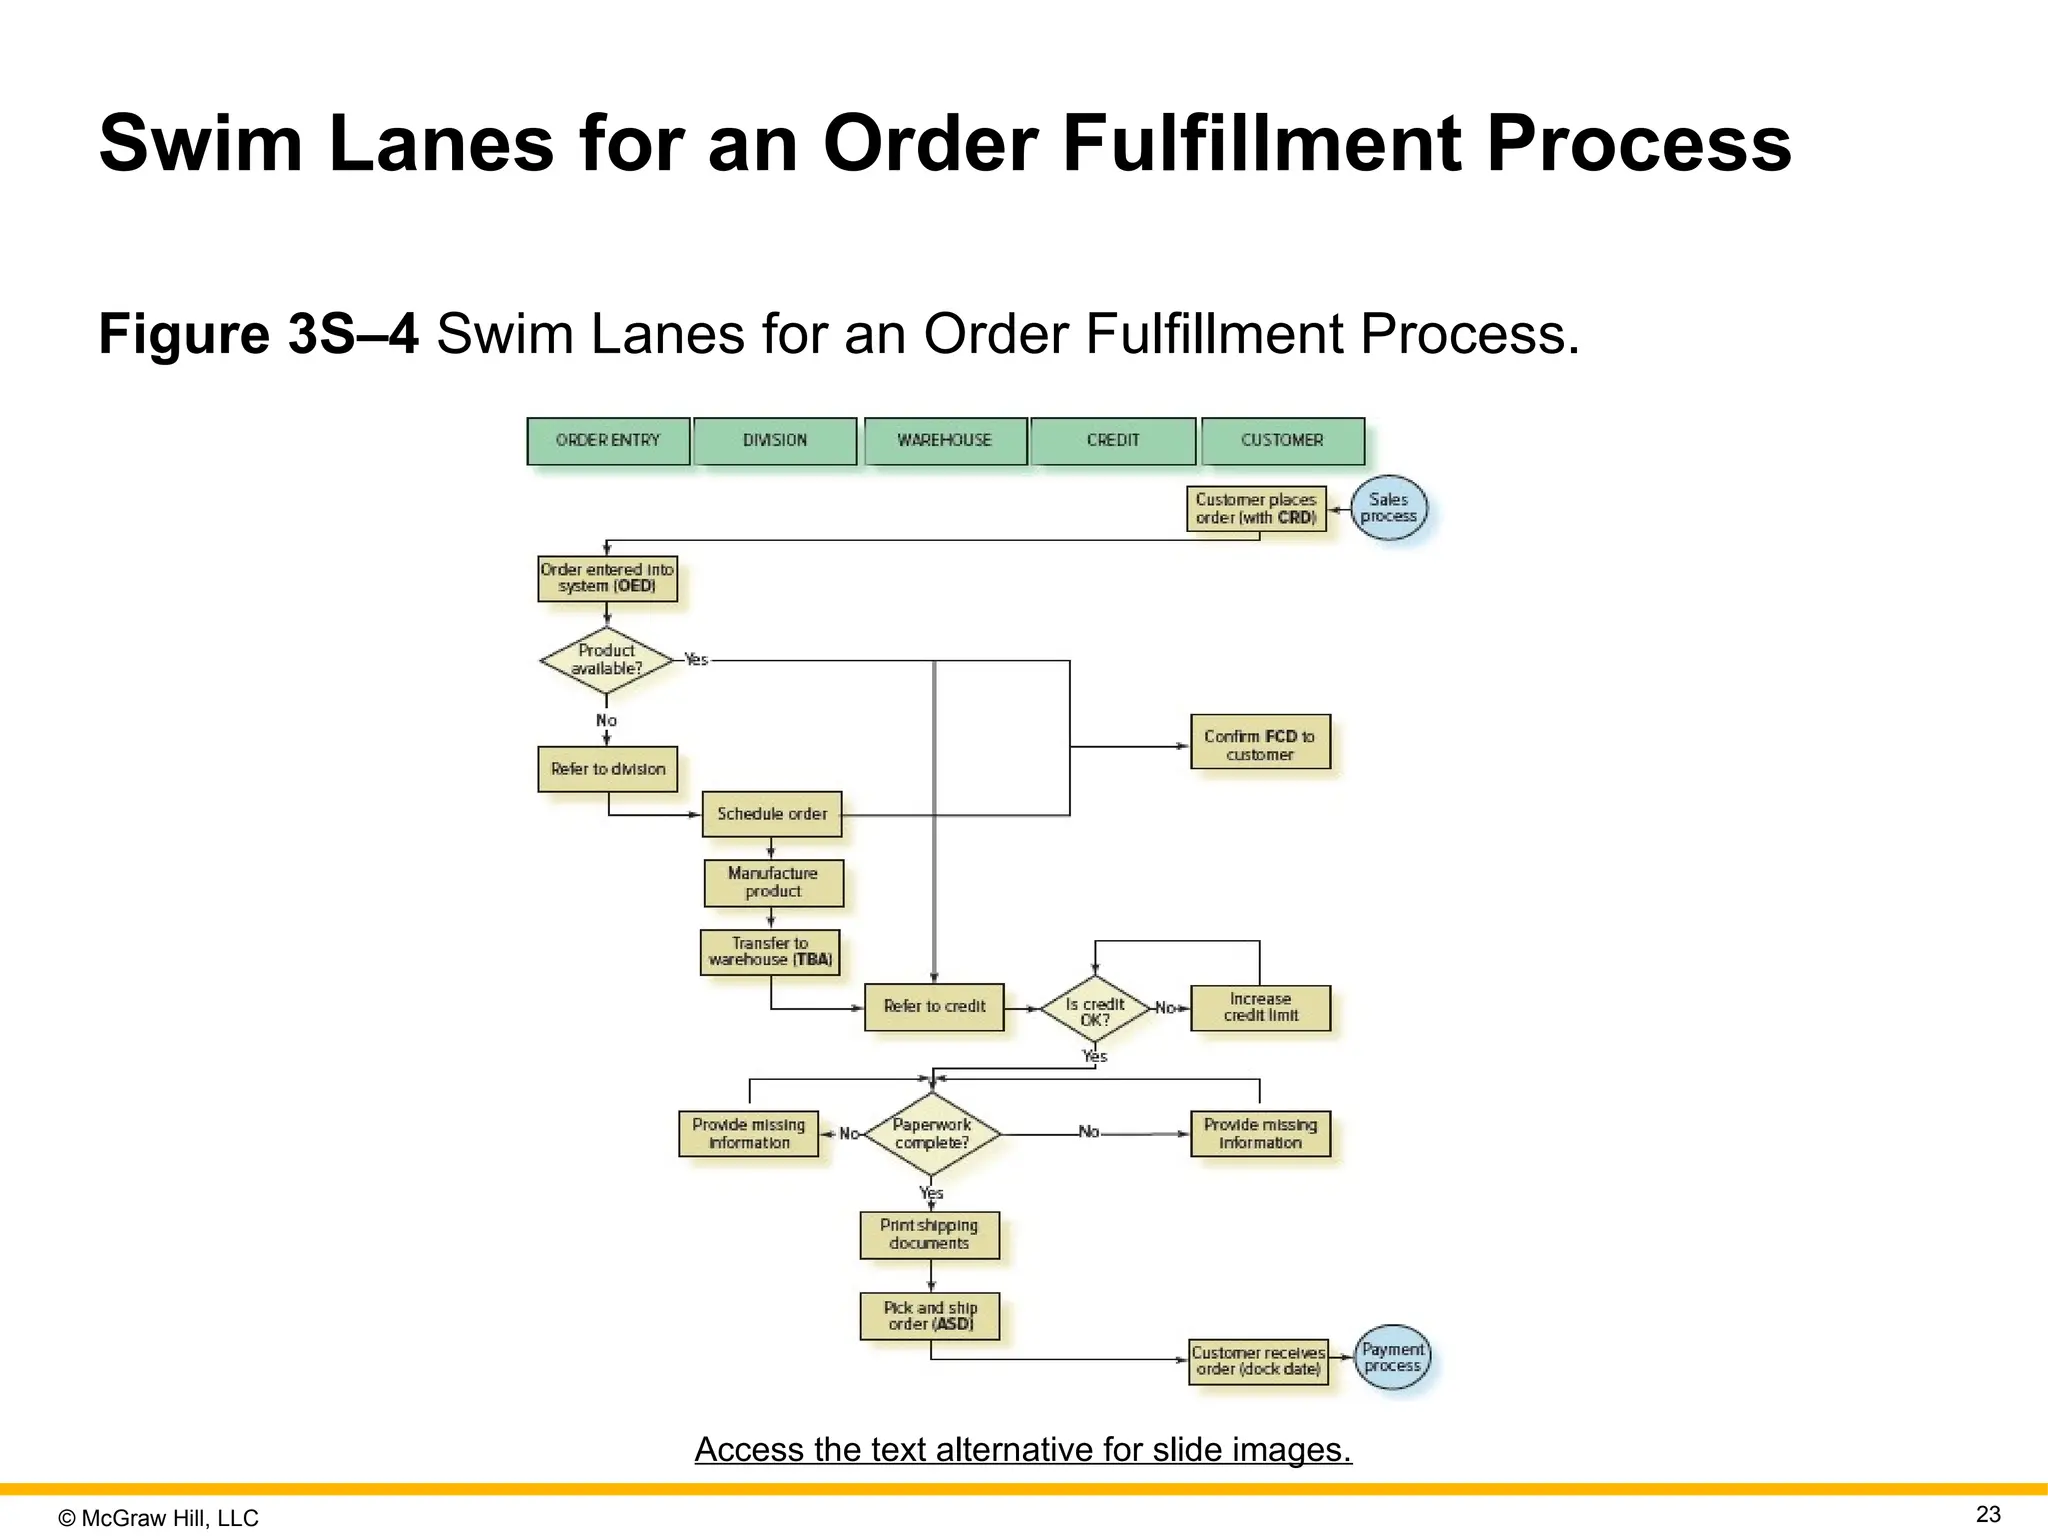
LLC 23 Swim Lanes for an Order Fulfillment Process Figure 3S–4 Swim Lanes for an Order Fulfillment Process. Access the text alternative for slide images.
24.
© McGraw Hill,
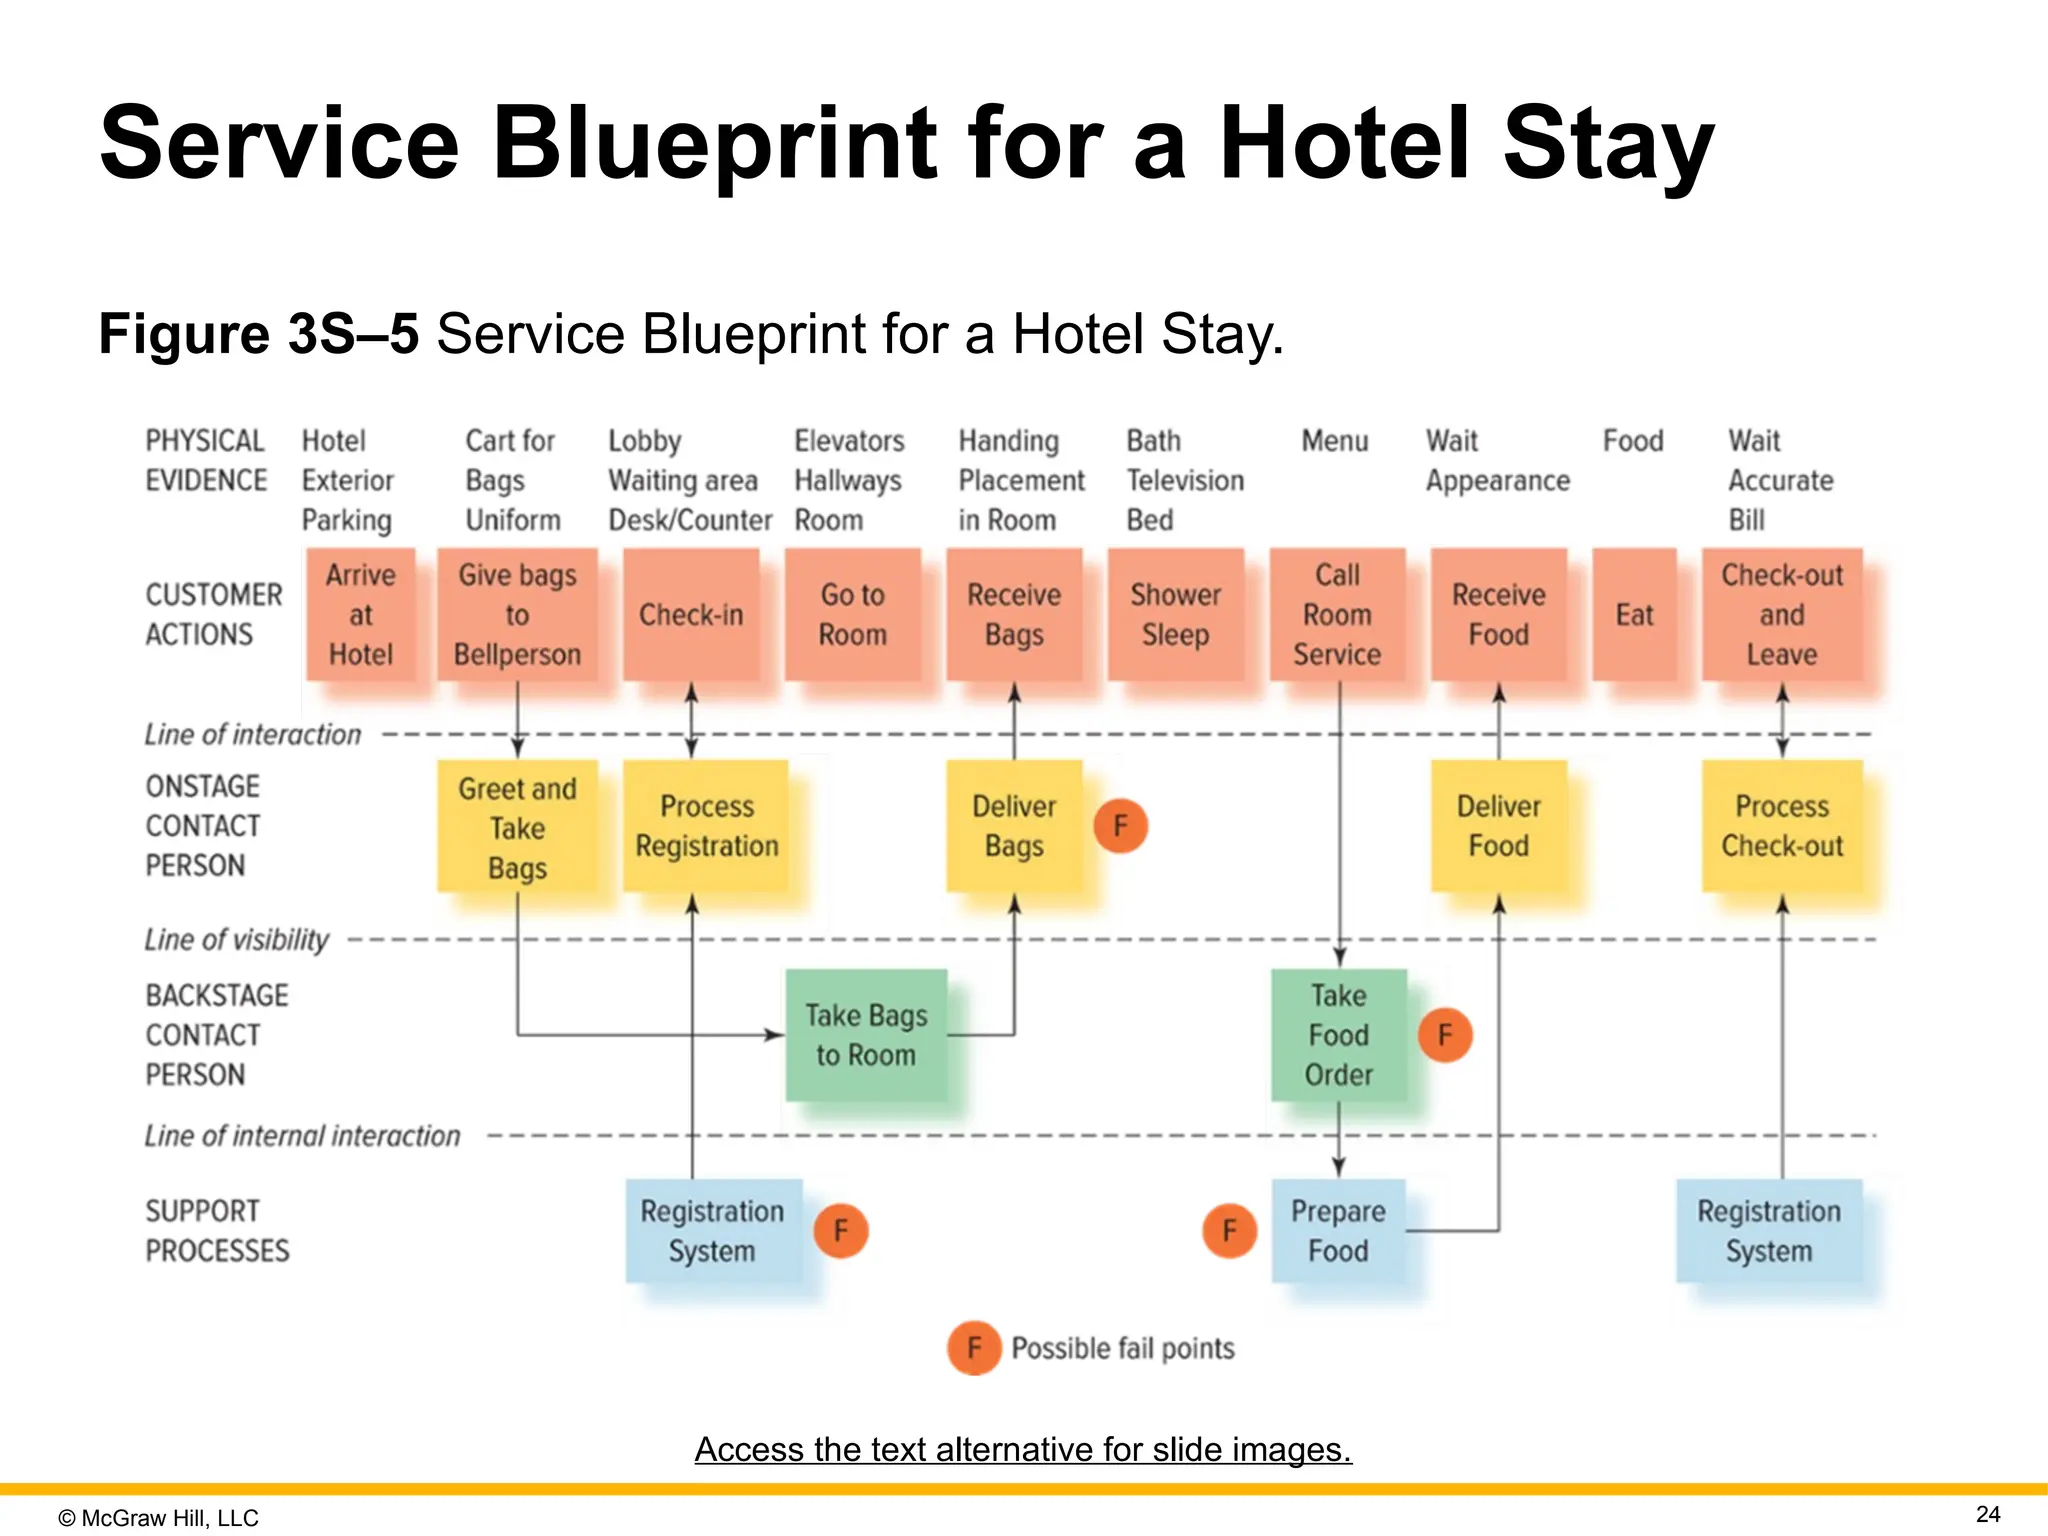
LLC 24 Service Blueprint for a Hotel Stay Figure 3S–5 Service Blueprint for a Hotel Stay. Access the text alternative for slide images.
25.
© McGraw Hill,
LLC 25 Student Activity 2 Select a service on campus and create a service blueprint for this service. How did the service blueprint help you to understand the process? What process improvements do you recommend?
26.
© McGraw Hill,
LLC 26 Process Mapping and Analysis: A Summary 1. Process mapping and analysis is a multi–stage process. 2. Processes can be characterized into six basic activities (operations, decisions, storage activities, transportation activities, delays, and inspections). 3. Multiple tools, including graphs, help to document the “current state” and “future state” of processes. 4. Service blueprinting can be expected to see greater usage as services become more important to customer.
27.
Because learning changes
everything.® www.mheducation.com End of Main Content © McGraw Hill LLC. All rights reserved. No reproduction or distribution without the prior written consent of McGraw Hill LLC.
Download