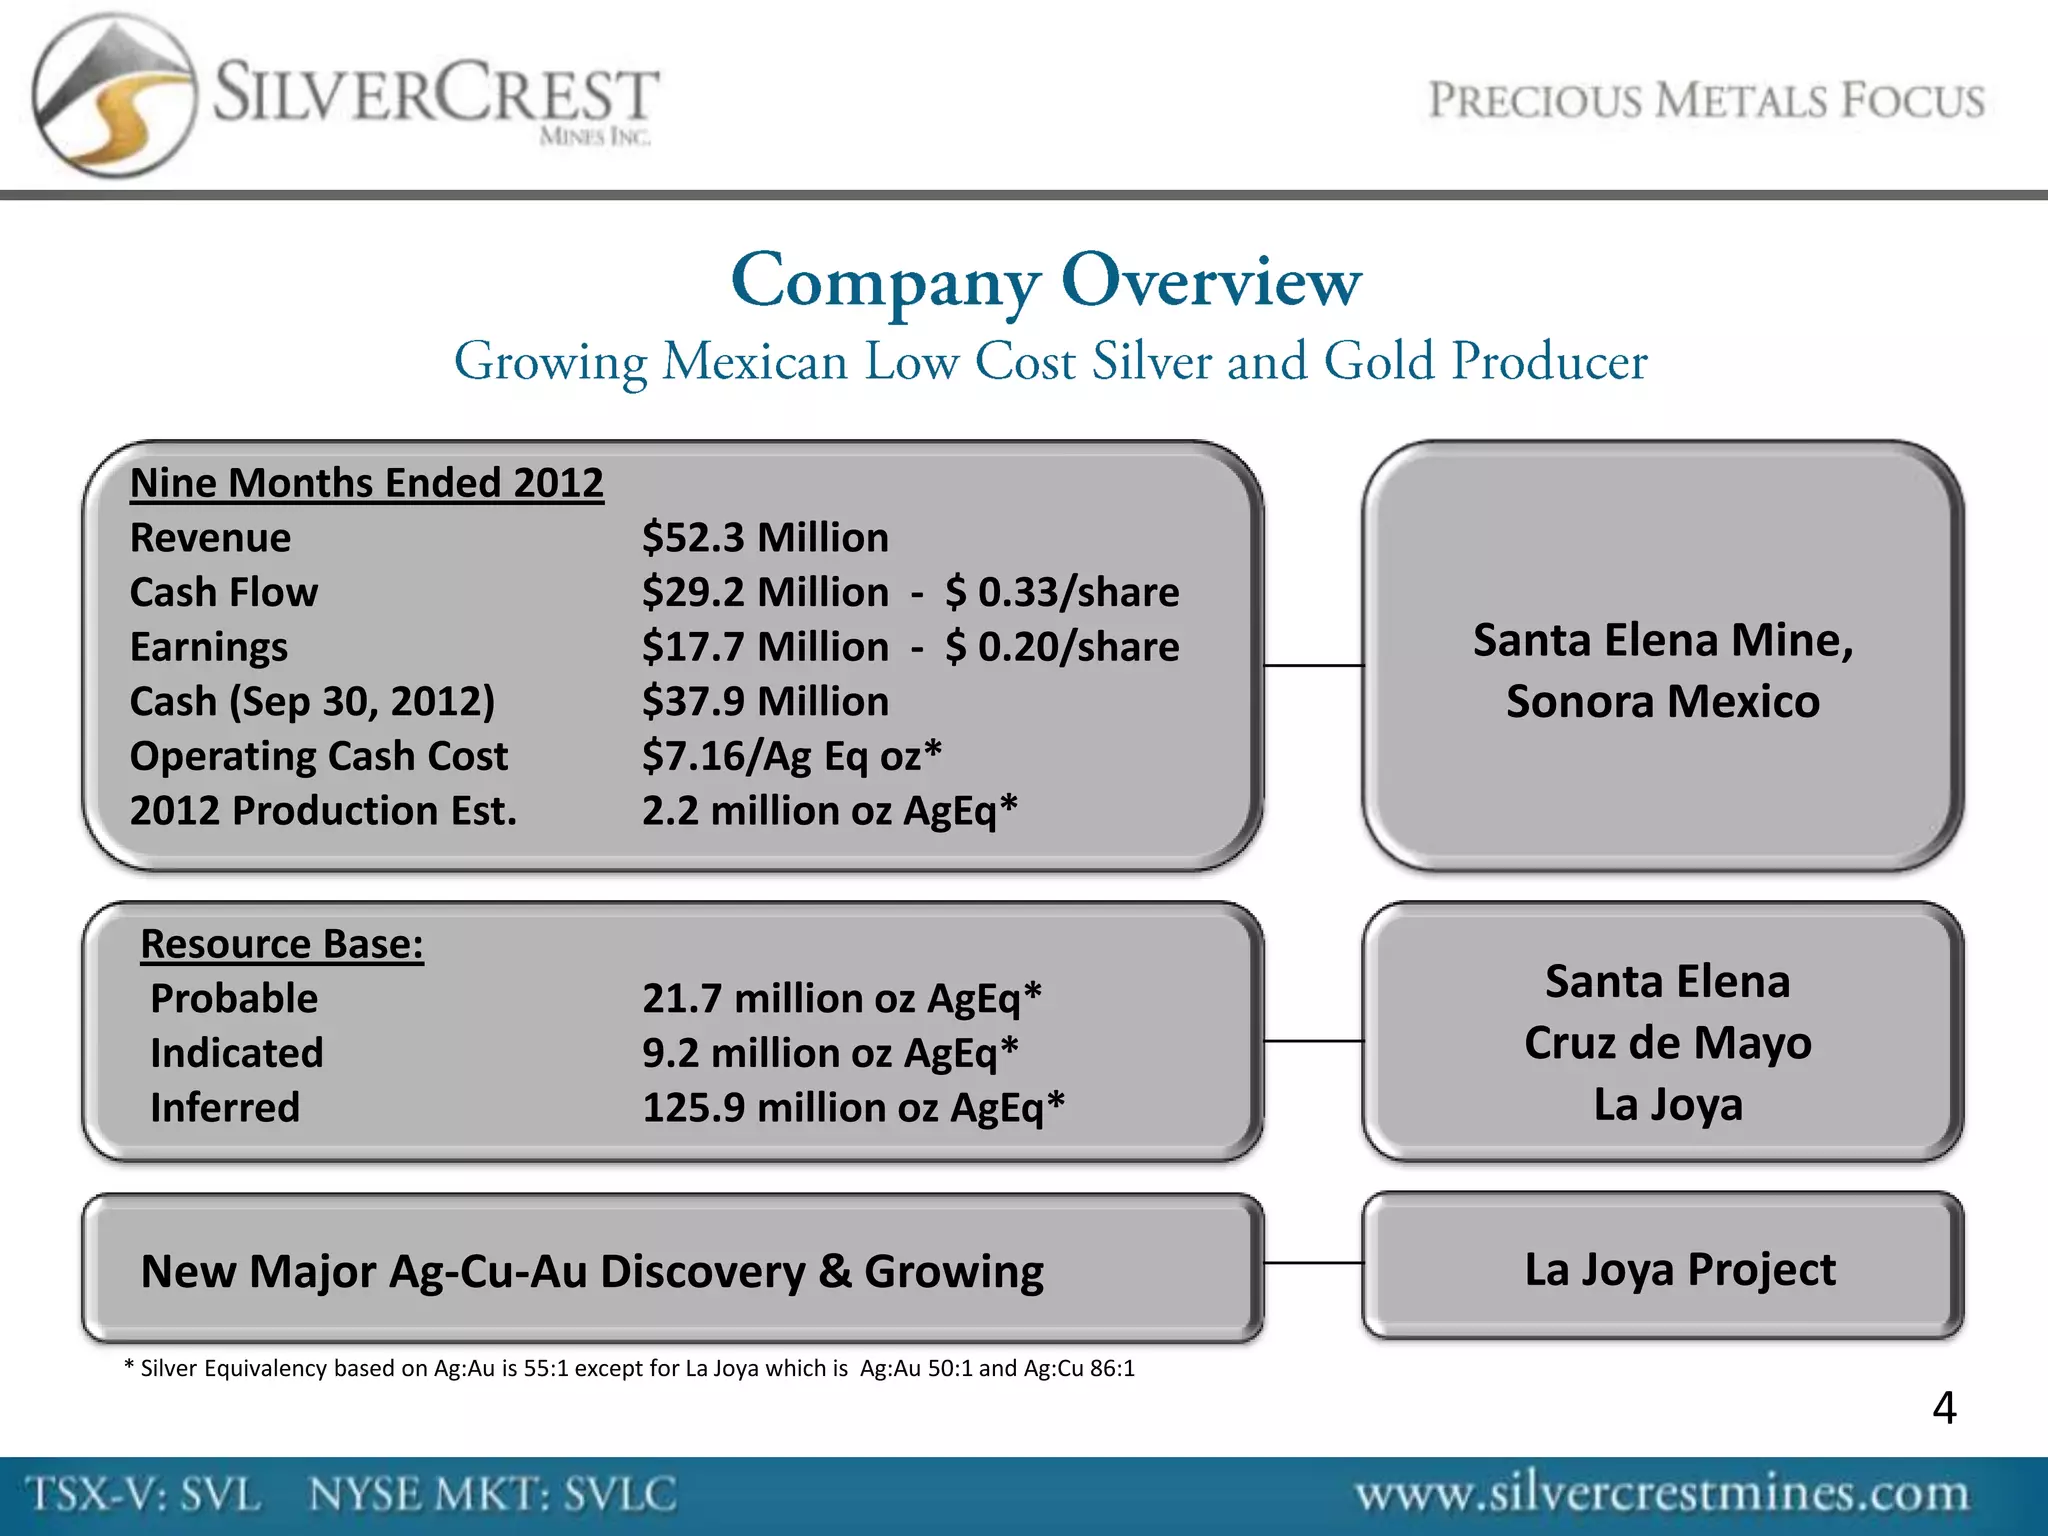
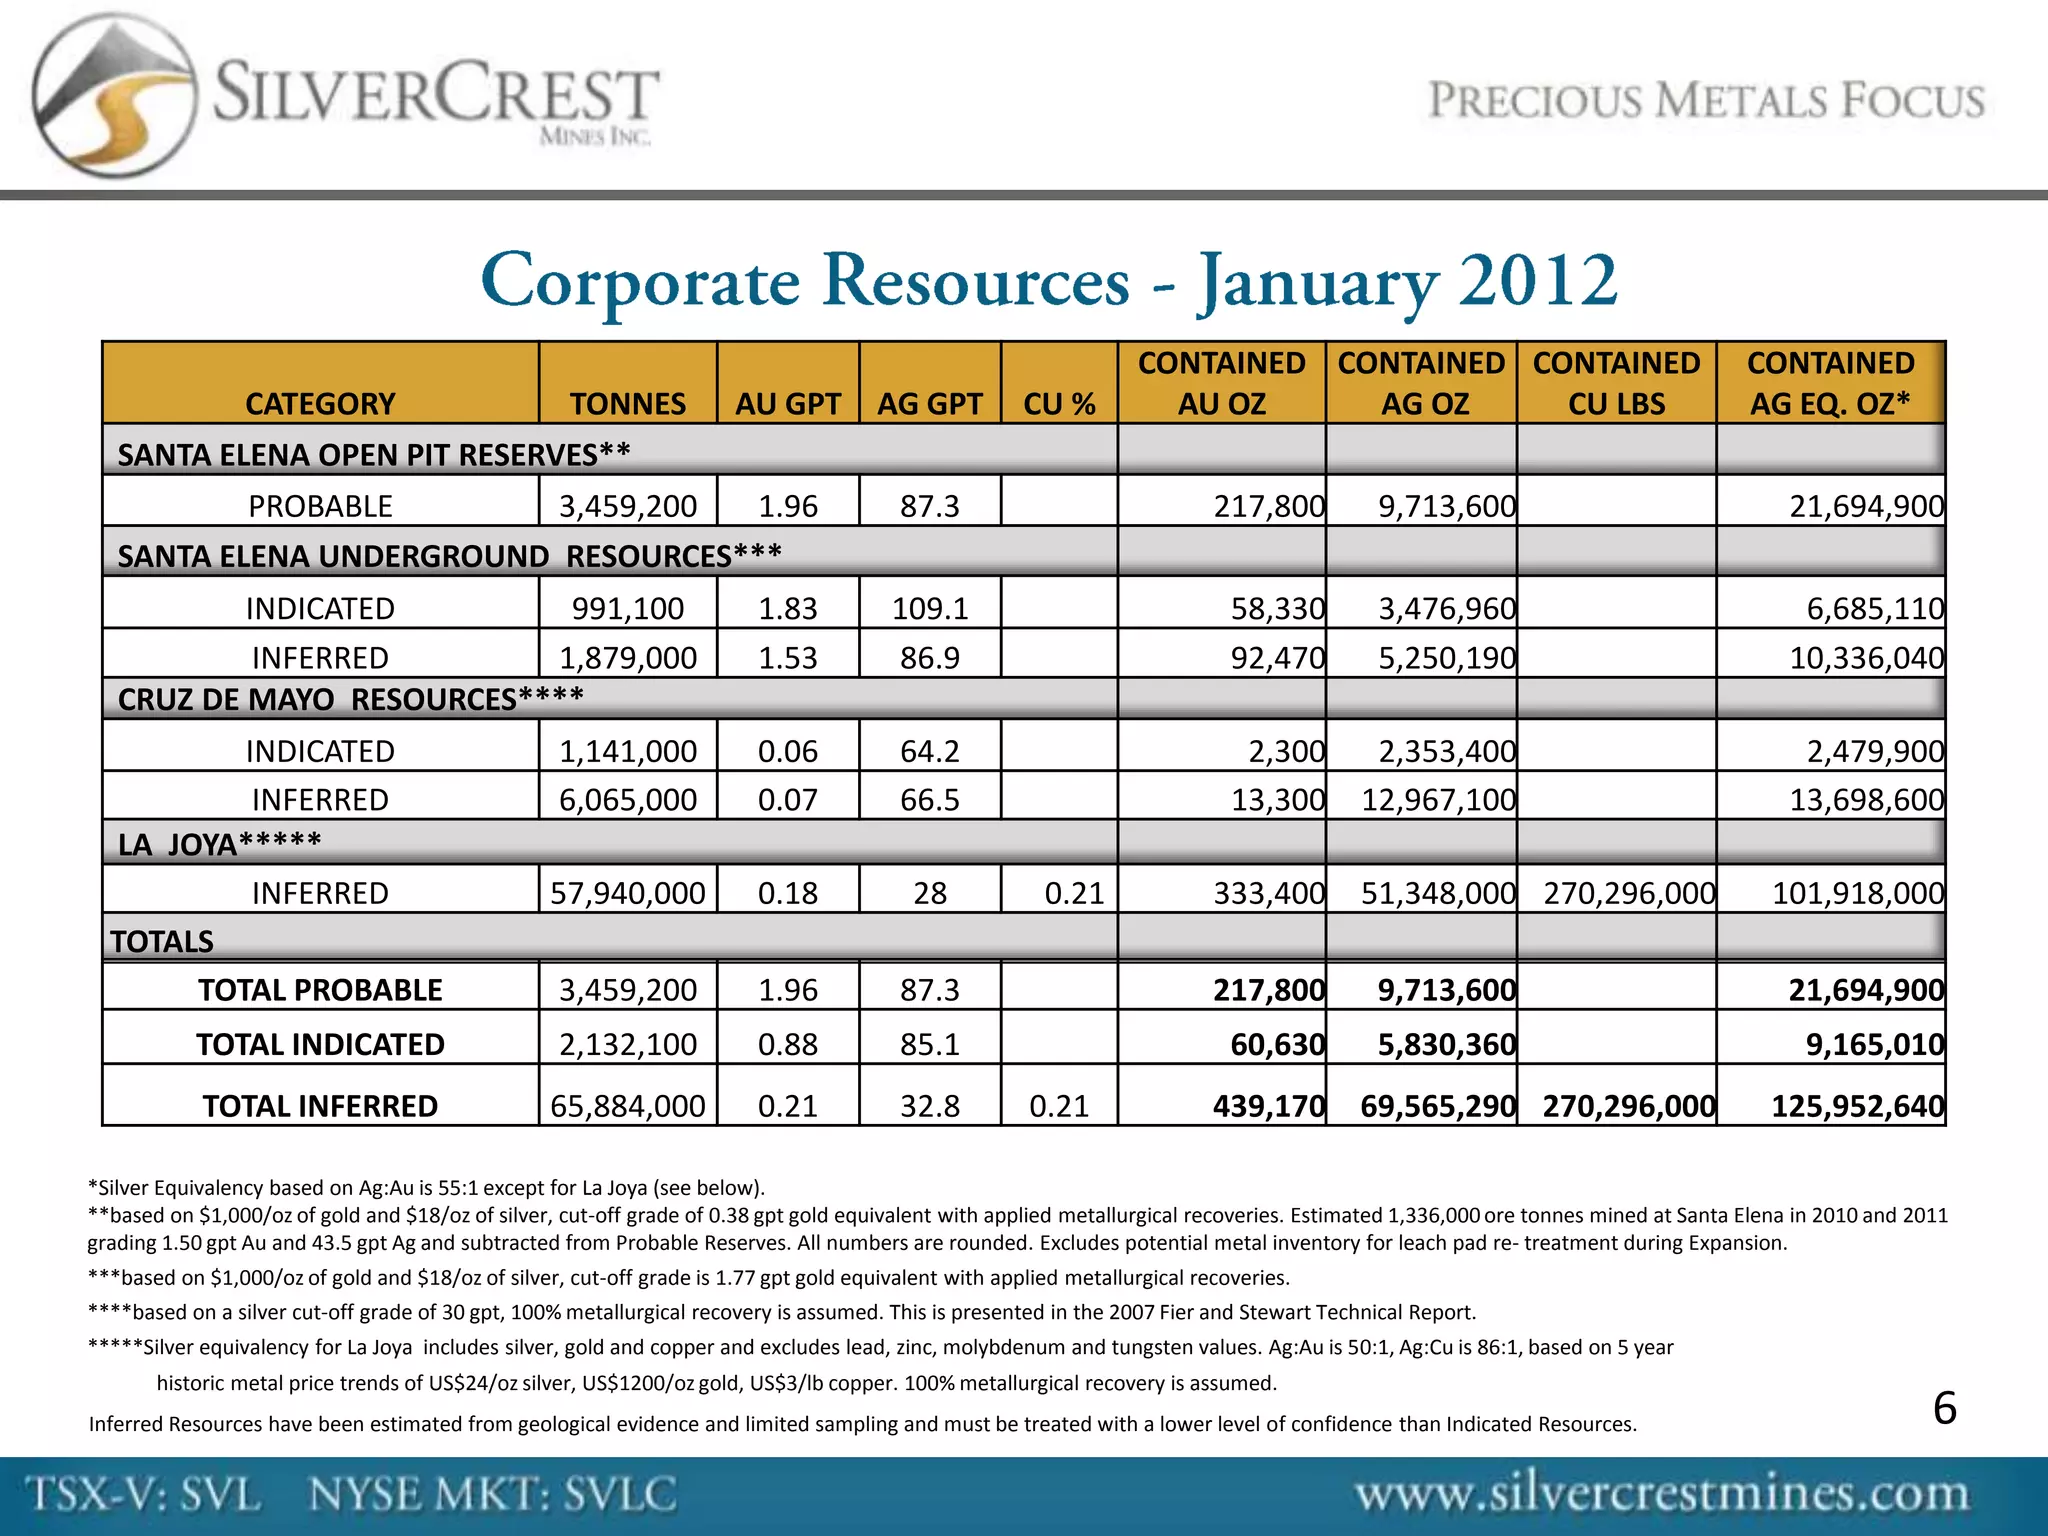
The information provided in this presentation is not intended to be a comprehensive review of all matters and developments concerning the Company. It should be read in conjunction
with all other disclosure documents of the Company. The information contained herein is not a substitute for detailed investigation or analysis. No securities commission or regulatory
authority has reviewed the accuracy or adequacy of the information presented.
FORWARD-LOOKING STATEMENTS

This presentation contains “forward‐looking statements” within the meaning of Canadian securities legislation and the United States Securities Litigation Reform Act of 1995. Such
forward‐looking statements concern the Company’s anticipated results and developments in the Company’s operations in future periods, planned exploration and development of its
properties, plans related to its business and other matters that may occur in the future. These statements relate to analyses and other information that are based on expectations of
future performance, including silver and gold production and planned work programs. Statements concerning reserves and mineral resource estimates may also constitute
forward‐looking statements to the extent that they involve estimates of the mineralization that will be encountered if the property is developed and, in the case of mineral reserves, such
statements reflect the conclusion based on certain assumptions that the mineral deposit can be economically exploited.

Forward‐looking statements are subject to a variety of known and unknown risks, uncertainties and other factors which could cause actual events or results to differ from those
expressed or implied by the forward‐looking statements, including, without limitation: risks related to precious and base metal price fluctuations; risks related to fluctuations in the
currency markets (particularly the Mexican peso, Canadian dollar and United States dollar); risks related to the inherently dangerous activity of mining, including conditions or events
beyond our control, and operating or technical difficulties in mineral exploration, development and mining activities; uncertainty in the Company’s ability to raise financing and fund the
exploration and development of its mineral properties; uncertainty as to actual capital costs, operating costs, production and economic returns, and uncertainty that development
activities will result in profitable mining operations; risks related to reserves and mineral resource figures being estimates based on interpretations and assumptions which may result in
less mineral production under actual conditions than is currently estimated and to diminishing quantities or grades of mineral reserves as properties are mined; risks related to
governmental regulations and obtaining necessary licenses and permits; risks related to the business being subject to environmental laws and regulations which may increase costs of
doing business and restrict our operations; risks related to mineral properties being subject to prior unregistered agreements, transfers, or claims and other defects in title; risks relating
to inadequate insurance or inability to obtain insurance; risks related to potential litigation; risks related to the global economy; risks related to the Company’s status as a foreign private
issuer in the United States; risks related to all of the Company’s properties being located in Mexico and El Salvador, including political, economic, social and regulatory instability; and
risks related to officers and directors becoming associated with other natural resource companies which may give rise to conflicts of interests.

Should one or more of these risks and uncertainties materialize, or should underlying assumptions prove incorrect, actual results may vary materially from those describedin the
forward‐looking statements. The Company’s forward‐looking statements are based on beliefs, expectations and opinions of management on the date the statements are made. For the
reasons set forth above, investors should not place undue reliance on forward‐looking statements. he information contained herein is nota a substitute for detailed investigation or
analysis. No securities commission or regulatory authority has reviewed the accuracy or adequacy of the information presented.
All monetary figures are expressed in United States dollars unless otherwise specified.


Under National Instrument (NI 43-101) Standards of Disclosure for Mineral Projects, the Qualified Person for this presentation is N. Eric Fier, CPG, P.Eng. and Chief Operating
Officer for SilverCrest Mines Inc., who has reviewed and approved its contents.                                                                                                           2
J. Scott Drever, President (45 years experience)
Strategic Planning, Mergers & Acquisitions. Management and operational experience with several production
companies, including Placer Dome and Blackdome Mining.
Barney Magnusson, CFO (35 years experience)
Served as an Officer and Director of 6 mining (Dayton Mines, High River Gold Mines) companies that
developed, constructed or operated 8 precious metals mines in North and South America.
N. Eric Fier, CPG, P.Eng., COO (25 years experience)
Operations, Project Evaluation & Management. Previously with Newmont Mining, Eldorado Gold, Pegasus Gold Corp.
Involvement in construction and operations of 3 previous mines. Several major international discoveries.
Brent McFarlane, VP Operations (25 years experience)
Managed all phases of open pit and underground mining projects and instrumental in leading Mexican and Int’l projects
through feasibility, construction, and production while working for Minefinders, Kappes Cassiday, TVI
Pacific, Marston, and Pegasus Gold.
Graham C. Thody, Director (30 years experience)
Corp. finance and public company management. Director and President of UEX Corp., Chairman of the Board of
Geologix.
George W. Sanders, Director (30 years experience)
Experience in mining and exploration finance. Previously with Canaccord Capital Corp., Richmont Mines
Inc., Consolidated Cinola Mines Ltd., and Shore Gold Inc.
Ross Glanville, Director (40 years experience)
Experience in mining, exploration finance, valuations and fairness opinions. Director of Archon Minerals Limited, Clifton
Star Resources Inc. and Starfield Resources Inc.
                                                                                                                        3
Nine Months Ended 2012
Revenue                                          $52.3 Million
Cash Flow                                        $29.2 Million - $ 0.33/share
Earnings                                         $17.7 Million - $ 0.20/share                       Santa Elena Mine,
Cash (Sep 30, 2012)                              $37.9 Million                                       Sonora Mexico
Operating Cash Cost                              $7.16/Ag Eq oz*
2012 Production Est.                             2.2 million oz AgEq*

 Resource Base:
 Probable                                        21.7 million oz AgEq*                                 Santa Elena
 Indicated                                       9.2 million oz AgEq*                                 Cruz de Mayo
 Inferred                                        125.9 million oz AgEq*                                  La Joya


 New Major Ag-Cu-Au Discovery & Growing                                                               La Joya Project
* Silver Equivalency based on Ag:Au is 55:1 except for La Joya which is Ag:Au 50:1 and Ag:Cu 86:1
                                                                                                                        4
SVL Share Structure                                Trading Summary
Issued & Outstanding                105,867,129   3 Month Ave. Daily Volume           460,924
Warrants & Options                    8,335,300   52 Week High/Low             CAD $3.17/$1.55
Fully Diluted Shares                114,202,429   Share Price (Dec 07, 2012)        CAD $2.57
Average Warrant Price                CAD $1.60    Market Cap                       CAD $272M
Average Option Price                 CAD $1.31    Cash                                  $47M

 Management & Key Shareholders (Fully Diluted)
J. Scott Drever, President            2,691,226
Barney Magnusson, CFO                 2,870,727
N. Eric Fier, COO                     2,457,027
Sprott Asset Management                   8.0%
Libra Advisors                            5.4%
AGF & Wellington Mgmt.                    3.0%
Independent Directors                 1,885,500
CONTAINED CONTAINED CONTAINED                                  CONTAINED
           CATEGORY            TONNES AU GPT                                          AG GPT          CU %           AU OZ     AG OZ     CU LBS                                   AG EQ. OZ*
   SANTA ELENA OPEN PIT RESERVES**
           PROBABLE           3,459,200 1.96                                             87.3                              217,800          9,713,600                                 21,694,900
   SANTA ELENA UNDERGROUND RESOURCES***
           INDICATED        991,100                                      1.83           109.1                                58,330         3,476,960                                  6,685,110
            INFERRED       1,879,000                                     1.53           86.9                                 92,470         5,250,190                                 10,336,040
   CRUZ DE MAYO RESOURCES****
          INDICATED                                1,141,000             0.06            64.2                                 2,300        2,353,400                                   2,479,900
           INFERRED                                6,065,000             0.07            66.5                                13,300       12,967,100                                  13,698,600
  LA JOYA*****
           INFERRED                               57,940,000             0.18             28             0.21              333,400        51,348,000 270,296,000                    101,918,000
  TOTALS
       TOTAL PROBABLE                              3,459,200             1.96            87.3                              217,800          9,713,600                                 21,694,900
           TOTAL INDICATED                         2,132,100             0.88            85.1                                60,630         5,830,360                                   9,165,010
            TOTAL INFERRED                        65,884,000             0.21            32.8          0.21                439,170        69,565,290 270,296,000                    125,952,640

*Silver Equivalency based on Ag:Au is 55:1 except for La Joya (see below).
**based on $1,000/oz of gold and $18/oz of silver, cut-off grade of 0.38 gpt gold equivalent with applied metallurgical recoveries. Estimated 1,336,000 ore tonnes mined at Santa Elena in 2010 and 2011
grading 1.50 gpt Au and 43.5 gpt Ag and subtracted from Probable Reserves. All numbers are rounded. Excludes potential metal inventory for leach pad re- treatment during Expansion.
***based on $1,000/oz of gold and $18/oz of silver, cut-off grade is 1.77 gpt gold equivalent with applied metallurgical recoveries.
****based on a silver cut-off grade of 30 gpt, 100% metallurgical recovery is assumed. This is presented in the 2007 Fier and Stewart Technical Report.
*****Silver equivalency for La Joya includes silver, gold and copper and excludes lead, zinc, molybdenum and tungsten values. Ag:Au is 50:1, Ag:Cu is 86:1, based on 5 year
       historic metal price trends of US$24/oz silver, US$1200/oz gold, US$3/lb copper. 100% metallurgical recovery is assumed.
Inferred Resources have been estimated from geological evidence and limited sampling and must be treated with a lower level of confidence than Indicated Resources.                                   6
7
8
Santa Elena Mine Operating Highlights                              Q1 2012 Q2 2012 Q3 2012 YTD 2012

Silver ounces produced                                                134,528          139,850         151,368          425,746
Gold ounces produced                                                    9,405            8,584           7,184           25,173
Silver equivalent ounces produced (1)                                 616,668          646,553         519,587        1,782,808

Silver ounces sold                                                    139,771          124,739         152,088          416,598
Gold ounces sold                                                        9,788            8,679           7,923           26,390
Silver equivalent ounces sold (1)                                     641,546          637,079         558,185        1,836,767

Tonnes ore mined                                                      263,424   269,802                266,534          799,760
Tonnes waste mined                                                  1,439,330 1,283,493                985,293        3,708,116
Waste / ore ratio                                                        5.46      4.76                   3.70             4.64
Ore tonnes crushed                                                    264,977   317,958                265,598          848,533
Average ore tonnes crushed per day                                      2,912     3,494                  2,887            3,097
Average silver ore grade (gpt) loaded on pad                            44.13     39.45                  48.41            43.72
Average gold ore grade (gpt) loaded on pad                                 1.61             1.35            1.37              1.44
Silver ounces delivered to pad                                        375,987          403,264         413,426        1,192,677
Gold ounces delivered to pad                                           13,762           13,764          11,681           39,207

Ag : Au Ratio (1)                                                        51.2:1             59:1          51.2:1           53.9:1

(1) Silver equivalence is a weighted volume average based on market spot prices per ounces of gold and silver at the quarter end dates.
(2) (1) Silver equivalence is based on market spot prices per ounce of silver and gold at the quarter end dates. All numbers are rounded.
                                                                                                                                            9
Ounces                       Silver and Silver Equivalent Production                                      Au : Ag - 55:1


       3,000,000


       2,500,000


       2,000,000


       1,500,000


       1,000,000
                       18.7k oz
                                       8.5k oz
         500,000
                                                         -               -              -               -
                                                                                                                       -
              -
                        2011           2012            2013           2014            2015           2016            2017


                       Sandstorm Gold Stream            Macquarie Gold Hedge Facility           Market Spot Price

Note: Bought Deal Financing 13,529,750 Units (incl. overallotment) @ $2.55 to eliminate the balance 29,000oz of the gold hedge
facility, settled in cash for $23.3 million.                                                                                       10
• Develop Underground Resource (2012 to 2022)
                                      2012-2013 Decline ramp, UG development and Drilling
                                      2012-2013 Construct 3,000 tonnes per day conventional mill
                                      Early 2014 Mill feed from Open Pit and Underground

         • Cruz de Mayo Development (2011 to 2017)
                                      2011-2012 Pre Feasibility underway
                                      Early 2015 Open-pit Ag resource for Heap Leach & SE Mill feed

         • Reprocess Leach Pad Material (2014 to 2022)
         • Estimated Expansion Capex: $65M by Q1 2014


2012: Est. 2.2 million oz Ag Eq*                               2014: 3.5 to 4.5 million oz Ag Eq*
    * Silver Equivalency based on Ag:Au is 55:1                                                       11
Underground Decline Portal
                                   Open Pit
Waste Dump


                                                     Future Crushing
                                                         Circuit
               Leach Pad
                           Leach Pad
               Phase 1      Phase 2


                                                    Future CCD
                                                 Circuit , 3000 tpd
             Merrill Crowe Plant
                                                                           12
 3,000 to 3,500 tpd:                              Average 4.0M to 5.0M oz Ag equivalent per year.
 Initial capital costs:                           $84M (25% contingency), potential reduction in PFS to $65M
 Est. cash operating costs:                       $9.70 per ounce of Ag equivalent.

 Expansion Plan – Silver and Gold Price Sensitivities


                                Average Gold               Average            Pre-Tax Net Cash               Pre- Tax NPV
             Case                   Price                Silver Price               Flow                     @ 5% Discount
                                                                                 ( millions)                   ( millions)
 Low                                  $800                    $14                  $47.5                         $34.1
 Base                                $1,000                   $18                     $169.5                       $131.2
 Current Prices (1)                  $1,450                   $38                     $620.6                       $491.4
 High                                $1,600                   $50                     $856.5                       $680.1

(1)   At the time of the study, April 1, 2011: PEA for the Santa Elena and Cruz de Mayo Expansion Project – NI 43-101 Technical Report


                                                                                                                                         13
La Joya & Santa Elena
                                                                                                      Potential Additions
                        CURRENTLY


Open Pit = 2011 to 2014, Underground = 2014 to 2022, Cruz de Mayo = 2015 to 2017, Leach Pad Reprocess = 2014 to 2022.
Based on PEA 2011 results. Revisions are anticipated in the 2013 Expansion Plan PFS
                                                                                                                             14
A’
                      Decline Portal

                                                            N

A                                                          100m

    Santa Elena Pit


                       SE U/G RESERVE DRILLING (ONGOING)

SE U/G SOUTH

                                                       SE DEEP
                                                     (ONGOING)

                                                                     15
16
   100% owned (18,000+ ha)
   Near Surface Resource                       Conceptual Open Pit
   Strip ratio approximately 2:1
   Indicated Resource 2,353,400 oz Ag,
                          2,300 oz Au
   Inferred Resource 12,967,100 oz Ag,
                          13,300 oz Au
   Potential for Resource Expansion
   65 km - Road distance from Santa Elena
   Pre-Feasibility level work under way
    (incl. a completed 50-hole drill program)


                                                                      17
      Excellent access and infrastructure
       Nearby operating mines
       Purchase Agreement to acquire
        100%, $4.18 million over 3 yrs
        w/2% NSR ($340K paid)
       Historic    work     by     Luismin
        (Goldcorp); 51 holes used in
        compilation
       Similar geology and mineralization
        to nearby Sabinas Mine
       102 Million oz AgEq* Inferred
        Resource
       Up to $6m Phase II, 100 drill hole
        program nearing completion
       Resource update expected before
        year end
       Phase III drill program to
        commence in Q1 2013
       PEA planned for H1 2013
                                                                                                                                              18
* Silver equivalency includes silver, gold and copper and excludes lead, zinc, molybdenum and tungsten values. Ag:Au is 50:1, Ag:Cu is 86:1
19
CUT OFF                                                                      CONTAINED             CONTAINED              CONTAINED             CONTAINED
                                                TONNES           AG           AU
 CATEGORY**               GRADE (AG                                                        CU %           AG OZ                 AU OZ                  CU LBS              AG EQ. OZ*
                                                 (000’s)         GPT          GPT
                          EQ.* GPT)                                                                       (000’s)               (000’s)                (000’s)               (000’s)
                                15               57,940          28.0         0.18         0.21             51,348                 333.4               270,296                101,918
 INFERRED***
                                30               35,500          39.0         0.22         0.30             44,300                 246.0               237,500                 86,400
* Silver equivalency includes silver, gold and copper and excludes lead, zinc, molybdenum and tungsten values. Ag:Au is 50:1, Ag:Cu is 86:1, based on 5 year historic metal price trends of
US$24/oz silver, US$1200/oz gold, US$3/lb copper. 100% metallurgical recovery is assumed.
**Classified by EBA, A Tetra Tech Company and conforms to NI 43-101, 43-101CP, and CIM definitions for resources. All numbers are rounded.
***Inferred Resources have been estimated from geological evidence and limited sampling and must be treated with a lower level of confidence than Measured and Indicated Resources.           20
Cut Off Grade >15 gpt Ag Eq.*
                                  Tonnes: 57.9 Million
                                  Grade:     56 gpt Ag Eq
                                  Ag Eq Oz: 101.9 Million

     Potential Open Pit
0   100m


                                  Cut Off Grade >30 gpt Ag Eq.*
                                  Tonnes: 35.5 Million
                                  Grade:     76 gpt Ag Eq
                                  Ag Eq Oz: 86.4 Million


                          *see La Joya “Resource Estimate” slide for Ag Eq.;
     Potential Open Pit    Resource estimates are not pit constrained
                                                                               21
22
23
   Strong Balance Sheet & Cash Flow
   Steady Production Achieved
   Low Cost Producer
   Production Expansion Underway
   Resource Base Expansion Underway


   Annual Production & Financial Statements
   Expansion Plan Updates - PFS early 2013
   Santa Elena Exploration Results
   Cruz de Mayo - PFS Q4|2012
   La Joya Drilling Updates
   La Joya Resource Update by year end 2012
   La Joya PEA planned H1/2013
                                               24
Peer Comparables (Mexico Focused) – December 2012
            SilverCrest is undervalued compared to its peers on a P/NAV per share and Mkt. Cap/oz Ag Eq. basis

                                                  P/NAV                                      Mkt. Cap/Oz Ag Eq. ($/oz)
                               Orko Silver                                        1.5x      Great Panther                                    $7.53


                          Endeavour Silver                                 1.1x           Endeavour Silver                           $4.80


                            Great Panther                           1.0x                          Fortuna                        $4.26


                                  Fortuna                           0.9x                          Primero                    $3.53


                            Timmins Gold                        0.8x                        Timmins Gold                 $2.82


                                  Primero                    0.7x                                 Aurcana            $1.94


                                  Aurcana                    0.7x                              SilverCrest       $1.76


                               SilverCrest               0.6x
                                                                                           Scorpio Mining      $1.28     SVL Re-rating Potential

                                                                                               Orko Silver   $0.87
                           Scorpio Mining             0.5x      SVL Re-rating Potential

                                     Average = 0.9x                                            Average = $3.38/oz Ag Eq.
Source: corporate disclosure and select street research, December 12, 2012                                                                           25
Tel: (604) 694-1730
 Toll Free: 1-866-691-1730
    Fax: (604) 694-1761
  info@silvercrestmines.com
  www.silvercrestmines.com

Suite 501 - 570 Granville Street
    Vancouver, BC V6C 3P1
 TSX.V: SVL | NYSE MKT: SVLC


                                   26

SilverCrest Mines | Corporate Presentation | December 2012

  • 2.
    The information providedin this presentation is not intended to be a comprehensive review of all matters and developments concerning the Company. It should be read in conjunction with all other disclosure documents of the Company. The information contained herein is not a substitute for detailed investigation or analysis. No securities commission or regulatory authority has reviewed the accuracy or adequacy of the information presented. FORWARD-LOOKING STATEMENTS This presentation contains “forward‐looking statements” within the meaning of Canadian securities legislation and the United States Securities Litigation Reform Act of 1995. Such forward‐looking statements concern the Company’s anticipated results and developments in the Company’s operations in future periods, planned exploration and development of its properties, plans related to its business and other matters that may occur in the future. These statements relate to analyses and other information that are based on expectations of future performance, including silver and gold production and planned work programs. Statements concerning reserves and mineral resource estimates may also constitute forward‐looking statements to the extent that they involve estimates of the mineralization that will be encountered if the property is developed and, in the case of mineral reserves, such statements reflect the conclusion based on certain assumptions that the mineral deposit can be economically exploited. Forward‐looking statements are subject to a variety of known and unknown risks, uncertainties and other factors which could cause actual events or results to differ from those expressed or implied by the forward‐looking statements, including, without limitation: risks related to precious and base metal price fluctuations; risks related to fluctuations in the currency markets (particularly the Mexican peso, Canadian dollar and United States dollar); risks related to the inherently dangerous activity of mining, including conditions or events beyond our control, and operating or technical difficulties in mineral exploration, development and mining activities; uncertainty in the Company’s ability to raise financing and fund the exploration and development of its mineral properties; uncertainty as to actual capital costs, operating costs, production and economic returns, and uncertainty that development activities will result in profitable mining operations; risks related to reserves and mineral resource figures being estimates based on interpretations and assumptions which may result in less mineral production under actual conditions than is currently estimated and to diminishing quantities or grades of mineral reserves as properties are mined; risks related to governmental regulations and obtaining necessary licenses and permits; risks related to the business being subject to environmental laws and regulations which may increase costs of doing business and restrict our operations; risks related to mineral properties being subject to prior unregistered agreements, transfers, or claims and other defects in title; risks relating to inadequate insurance or inability to obtain insurance; risks related to potential litigation; risks related to the global economy; risks related to the Company’s status as a foreign private issuer in the United States; risks related to all of the Company’s properties being located in Mexico and El Salvador, including political, economic, social and regulatory instability; and risks related to officers and directors becoming associated with other natural resource companies which may give rise to conflicts of interests. Should one or more of these risks and uncertainties materialize, or should underlying assumptions prove incorrect, actual results may vary materially from those describedin the forward‐looking statements. The Company’s forward‐looking statements are based on beliefs, expectations and opinions of management on the date the statements are made. For the reasons set forth above, investors should not place undue reliance on forward‐looking statements. he information contained herein is nota a substitute for detailed investigation or analysis. No securities commission or regulatory authority has reviewed the accuracy or adequacy of the information presented. All monetary figures are expressed in United States dollars unless otherwise specified. Under National Instrument (NI 43-101) Standards of Disclosure for Mineral Projects, the Qualified Person for this presentation is N. Eric Fier, CPG, P.Eng. and Chief Operating Officer for SilverCrest Mines Inc., who has reviewed and approved its contents. 2
  • 3.
    J. Scott Drever,President (45 years experience) Strategic Planning, Mergers & Acquisitions. Management and operational experience with several production companies, including Placer Dome and Blackdome Mining. Barney Magnusson, CFO (35 years experience) Served as an Officer and Director of 6 mining (Dayton Mines, High River Gold Mines) companies that developed, constructed or operated 8 precious metals mines in North and South America. N. Eric Fier, CPG, P.Eng., COO (25 years experience) Operations, Project Evaluation & Management. Previously with Newmont Mining, Eldorado Gold, Pegasus Gold Corp. Involvement in construction and operations of 3 previous mines. Several major international discoveries. Brent McFarlane, VP Operations (25 years experience) Managed all phases of open pit and underground mining projects and instrumental in leading Mexican and Int’l projects through feasibility, construction, and production while working for Minefinders, Kappes Cassiday, TVI Pacific, Marston, and Pegasus Gold. Graham C. Thody, Director (30 years experience) Corp. finance and public company management. Director and President of UEX Corp., Chairman of the Board of Geologix. George W. Sanders, Director (30 years experience) Experience in mining and exploration finance. Previously with Canaccord Capital Corp., Richmont Mines Inc., Consolidated Cinola Mines Ltd., and Shore Gold Inc. Ross Glanville, Director (40 years experience) Experience in mining, exploration finance, valuations and fairness opinions. Director of Archon Minerals Limited, Clifton Star Resources Inc. and Starfield Resources Inc. 3
  • 4.
    Nine Months Ended2012 Revenue $52.3 Million Cash Flow $29.2 Million - $ 0.33/share Earnings $17.7 Million - $ 0.20/share Santa Elena Mine, Cash (Sep 30, 2012) $37.9 Million Sonora Mexico Operating Cash Cost $7.16/Ag Eq oz* 2012 Production Est. 2.2 million oz AgEq* Resource Base: Probable 21.7 million oz AgEq* Santa Elena Indicated 9.2 million oz AgEq* Cruz de Mayo Inferred 125.9 million oz AgEq* La Joya New Major Ag-Cu-Au Discovery & Growing La Joya Project * Silver Equivalency based on Ag:Au is 55:1 except for La Joya which is Ag:Au 50:1 and Ag:Cu 86:1 4
  • 5.
    SVL Share Structure Trading Summary Issued & Outstanding 105,867,129 3 Month Ave. Daily Volume 460,924 Warrants & Options 8,335,300 52 Week High/Low CAD $3.17/$1.55 Fully Diluted Shares 114,202,429 Share Price (Dec 07, 2012) CAD $2.57 Average Warrant Price CAD $1.60 Market Cap CAD $272M Average Option Price CAD $1.31 Cash $47M Management & Key Shareholders (Fully Diluted) J. Scott Drever, President 2,691,226 Barney Magnusson, CFO 2,870,727 N. Eric Fier, COO 2,457,027 Sprott Asset Management 8.0% Libra Advisors 5.4% AGF & Wellington Mgmt. 3.0% Independent Directors 1,885,500
  • 6.
    CONTAINED CONTAINED CONTAINED CONTAINED CATEGORY TONNES AU GPT AG GPT CU % AU OZ AG OZ CU LBS AG EQ. OZ* SANTA ELENA OPEN PIT RESERVES** PROBABLE 3,459,200 1.96 87.3 217,800 9,713,600 21,694,900 SANTA ELENA UNDERGROUND RESOURCES*** INDICATED 991,100 1.83 109.1 58,330 3,476,960 6,685,110 INFERRED 1,879,000 1.53 86.9 92,470 5,250,190 10,336,040 CRUZ DE MAYO RESOURCES**** INDICATED 1,141,000 0.06 64.2 2,300 2,353,400 2,479,900 INFERRED 6,065,000 0.07 66.5 13,300 12,967,100 13,698,600 LA JOYA***** INFERRED 57,940,000 0.18 28 0.21 333,400 51,348,000 270,296,000 101,918,000 TOTALS TOTAL PROBABLE 3,459,200 1.96 87.3 217,800 9,713,600 21,694,900 TOTAL INDICATED 2,132,100 0.88 85.1 60,630 5,830,360 9,165,010 TOTAL INFERRED 65,884,000 0.21 32.8 0.21 439,170 69,565,290 270,296,000 125,952,640 *Silver Equivalency based on Ag:Au is 55:1 except for La Joya (see below). **based on $1,000/oz of gold and $18/oz of silver, cut-off grade of 0.38 gpt gold equivalent with applied metallurgical recoveries. Estimated 1,336,000 ore tonnes mined at Santa Elena in 2010 and 2011 grading 1.50 gpt Au and 43.5 gpt Ag and subtracted from Probable Reserves. All numbers are rounded. Excludes potential metal inventory for leach pad re- treatment during Expansion. ***based on $1,000/oz of gold and $18/oz of silver, cut-off grade is 1.77 gpt gold equivalent with applied metallurgical recoveries. ****based on a silver cut-off grade of 30 gpt, 100% metallurgical recovery is assumed. This is presented in the 2007 Fier and Stewart Technical Report. *****Silver equivalency for La Joya includes silver, gold and copper and excludes lead, zinc, molybdenum and tungsten values. Ag:Au is 50:1, Ag:Cu is 86:1, based on 5 year historic metal price trends of US$24/oz silver, US$1200/oz gold, US$3/lb copper. 100% metallurgical recovery is assumed. Inferred Resources have been estimated from geological evidence and limited sampling and must be treated with a lower level of confidence than Indicated Resources. 6
  • 7.
  • 8.
  • 9.
    Santa Elena MineOperating Highlights Q1 2012 Q2 2012 Q3 2012 YTD 2012 Silver ounces produced 134,528 139,850 151,368 425,746 Gold ounces produced 9,405 8,584 7,184 25,173 Silver equivalent ounces produced (1) 616,668 646,553 519,587 1,782,808 Silver ounces sold 139,771 124,739 152,088 416,598 Gold ounces sold 9,788 8,679 7,923 26,390 Silver equivalent ounces sold (1) 641,546 637,079 558,185 1,836,767 Tonnes ore mined 263,424 269,802 266,534 799,760 Tonnes waste mined 1,439,330 1,283,493 985,293 3,708,116 Waste / ore ratio 5.46 4.76 3.70 4.64 Ore tonnes crushed 264,977 317,958 265,598 848,533 Average ore tonnes crushed per day 2,912 3,494 2,887 3,097 Average silver ore grade (gpt) loaded on pad 44.13 39.45 48.41 43.72 Average gold ore grade (gpt) loaded on pad 1.61 1.35 1.37 1.44 Silver ounces delivered to pad 375,987 403,264 413,426 1,192,677 Gold ounces delivered to pad 13,762 13,764 11,681 39,207 Ag : Au Ratio (1) 51.2:1 59:1 51.2:1 53.9:1 (1) Silver equivalence is a weighted volume average based on market spot prices per ounces of gold and silver at the quarter end dates. (2) (1) Silver equivalence is based on market spot prices per ounce of silver and gold at the quarter end dates. All numbers are rounded. 9
  • 10.
    Ounces Silver and Silver Equivalent Production Au : Ag - 55:1 3,000,000 2,500,000 2,000,000 1,500,000 1,000,000 18.7k oz 8.5k oz 500,000 - - - - - - 2011 2012 2013 2014 2015 2016 2017 Sandstorm Gold Stream Macquarie Gold Hedge Facility Market Spot Price Note: Bought Deal Financing 13,529,750 Units (incl. overallotment) @ $2.55 to eliminate the balance 29,000oz of the gold hedge facility, settled in cash for $23.3 million. 10
  • 11.
    • Develop UndergroundResource (2012 to 2022) 2012-2013 Decline ramp, UG development and Drilling 2012-2013 Construct 3,000 tonnes per day conventional mill Early 2014 Mill feed from Open Pit and Underground • Cruz de Mayo Development (2011 to 2017) 2011-2012 Pre Feasibility underway Early 2015 Open-pit Ag resource for Heap Leach & SE Mill feed • Reprocess Leach Pad Material (2014 to 2022) • Estimated Expansion Capex: $65M by Q1 2014 2012: Est. 2.2 million oz Ag Eq* 2014: 3.5 to 4.5 million oz Ag Eq* * Silver Equivalency based on Ag:Au is 55:1 11
  • 12.
    Underground Decline Portal Open Pit Waste Dump Future Crushing Circuit Leach Pad Leach Pad Phase 1 Phase 2 Future CCD Circuit , 3000 tpd Merrill Crowe Plant 12
  • 13.
     3,000 to3,500 tpd: Average 4.0M to 5.0M oz Ag equivalent per year.  Initial capital costs: $84M (25% contingency), potential reduction in PFS to $65M  Est. cash operating costs: $9.70 per ounce of Ag equivalent. Expansion Plan – Silver and Gold Price Sensitivities Average Gold Average Pre-Tax Net Cash Pre- Tax NPV Case Price Silver Price Flow @ 5% Discount ( millions) ( millions) Low $800 $14 $47.5 $34.1 Base $1,000 $18 $169.5 $131.2 Current Prices (1) $1,450 $38 $620.6 $491.4 High $1,600 $50 $856.5 $680.1 (1) At the time of the study, April 1, 2011: PEA for the Santa Elena and Cruz de Mayo Expansion Project – NI 43-101 Technical Report 13
  • 14.
    La Joya &Santa Elena Potential Additions CURRENTLY Open Pit = 2011 to 2014, Underground = 2014 to 2022, Cruz de Mayo = 2015 to 2017, Leach Pad Reprocess = 2014 to 2022. Based on PEA 2011 results. Revisions are anticipated in the 2013 Expansion Plan PFS 14
  • 15.
    A’ Decline Portal N A 100m Santa Elena Pit SE U/G RESERVE DRILLING (ONGOING) SE U/G SOUTH SE DEEP (ONGOING) 15
  • 16.
  • 17.
    100% owned (18,000+ ha)  Near Surface Resource Conceptual Open Pit  Strip ratio approximately 2:1  Indicated Resource 2,353,400 oz Ag, 2,300 oz Au  Inferred Resource 12,967,100 oz Ag, 13,300 oz Au  Potential for Resource Expansion  65 km - Road distance from Santa Elena  Pre-Feasibility level work under way (incl. a completed 50-hole drill program) 17
  • 18.
    Excellent access and infrastructure  Nearby operating mines  Purchase Agreement to acquire 100%, $4.18 million over 3 yrs w/2% NSR ($340K paid)  Historic work by Luismin (Goldcorp); 51 holes used in compilation  Similar geology and mineralization to nearby Sabinas Mine  102 Million oz AgEq* Inferred Resource  Up to $6m Phase II, 100 drill hole program nearing completion  Resource update expected before year end  Phase III drill program to commence in Q1 2013  PEA planned for H1 2013 18 * Silver equivalency includes silver, gold and copper and excludes lead, zinc, molybdenum and tungsten values. Ag:Au is 50:1, Ag:Cu is 86:1
  • 19.
  • 20.
    CUT OFF CONTAINED CONTAINED CONTAINED CONTAINED TONNES AG AU CATEGORY** GRADE (AG CU % AG OZ AU OZ CU LBS AG EQ. OZ* (000’s) GPT GPT EQ.* GPT) (000’s) (000’s) (000’s) (000’s) 15 57,940 28.0 0.18 0.21 51,348 333.4 270,296 101,918 INFERRED*** 30 35,500 39.0 0.22 0.30 44,300 246.0 237,500 86,400 * Silver equivalency includes silver, gold and copper and excludes lead, zinc, molybdenum and tungsten values. Ag:Au is 50:1, Ag:Cu is 86:1, based on 5 year historic metal price trends of US$24/oz silver, US$1200/oz gold, US$3/lb copper. 100% metallurgical recovery is assumed. **Classified by EBA, A Tetra Tech Company and conforms to NI 43-101, 43-101CP, and CIM definitions for resources. All numbers are rounded. ***Inferred Resources have been estimated from geological evidence and limited sampling and must be treated with a lower level of confidence than Measured and Indicated Resources. 20
  • 21.
    Cut Off Grade>15 gpt Ag Eq.* Tonnes: 57.9 Million Grade: 56 gpt Ag Eq Ag Eq Oz: 101.9 Million Potential Open Pit 0 100m Cut Off Grade >30 gpt Ag Eq.* Tonnes: 35.5 Million Grade: 76 gpt Ag Eq Ag Eq Oz: 86.4 Million *see La Joya “Resource Estimate” slide for Ag Eq.; Potential Open Pit Resource estimates are not pit constrained 21
  • 22.
  • 23.
  • 24.
    Strong Balance Sheet & Cash Flow  Steady Production Achieved  Low Cost Producer  Production Expansion Underway  Resource Base Expansion Underway  Annual Production & Financial Statements  Expansion Plan Updates - PFS early 2013  Santa Elena Exploration Results  Cruz de Mayo - PFS Q4|2012  La Joya Drilling Updates  La Joya Resource Update by year end 2012  La Joya PEA planned H1/2013 24
  • 25.
    Peer Comparables (MexicoFocused) – December 2012 SilverCrest is undervalued compared to its peers on a P/NAV per share and Mkt. Cap/oz Ag Eq. basis P/NAV Mkt. Cap/Oz Ag Eq. ($/oz) Orko Silver 1.5x Great Panther $7.53 Endeavour Silver 1.1x Endeavour Silver $4.80 Great Panther 1.0x Fortuna $4.26 Fortuna 0.9x Primero $3.53 Timmins Gold 0.8x Timmins Gold $2.82 Primero 0.7x Aurcana $1.94 Aurcana 0.7x SilverCrest $1.76 SilverCrest 0.6x Scorpio Mining $1.28 SVL Re-rating Potential Orko Silver $0.87 Scorpio Mining 0.5x SVL Re-rating Potential Average = 0.9x Average = $3.38/oz Ag Eq. Source: corporate disclosure and select street research, December 12, 2012 25
  • 26.
    Tel: (604) 694-1730 Toll Free: 1-866-691-1730 Fax: (604) 694-1761 info@silvercrestmines.com www.silvercrestmines.com Suite 501 - 570 Granville Street Vancouver, BC V6C 3P1 TSX.V: SVL | NYSE MKT: SVLC 26