Download to read offline


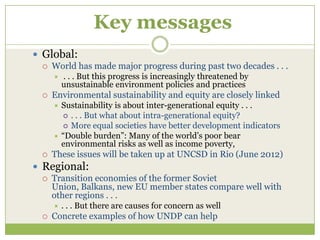
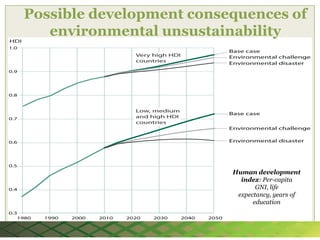
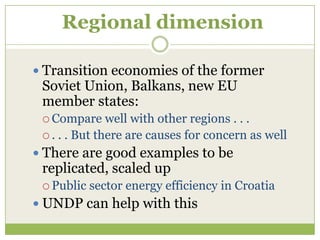
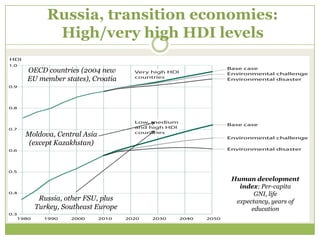
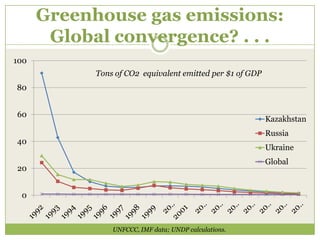
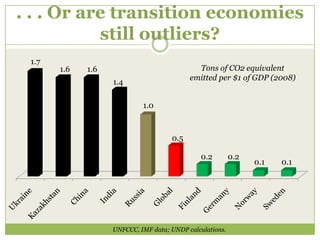
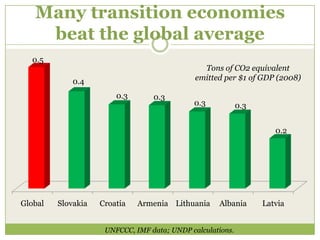
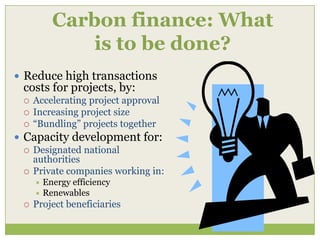
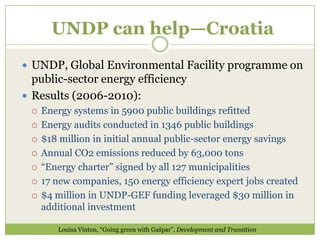
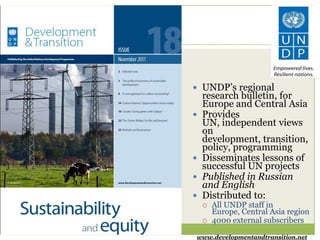
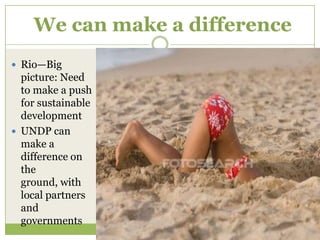

The document discusses several key messages about environmental sustainability globally and regionally. Globally, while progress has been made in human development, this progress is threatened by unsustainable environmental policies. Environmental sustainability and equity are closely linked. The transition economies of the former Soviet Union compare well to other regions but also have some concerns. Specific examples show how UNDP can help countries address issues like energy efficiency.


![Hdr 20072008 Presentation[1]](https://cdn.slidesharecdn.com/ss_thumbnails/HDR20072008presentation1-123602819722-phpapp02-thumbnail.jpg?width=640&height=640&fit=bounds)


