Downloaded 97 times


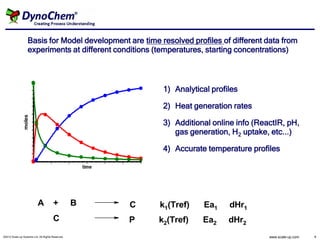

![Sources of ΔHR data
The standard sources of ΔHR are experimental data from
Reaction Calorimeters for desired reaction conditions
DSC and Adiabatic Calorimeters for exploring Process
Safety (potential runaway reactions)
The Mettler RC1 benchmark Reaction Calorimeter
generates heat flow profiles, which can be entered into
DynoChem
Reaction Rate Exp. kref Ea
A + B --> P k [A] [B] k> 0.0027 L/mol.s Ea> 59.997 kJ/mol
A + P --> SP k [A] [P] k> 5.025E-4 L/mol.s Ea> 90.011 kJ/mol
©2012 Scale-up Systems Ltd. All Rights Reserved. www.scale-up.com 7](https://image.slidesharecdn.com/susi-mt-sept25-2012-121005094205-phpapp01/85/Scale-up-Systems-India-Mettler-RC1-Sanket-Salgaonkar-7-320.jpg)
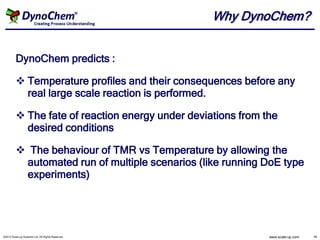
![Using RC1 Data
Reaction Rate Exp. kref Tref Ea
A + B --> P k [A] [B] k> 0.0027 L/mol.s 60.0 C Ea> 59.997 kJ/mol
A + P --> SP k [A] [P] k> 5.025E-4 L/mol.s 60.0 C Ea> 90.011 kJ/mol
RC1 run
70.0
Bulk liquid.Temperature (Imp) (C)
A feed.Qv (Imp) (ml/min)
Bulk liquid.Qr (Exp) (J/s)
56.0 Bulk liquid.Qr (J/s)
42.0
Qr = r ΔHr V, where r is the
reaction rate of this
reaction.
28.0
Qr = (Σri ΔHri ) V, since a
calorimeter measures
14.0
the sum of all the heat
flows.
0.0
0.0 60.0 120.0 180.0 240.0 300.0
Time (min)
©2012 Scale-up Systems Ltd. All Rights Reserved. www.scale-up.com 8](https://image.slidesharecdn.com/susi-mt-sept25-2012-121005094205-phpapp01/85/Scale-up-Systems-India-Mettler-RC1-Sanket-Salgaonkar-8-320.jpg)


This document discusses the use of DynoChem software for modeling chemical processes. DynoChem can be used to develop process models based on experimental data from sources like reaction calorimeters. It allows modeling heat flows and predicting temperature profiles. This helps understand the process and enables process safety evaluations through what-if scenario analysis, like investigating the impact of loss of cooling capacity. DynoChem facilitates scale-up and process optimization by predicting large scale process performance based on the developed models.


