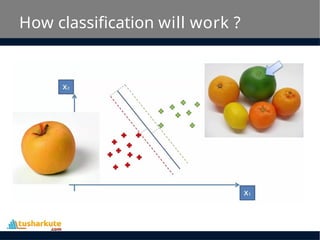
What is supportvector?
• “Support Vector Machine” (SVM) is a supervised
machine learning algorithm which can be used
for both classification or regression challenges.
However, it is mostly used in classification
problems.
• In this algorithm, we plot each data item as a
point in n-dimensional space (where n is number
of features you have) with the value of each
feature being the value of a particular
coordinate.
• Then, we perform classification by finding the
hyperplane that differentiate the two classes
very well.
3.
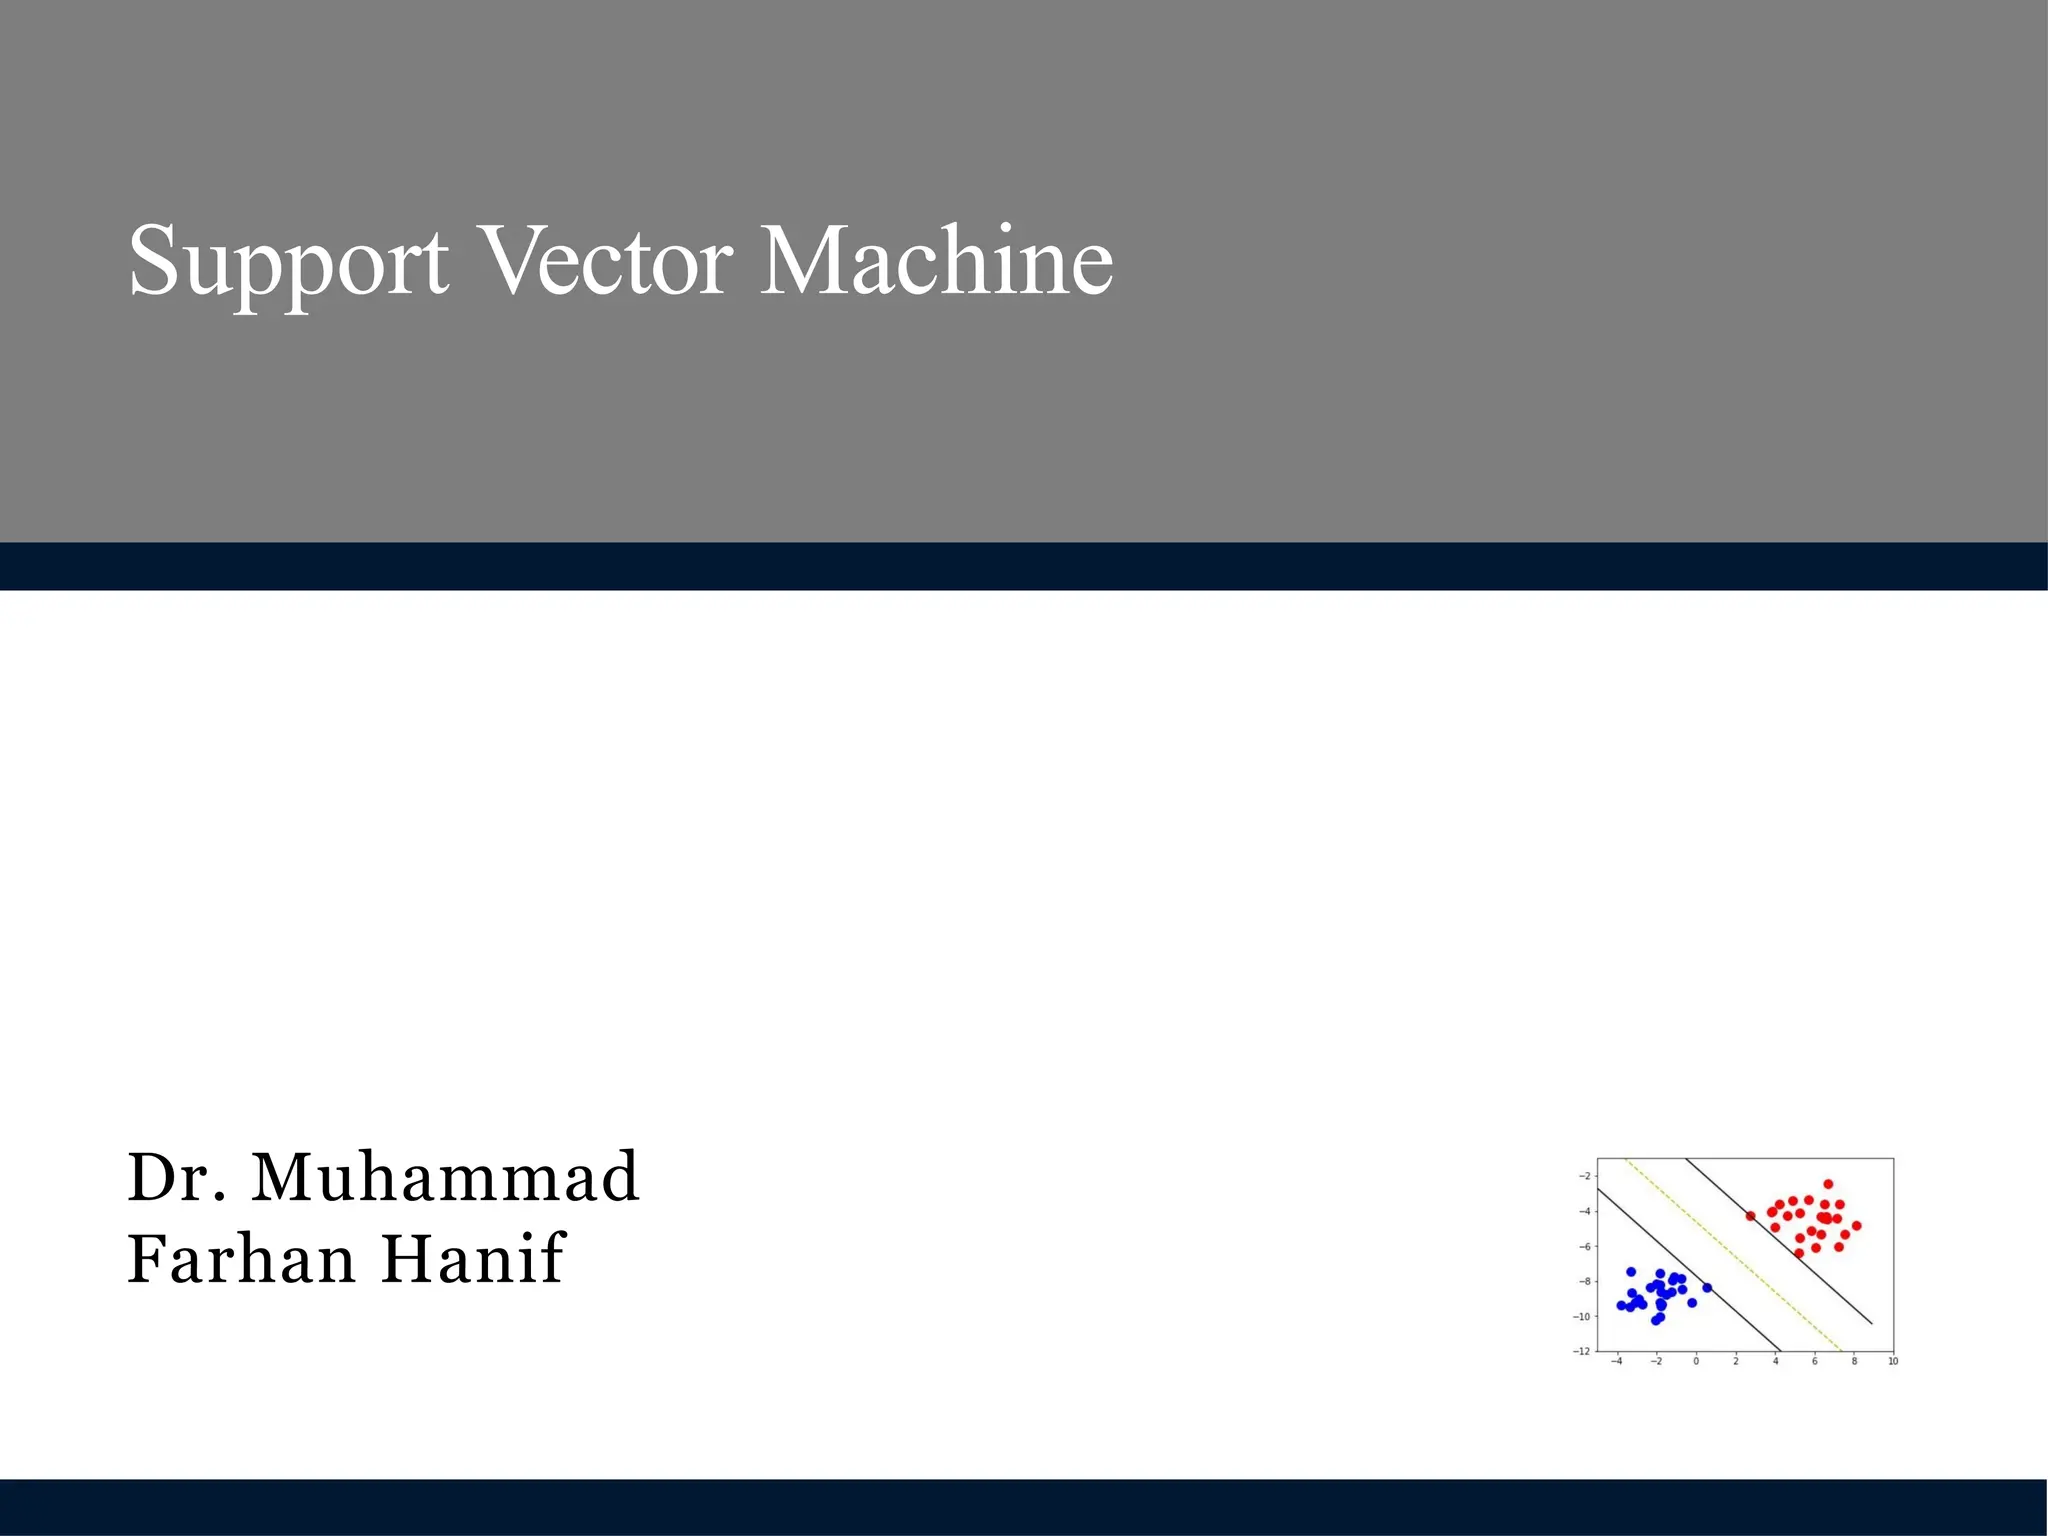
Support Vector Machine
•Generally, Support Vector Machines is considered to
be a classification approach, it but can be employed in
both types of classification and regression problems.
• It can easily handle multiple continuous and
categorical variables.
• SVM constructs a hyperplane in multidimensional
space to separate different classes. SVM generates
optimal hyperplane in an iterative manner, which is
used to minimize an error.
• The core idea of SVM is to find a maximum
marginal hyperplane(MMH) that best divides
the dataset into classes.
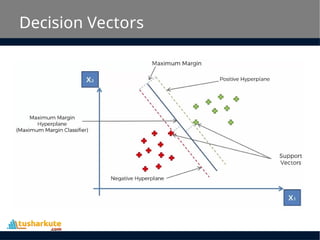
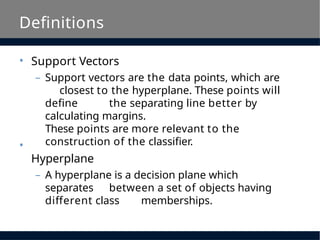
Definitions
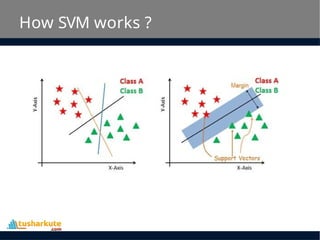
• Support Vectors
–Support vectors are the data points, which are
closest to the hyperplane. These points will
define the separating line better by
calculating margins.
These points are more relevant to the
construction of the classifier.
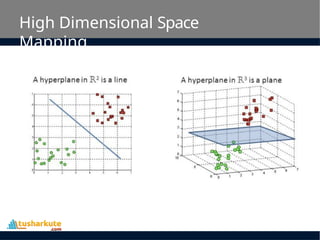
Hyperplane
– A hyperplane is a decision plane which
separates between a set of objects having
different class memberships.
•
6.
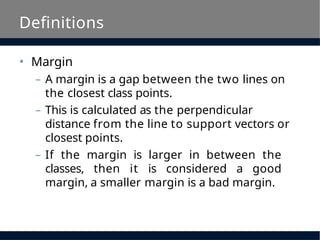
Definitions
• Margin
– Amargin is a gap between the two lines on
the closest class points.
– This is calculated as the perpendicular
distance from the line to support vectors or
closest points.
– If the margin is larger in between the
classes, then it is considered a good
margin, a smaller margin is a bad margin.
7.
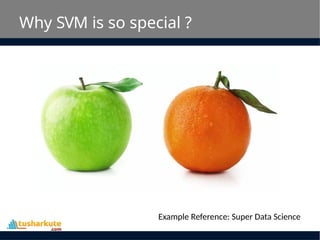
Why SVM isso special ?
Example Reference: Super Data Science
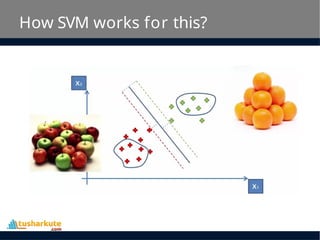
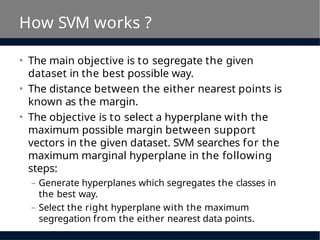
How SVM works?
• The main objective is to segregate the given
dataset in the best possible way.
• The distance between the either nearest points is
known as the margin.
• The objective is to select a hyperplane with the
maximum possible margin between support
vectors in the given dataset. SVM searches for the
maximum marginal hyperplane in the following
steps:
– Generate hyperplanes which segregates the classes in
the best way.
– Select the right hyperplane with the maximum
segregation from the either nearest data points.
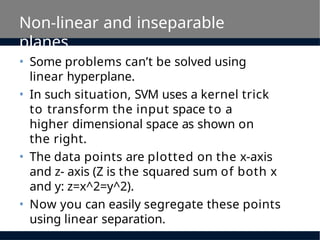
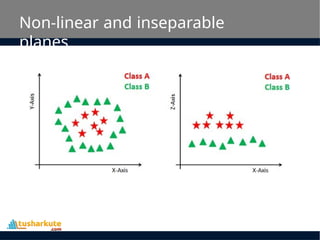
Non-linear and inseparable
planes
•Some problems can’t be solved using
linear hyperplane.
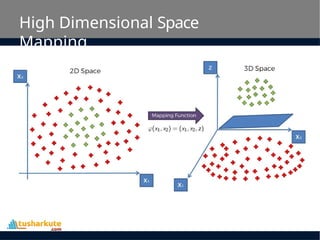
• In such situation, SVM uses a kernel trick
to transform the input space to a
higher dimensional space as shown on
the right.
• The data points are plotted on the x-axis
and z- axis (Z is the squared sum of both x
and y: z=x^2=y^2).
• Now you can easily segregate these points
using linear separation.
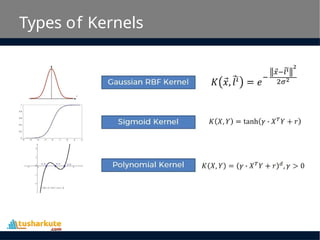
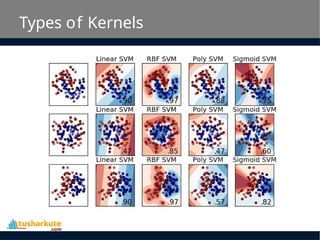
SVM Kernels
• TheSVM algorithm is implemented in practice using
a kernel. A kernel transforms an input data space
into the required form.
• SVM uses a technique called the kernel trick. Here,
the kernel takes a low-dimensional input space and
transforms it into a higher dimensional space.
• In other words, you can say that it converts non-
separable problem to separable problems by adding
more dimension to it.
• It is most useful in non-linear separation problem.
Kernel trick helps you to build a more accurate
classifier.
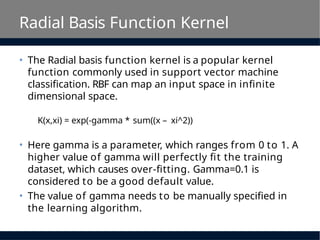
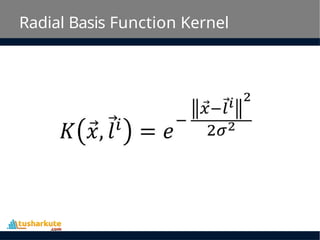
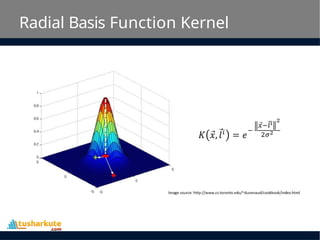
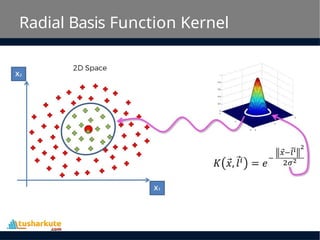
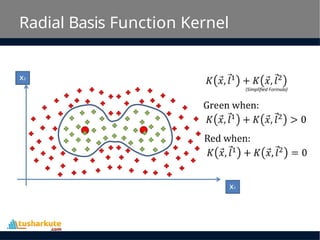
Radial Basis FunctionKernel
• The Radial basis function kernel is a popular kernel
function commonly used in support vector machine
classification. RBF can map an input space in infinite
dimensional space.
K(x,xi) = exp(-gamma * sum((x – xi^2))
• Here gamma is a parameter, which ranges from 0 to 1. A
higher value of gamma will perfectly fit the training
dataset, which causes over-fitting. Gamma=0.1 is
considered to be a good default value.
• The value of gamma needs to be manually specified in
the learning algorithm.
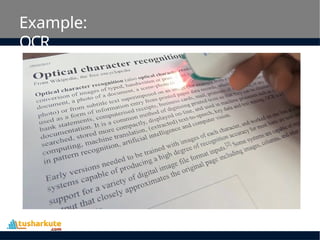
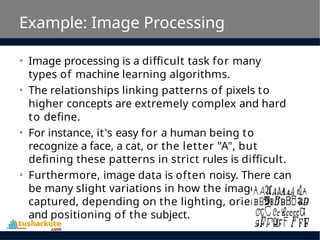
Example: Image Processing
•Image processing is a difficult task for many
types of machine learning algorithms.
• The relationships linking patterns of pixels to
higher concepts are extremely complex and hard
to define.
• For instance, it's easy for a human being to
recognize a face, a cat, or the letter "A", but
defining these patterns in strict rules is difficult.
• Furthermore, image data is often noisy. There can
be many slight variations in how the image was
captured, depending on the lighting, orientation,
and positioning of the subject.
27.
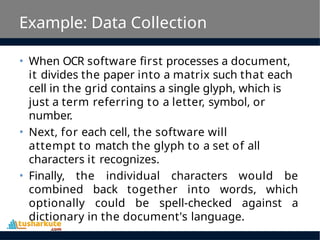
Example: Data Collection
•When OCR software first processes a document,
it divides the paper into a matrix such that each
cell in the grid contains a single glyph, which is
just a term referring to a letter, symbol, or
number.
• Next, for each cell, the software will
attempt to match the glyph to a set of all
characters it recognizes.
• Finally, the individual characters would be
combined back together into words, which
optionally could be spell-checked against a
dictionary in the document's language.
28.
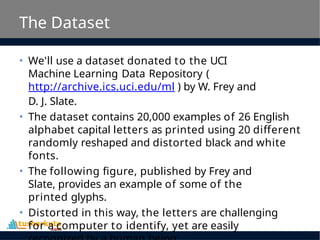
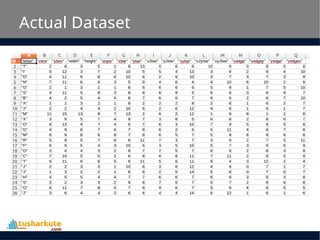
The Dataset
• We'lluse a dataset donated to the UCI
Machine Learning Data Repository (
http://archive.ics.uci.edu/ml ) by W. Frey and
D. J. Slate.
• The dataset contains 20,000 examples of 26 English
alphabet capital letters as printed using 20 different
randomly reshaped and distorted black and white
fonts.
• The following figure, published by Frey and
Slate, provides an example of some of the
printed glyphs.
• Distorted in this way, the letters are challenging
for a computer to identify, yet are easily