This document discusses the differences between subtypes and roles in data modeling. Exclusive subtypes, where an entity can only be one subtype, are more common than inclusive subtypes, where an entity can be multiple subtypes. Inclusive subtypes can create complexity and ambiguity. Modeling entities as roles rather than subtypes, such as modeling a customer as a role rather than a subtype of person, results in a simpler model that better captures the semantics and relationships between entities. Role-based modeling avoids issues like data duplication and relationship complexity that can occur with subtype modeling.
Data Modeling and Database Design 2nd Edition by Umanath Scamell Solution Manualendokayle
link full download: https://testbankstudy.com/product/data-modeling-and-database-design-2nd-edition-by-umanath-scamell-solution-manual/
Language: English
ISBN-10: 1285085256
ISBN-13: 978-1285085258
ISBN-13: 9781285085258
The sole purpose of sharing these slides are to educate the beginners of IT and Computer Science/Engineering. Credits should go to the referred material and also CICRA campus, Colombo 4, Sri Lanka where I taught these in 2017.
If find how to create
E-R Diagrams ? Here is a Doc making things for you simple and easy .
Entity Relationship Diagrams (ERDs) illustrate the logical structure of databases.
I find many students find uneasiness in creating ER-Diagrams conceptually , but they understand how to create tables and columns for a Software project . Here is an approach creating to first create Tables and from tables ..ER Diagrams
Running head DATABASE PROJECT 1DATABASE PROJECT 1Database S.docxtodd271
Running head: DATABASE PROJECT 1
DATABASE PROJECT 1
Database Systems Project
Connie G Farris
Colorado Technical University
Advanced Database Systems
(CS352-1804A-01)
Jeffrey Karlberg
Database Systems Project
Table of Contents
Database Systems Project 1
Project Outline 3
A description of the 3-level ANSI architecture model 4
A description of data independence 5
The difference in responsibility between Data administrator and Database administrator 6
ERD Screenshot 7
A description about the relationship setup and multiplicity………………….8
References: 11
Project OutlineOur company desires to consolidate the database for the company and acquire a database warehouse. Over the time frame of this course we will research all the elements of the proper database for this company, each week we will examine different components until we compile the final production.
A description of the 3-level ANSI architecture model
Data storage is a complex affair. Data is stored in form of bits where there are different levels of architecture involved. The following are levels of architecture used in data storage. External level is the top level in the architecture of the database management system. It is the level in which end users access data. The data in this level is simple as the end user does not need to understand data complexity. Data in the external level is viewed separately by users depending on their access rights. Conceptual level is the middle level is the database architecture. It the level that determines what data can be stored in the database. Conceptual level also defines the relationship among the stored data. This level of the database is managed by the database administrator (Kroenke, Auer, Vandenberg & Yoder, 2018). . Internal level defines how data is stored on the secondary storage devices. This data is organized in form of folders and files. The internal level is tasked with providing the storage spaces needed to store data
A description of data independence
Data independence is the ability of making changes in one level of the database without making changes in the other levels. Databases with levels or layers make data independence possible. In databases that are not layered, any changes made affect the entire database and thus data independence cannot be achieved. Data independence could also be defined as the separation of data and the applications that process it. There are two types of data dependence; logical and physical data independence. Logical data independence is the process of modifying data patterns without affecting the programs that they run on. It refers to changes made in conceptual level of the database (Mullins, 2012). These changes do not affect the view of data at the external level. Logical data independence is relatively difficult to achieve. Physical data independence is the process of making changes in the internal level of the database without these changes affecting the other levels in the .
Have a Better Resume than the Other CandidatesTuan Yang
For all the money we spend on university degrees, the resume - and its LinkedIn counterpart - remains as the most important vehicle to account for how potential employers & recruiters perceive you.
In this presentation, you will learn resume techniques based upon Information Theory. Your resume is a self-promotional marketing tool that is underutilized when candidates treat it as a summary of experiences instead of a promotional marketing tool accurately reflecting how the financial value you add to the firm exceeds the financial value of your remuneration.
Agenda:
» Align your entire resume format against how recruiters scan resumes.
» Learn techniques to improve clarity of each resume bullet.
» Link resume bullets to organizational metrics & financial outcomes.
» Use Information Theory to increase gravitas of the words you choose.
Data modeling is a process used to define and analyze data requirements needed to support the business processes within the scope of corresponding information systems in organizations.
Informatica Data Modelling : Importance of Conceptual ModelsZaranTech LLC
50-55 hours Training + Assignments + Actual Project Based Case Studies
All attendees will receive,
Assignment after each module, Video recording of every session
Notes and study material for examples covered.
Access to the Training Blog & Repository of Materials
Enterprise Information SystemsTopic .docxkhanpaulita
Enterprise Information Systems
Topic 6 – Overview
Topic’s learning objectives:
· Yunnan Lucky Air Case Study
· An Empirical Study in Selecting Enterprise Resource Planning Systems
6.1 Yunnan Lucky Air Case Study
Read the case study ‘E-commerce at Yunnan Lucky Air’ by Berenguer et al 2008 and answer the following questions. The article can be found on the module website.
Questions:
i. Why is it important for Lucky Air to be a leader in IT?
ii. Consider that you worked for Yunnan Lucky Air in a role that involved technology and strategy. You have been asked to outline their future IT strategy to best utilize Web 2.0. Based on the information presented in the case study and the course material what solutions would you rcommend?
iii. Some of the advantages of using Paypal for an airline have been discussed. What could be the disadvantages?
iv. Based on what is discussed in the article and the course material how can the conversion rates of browsing and researching online be improved with a better CRM?
(
Pause for thought
Yunnan Lucky Air operated as a low cost carrier modelling itself on the American airline Soutwest. Does this mean it should also model its
IT
on Soutwest or should
it
customise it to their environment?
)
6.2 An empirical study in selecting Enterprise Resource Planning Systems
Read the case study ‘An empirical study in selecting Enterprise Resource Planning Systems Article: The relation between some of the variables involve on it. Size and Investment.’ by Pacheco-Comer and Gonzalez-Castolo, 2012, and answer the following questions. The article can be found on the module website.
Questions:
i. Explain the ‘ERP anatomy’ illustrated in figure 1. Are there alternative anatomies of an ERP?
ii. What were the empirical goals of this survey? Would you add anything to these?
iii. What were the findings of this research? Does this agree with other research on this topic?
(
Pause for thought
We have seen in a number of articles how the size of an organization impacts the choice and implementation of an ERP. We have also seen in the Lucky Air case study how IT may be important strategically. Do you believe that it is the size of the company or the
business strategy that is the deciding factor for the MIS strategy?
)
Further reading
Rainer R.K., Watson H.J. (2012) Management Information Systems: Moving Business Forward, Wiley.
Gunasekaran, A., Shea, T. (2009) Organizational Advancements through Enterprise Information Systems: Emerging Applications and Developments: IGI Global
Motiwalla, L. And Thompson, J. (2012) Enterprise Systems for Management: International Version, 2/E, Pearson Higher Education
Magal, S. R. and Word, J. (2012) Integrated Business Processes with ERP Systems, Wiley Plus course
Cruz-Cunha, M. M. (2009) Social, Managerial, and Organizational Dimensions of Enterprise Information Systems, IGI Global
Obrien, J. and Marakas G. (2007): ‘Enterprise Information Systems’.
AbstractThe American Intellectual Union collected data from its .docxannetnash8266
Abstract
The American Intellectual Union collected data from its employees and using that information it is important to examine each and every aspect of the data to get a clear picture of the makeup of the company’s employees. Throughout this report one quantitative and one qualitative variable will be analyzed.
Introduction
Gender and job satisfaction are two vital components in the workplace to help managers understand the behavior of their employees. Within the data selection, we get to choose from two points of information, qualitative and quantitative data.
Chosen Variables
There are several other variables that can be collected to be useful to a business but for the purpose of this report, it will focus only on gender and extrinsic job satisfaction.
Difference in variable types
It is important to know what the difference in the two data sets are before one can make an appropriate choice. Understanding the difference is quiet simple. Qualitative data deals with things that cannot be measured or things that are descriptive; such as smells, colors, or tastes (Bluman, 2010). One can think of it as ‘qualit’ative = ‘qualit’y. The gender is a great example of qualitative data. The codes are set to male as 1 and female as 2.
Quantitative data deals with things that are measured and numbers, such as speed, ages, height, time, length, etc. (Bluman, 2010). One can think of it as ‘quantit’ative – ‘quantit’y. The extrinsic job satisfaction shows an example of this by the values provided in a range from 1 to 7.
Mean, median, and mode are referred to as the measures of central tendency. The mean is simply the average; the sum of all the set data divided by the number of that data. The median is the middle; if the data was put in numerical order, the number in the middle would be the median. The mode is the number that appears most frequent. In some cases, it is possible to have no mode or to have more than one (Schultzkie, 2011).
Explanation of descriptive statistics
The median is 1. This measure is actually meaningless. While there’s a gender group 1, it cannot be sorted from smallest to the largest.
The mode is 1. This is useful for this group. It suggests that most of the people in this group are 1; in this case male.
The mean is 1.39. This is meaningless as well. Since there are only 2 groups, there can’t be a 1.39 group.
The standard deviation is 0.49 and the variance is 0.24.
Explanation of descriptive statistics
The median is 5.6. This is useful for this group.
The mode is 5.6. This is also useful in this group.
The mean is 5.413888889. This is valid for a variable.
The standard deviation is 0.488234591 and the variance is 0.238373016.
Description of Chart
A pie chart can be used to show part of something and how it relates to a whole. This type of chart is needed when showing percentages. It takes a circle and divides it into pieces, one per each category. The width of each piece is determined by the points in each category.
For.
GDG Cloud Southlake #33: Boule & Rebala: Effective AppSec in SDLC using Deplo...James Anderson
Effective Application Security in Software Delivery lifecycle using Deployment Firewall and DBOM
The modern software delivery process (or the CI/CD process) includes many tools, distributed teams, open-source code, and cloud platforms. Constant focus on speed to release software to market, along with the traditional slow and manual security checks has caused gaps in continuous security as an important piece in the software supply chain. Today organizations feel more susceptible to external and internal cyber threats due to the vast attack surface in their applications supply chain and the lack of end-to-end governance and risk management.
The software team must secure its software delivery process to avoid vulnerability and security breaches. This needs to be achieved with existing tool chains and without extensive rework of the delivery processes. This talk will present strategies and techniques for providing visibility into the true risk of the existing vulnerabilities, preventing the introduction of security issues in the software, resolving vulnerabilities in production environments quickly, and capturing the deployment bill of materials (DBOM).
Speakers:
Bob Boule
Robert Boule is a technology enthusiast with PASSION for technology and making things work along with a knack for helping others understand how things work. He comes with around 20 years of solution engineering experience in application security, software continuous delivery, and SaaS platforms. He is known for his dynamic presentations in CI/CD and application security integrated in software delivery lifecycle.
Gopinath Rebala
Gopinath Rebala is the CTO of OpsMx, where he has overall responsibility for the machine learning and data processing architectures for Secure Software Delivery. Gopi also has a strong connection with our customers, leading design and architecture for strategic implementations. Gopi is a frequent speaker and well-known leader in continuous delivery and integrating security into software delivery.
Accelerate your Kubernetes clusters with Varnish CachingThijs Feryn
A presentation about the usage and availability of Varnish on Kubernetes. This talk explores the capabilities of Varnish caching and shows how to use the Varnish Helm chart to deploy it to Kubernetes.
This presentation was delivered at K8SUG Singapore. See https://feryn.eu/presentations/accelerate-your-kubernetes-clusters-with-varnish-caching-k8sug-singapore-28-2024 for more details.
Epistemic Interaction - tuning interfaces to provide information for AI supportAlan Dix
Paper presented at SYNERGY workshop at AVI 2024, Genoa, Italy. 3rd June 2024
https://alandix.com/academic/papers/synergy2024-epistemic/
As machine learning integrates deeper into human-computer interactions, the concept of epistemic interaction emerges, aiming to refine these interactions to enhance system adaptability. This approach encourages minor, intentional adjustments in user behaviour to enrich the data available for system learning. This paper introduces epistemic interaction within the context of human-system communication, illustrating how deliberate interaction design can improve system understanding and adaptation. Through concrete examples, we demonstrate the potential of epistemic interaction to significantly advance human-computer interaction by leveraging intuitive human communication strategies to inform system design and functionality, offering a novel pathway for enriching user-system engagements.
Smart TV Buyer Insights Survey 2024 by 91mobiles.pdf91mobiles
91mobiles recently conducted a Smart TV Buyer Insights Survey in which we asked over 3,000 respondents about the TV they own, aspects they look at on a new TV, and their TV buying preferences.
Dev Dives: Train smarter, not harder – active learning and UiPath LLMs for do...UiPathCommunity
💥 Speed, accuracy, and scaling – discover the superpowers of GenAI in action with UiPath Document Understanding and Communications Mining™:
See how to accelerate model training and optimize model performance with active learning
Learn about the latest enhancements to out-of-the-box document processing – with little to no training required
Get an exclusive demo of the new family of UiPath LLMs – GenAI models specialized for processing different types of documents and messages
This is a hands-on session specifically designed for automation developers and AI enthusiasts seeking to enhance their knowledge in leveraging the latest intelligent document processing capabilities offered by UiPath.
Speakers:
👨🏫 Andras Palfi, Senior Product Manager, UiPath
👩🏫 Lenka Dulovicova, Product Program Manager, UiPath
Transcript: Selling digital books in 2024: Insights from industry leaders - T...BookNet Canada
The publishing industry has been selling digital audiobooks and ebooks for over a decade and has found its groove. What’s changed? What has stayed the same? Where do we go from here? Join a group of leading sales peers from across the industry for a conversation about the lessons learned since the popularization of digital books, best practices, digital book supply chain management, and more.
Link to video recording: https://bnctechforum.ca/sessions/selling-digital-books-in-2024-insights-from-industry-leaders/
Presented by BookNet Canada on May 28, 2024, with support from the Department of Canadian Heritage.
Neuro-symbolic is not enough, we need neuro-*semantic*Frank van Harmelen
Neuro-symbolic (NeSy) AI is on the rise. However, simply machine learning on just any symbolic structure is not sufficient to really harvest the gains of NeSy. These will only be gained when the symbolic structures have an actual semantics. I give an operational definition of semantics as “predictable inference”.
All of this illustrated with link prediction over knowledge graphs, but the argument is general.
GraphRAG is All You need? LLM & Knowledge GraphGuy Korland
Guy Korland, CEO and Co-founder of FalkorDB, will review two articles on the integration of language models with knowledge graphs.
1. Unifying Large Language Models and Knowledge Graphs: A Roadmap.
https://arxiv.org/abs/2306.08302
2. Microsoft Research's GraphRAG paper and a review paper on various uses of knowledge graphs:
https://www.microsoft.com/en-us/research/blog/graphrag-unlocking-llm-discovery-on-narrative-private-data/
Elevating Tactical DDD Patterns Through Object CalisthenicsDorra BARTAGUIZ
After immersing yourself in the blue book and its red counterpart, attending DDD-focused conferences, and applying tactical patterns, you're left with a crucial question: How do I ensure my design is effective? Tactical patterns within Domain-Driven Design (DDD) serve as guiding principles for creating clear and manageable domain models. However, achieving success with these patterns requires additional guidance. Interestingly, we've observed that a set of constraints initially designed for training purposes remarkably aligns with effective pattern implementation, offering a more ‘mechanical’ approach. Let's explore together how Object Calisthenics can elevate the design of your tactical DDD patterns, offering concrete help for those venturing into DDD for the first time!
Elevating Tactical DDD Patterns Through Object Calisthenics
Subtypes vs, roles
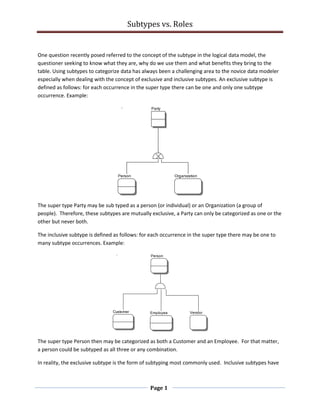
1. Subtypes vs. Roles
One question recently posed referred to the concept of the subtype in the logical data model, the
questioner seeking to know what they are, why do we use them and what benefits they bring to the
table. Using subtypes to categorize data has always been a challenging area to the novice data modeler
especially when dealing with the concept of exclusive and inclusive subtypes. An exclusive subtype is
defined as follows: for each occurrence in the super type there can be one and only one subtype
occurrence. Example:
Party
Person Organization
The super type Party may be sub typed as a person (or individual) or an Organization (a group of
people). Therefore, these subtypes are mutually exclusive, a Party can only be categorized as one or the
other but never both.
The inclusive subtype is defined as follows: for each occurrence in the super type there may be one to
many subtype occurrences. Example:
Person
Customer Employee Vendor
The super type Person then may be categorized as both a Customer and an Employee. For that matter,
a person could be subtyped as all three or any combination.
In reality, the exclusive subtype is the form of subtyping most commonly used. Inclusive subtypes have
Page 1
2. Subtypes vs. Roles
been used less and less overtime for the following reasons:
1. Data modelers have focused more on the semantics (the study of meaning) of data objects
such as entities in the data model
2. Inclusive subtypes can create complexity and ambiguity in the data model.
3. There are inherent difficulties in defining relationships between subtype entities as well as
relationships between subtype entities that are on different levels of a subtype - supertype
hierarchy.
Data modeling represents more than creating structures for databases. A logical data model must also
capture clear definitions of data objects, the relationships between data objects and the related
business rules. Identifying Customer as a subtype of person upon reflection does not accurately reflect
the semantic differences between Person and Customer. A Person is a unique human being, a single
physical object. A customer is a role that a person may play. In life and in business, people often play
multiple roles; a Person may play a role of a Customer for one or more businesses while being an
Employee of one or more businesses and additionally that customer may also be a Vendor providing
goods and/or services to a Customer.
There then is a clearly defined difference between an entity that is in a supertype subtype hierarchy and
entities that represent roles.
- Entities in a supertype – subtype represent things
- Entities that are role entities represent the roles/purposes that things serve.
So what does this matter? It’s just semantics, right?
Actually, there is a heavy price that may be paid by unclear semantics. How many tables have we seen in
systems that have a Customer table, an Employee table and a Vendor table such as the one below:
Page 2
3. Subtypes vs. Roles
Person
Customer Employee Vendor
Customer Number: INTEGER Employee Number: NUMBER(5) Vendor Number: DECIMAL(7)
Customer Name: TEXT(45) Employee First Name: VARCHAR(25) Vendor Name: VARCHAR(20)
Csustomer Street Address: VARCHAR(20) Employee Middle Initial: CHAR(1) Vendor Personal First Name: VARCHAR(15)
Customer City: VARCHAR(30) Employee Last Name: VARCHAR(20) Vendor Personal Middle Name: VARCHAR(15
Customer State Abbreviation: CHAR(2) Employee Address: VARCHAR(45) Vendor Personal Last Name: VARCHAR(15)
Customer: NUMBER(5) Vendor Street Address: VARCHAR(35)
Vendor City State Address: VARCHAR45)
Vendor Zip Code: CHAR(10)
The challenges abound! The inclusive subtyping tends to lead to denormalization and data duplicationAs
always, duplicated data creates challenges of synchronizing data and maintaining standardized formats
and data. The non standardization names and address create problems with sharing and comparing
data. Also, how do we determine which Employees are also Vendors to the company? Harte Hanks,
Trillium … many companies have made significant profits trough offering address cleansing, names
cleansing and rationalization (de duplication) services just to identify the same person in these different
tables and/or to determine the correct and most current address for a Customer who is also a Vendor?
But wait, there is more!
Can’t a Vendor be a Person or a Company (Organization?) Can’t a Customer be a Person or a company?
What does this look like?
Page 3
4. Subtypes vs. Roles
Party
Person
Organization
Employee
Customer
Regulator
Vendor
What does this do to relationships?
We have not added all of the relationships but we begin to see challenges 2 and 3 with the inclusive
subtypes. Multi subtype relationships, ambiguity and the lack of clarity abound!
Page 4
5. Subtypes vs. Roles
Party
Person
Organization
Employee
Customer
Regulator
Vendor
Clearly if you are a believer in the KISS (Keep It Simple Stupid) principle in data modeling, this will not be
a satisfactory outcome. Several other questions arise:
1. How flexible would this model be?
2. How extensible is this model?
3. How easily maintained would be the programs developed against the model?
Let’s look at a role based model.
Page 5
6. Subtypes vs. Roles
Customer Role
Address
Party
Vendor Role
Regulator Role
Physical Address Phone Address EMail Address
Employee Role
Person Organization
A much simpler model that is more semantically correct, less complex and has greater clarity. This
model of course is a starting point. Addresses definitely have roles. An associative entity between
Address and Party named Party Address Role would cover this.
Semantics play an important role in developing successful supertype – subtype hierarchies. The
exclusive subtype assists in maintaining clarity and simplicity in the model. Inclusive subtypes may often
be indicative of roles and are better expressed in the model by using a role based approach.
Hopefully, these musings will spark some thoughts.
Page 6