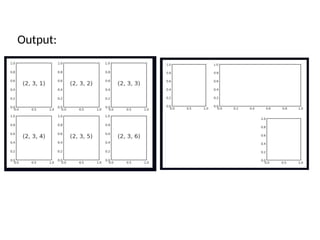
The document provides an introduction to creating subplots in Matplotlib, explaining how to organize multiple axes within a figure for comparative data visualization. It covers basic subplot creation, the use of grids for layout, and advanced options with gridspec for flexible arrangements. Example code snippets illustrate how to implement these concepts for different subplot configurations.

![Creating Basic Subplots with Axes
• Standard Axes:
• ax1 = plt.axes() # Creates main axes
• ax2 = plt.axes([0.65, 0.65, 0.2, 0.2]) # Inset subplot
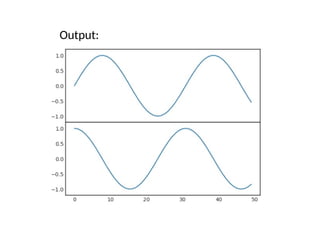
• Figure with Custom Axes:
• fig = plt.figure()
• ax1 = fig.add_axes([0.1, 0.5, 0.8, 0.4], ylim=(-1.2, 1.2))
• ax2 = fig.add_axes([0.1, 0.1, 0.8, 0.4], ylim=(-1.2, 1.2))
• x = np.linspace(0, 10)
• ax1.plot(np.sin(x))
• ax2.plot(np.cos(x))](https://image.slidesharecdn.com/subplotsinmatplotlibpresentation-1-250122151913-64f4558b/85/Subplots_in_Matplotlib_Presentation-1-pptx-2-320.jpg)
![Flexible Grids with GridSpec
• Definition: GridSpec allows subplots to span multiple
rows/columns.
• Example Code:
• grid = plt.GridSpec(2, 3, wspace=0.4, hspace=0.3)
• plt.subplot(grid[0, 0]) # First row, first column
• plt.subplot(grid[0, 1:]) # First row, spans columns 2 and 3
• plt.subplot(grid[1, 2]) # Second row, third column
• Explanation: More control over layout with Python slicing.](https://image.slidesharecdn.com/subplotsinmatplotlibpresentation-1-250122151913-64f4558b/85/Subplots_in_Matplotlib_Presentation-1-pptx-6-320.jpg)


![제 23회 보아즈(BOAZ) 빅데이터 컨퍼런스 - [MBOAX] : ABSA를 활용한 소비자 반응 분석 기반 운영 효율화 대시보드 설계](https://cdn.slidesharecdn.com/ss_thumbnails/3-1boaz23rdconferencemboax-260203102709-9d519923-thumbnail.jpg?width=640&height=640&fit=bounds)


