Study of stationary combustion source fine particulate matter
•Download as DOC, PDF•
1 like•386 views

This is a study of partiulate matter emisions in small boilers in the Aburra Valley region of Colombia. It correlates emission data with efficiency values and chemical composition

Recommended
Recommended
More Related Content
What's hot
What's hot (20)
Viewers also liked
Viewers also liked (20)
Similar to Study of stationary combustion source fine particulate matter
Similar to Study of stationary combustion source fine particulate matter (20)
More from Enrique Posada
More from Enrique Posada (20)
Recently uploaded
Recently uploaded (20)
Study of stationary combustion source fine particulate matter
- 1. Study of stationary combustion source fine particulate matter (PM2.5) emissions and chemical compositions and their relationships to operation conditions Draft Manuscript 2011-A-716-AWMA Enrique Posada INDISA S.A. Carrera 75 # 48 A 27, Medellín, Colombia Miryam Gómez Politécnico Colombiano Jaime Isaza Cadavid, Carrera 48 # 7-151, Medellín, Colombia. Mauricio Correa, Julio C. Saldarriaga Universidad de Antioquia, Calle 67 # 53 - 108, Medellín, Colombia INTRODUCTION The chemical composition and the emission of fine particulate matter (PM2,5) was studied in samples taken from a group of thirty stationary combustion sources, mostly coal operated boilers, ranging in sizes from 50 to 2000 BHP. The sources were located in the Aburrá Valley, in Colombia. The study was carried on between November 2009 and May 2010. Samples were taken by standardized isokinetic stack sampling, under similar conditions, in consecutive runs, working with teflon and quartz filters and an Andersen classification head capable of separating particulates in three classes (larger than 10 microns, between 2.5 and 10 micron and less than 2.5 microns. The samples were analyzed with the same instruments and methodologies in a Colombian laboratory and in the Desert Resources Institute – DRI, at Nevada, USA. Elementary composition, ionic species and carbonaceous matter were determined. The operation conditions of the sources were registered and mass and energy balances were carried based in stack gas compositions, gas flow and temperature. Fuel flows were both recorded from source information (when available) and determined by energy and mass balance. Emission factors were so found. The present work shows chemical compositions and emissions and their relationships to operation conditions and source type and size. Ample variations are evident, which show important possibilities for implementing good engineering practices y better controls in the sources. This is the first time this type of work has been done in Colombia. Up to now, only total particulate matter (PM) has been determined in stack emission studies in the country. It is also the first time that chemical composition has been studied for particle PM 2,5 emissions.
- 2. This work is important for the development of source-receptor modeling and it is part of an ongoing research which also includes sampling of other sources of PM 2,5, such as diesel vehicles and of ambient air PM 2.5 samples, with the idea of correlating sources with receptor chemical compositions and get an approach to source responsibilities. The Valle of Aburrá is a heavily populated 3.5 million people with a mix of industrial, construction and vehicle pollution sources. Up to now, the emphasis has been put on studying total PM, but it is clearly shifting to paying attention to PM 2.5. It was also important to develop a methodology to study source emissions, which implied using new equipment and methods, training personnel and working closely with industrial plants to be able to sample about 20 sources in a very short time. This study is also a first in Colombia in relationship to the attention given to registering boiler operational variables and using them to cross check gas and flow emissions and fuel data, so that emission factors could be determined with good reliability. For this thermodynamic and chemical mass balances were used. Many of the studied sources lacked data on fuel flow, so that flue losses, boiler efficiency, steam flows and gas compositions (CO2, O2, SO2 and H2O) were used to calculate them. It was found that specific PM 2.5 emissions for a set of similar boilers were lower when the boilers worked with higher efficiencies. Comparative information on working conditions and PM 2.5 and total PM emissions was given to all 15 companies participating in the study, which will help them benchmarking for operational improvement in some cases and in other cases, for making them to see the need of installing more efficient particle emission controls. In relationship to chemical composition, it was found that the major components were sulfates (mostly sodium). Organic carbon and elementary carbon were also present, but in much lower percentages. This implies that sulfur from the fuel, reacting with the coal ashes, is a major source of PM 2.5 plus small amounts of unburned material. Some minor tracers seem to be present, such as V, Sb and Pb. It is important to indicate that composition of these samples was quite different from the composition of air samples in the region, which are quite rich in carbon, elementary and organic. OVERVIEW Experimental Methods Chemical analysis of samples required a complex methodology, considering that special Teflon filters had to be used to stand stack temperatures and that parallel samples were taken with quartz filters. This offered a good opportunity to follow boiler operation during several hours which allowed for exploring relationships between operational conditions and PM 2.5 emissions and compositions. This work was done with the help of the local environmental authorities, in the sense that letters were sent to companies chosen by the team carrying the sampling. Once the companies accepted the test, a special meeting was held to explain to them the new
- 3. methodology which required large diameter sampling orifices in the stack and the need to allow the team to take data on operational variable during the sampling: exit temperature from the boiler, fuel consumption, steam generation rates, steam pressures and gas data from the boiler instruments when available. Fuel properties were also obtained based on company information. The sampling team took continuous data on stack gases (NOx, SO2, CO2, CO, O2, , temperature) , with the idea of giving enough information to the analysis team to examine the data for crosschecking trough chemical, mass and energy balances. This was done carefully for all thirty samples, learning from the data and feeding back with commentaries to the sampling team from the first test to the last one. The sampling train was based in EPA method CTM 040 as shown in the iullustration. In general two samples, sometimes three, were taken for each boiler. Samples were taken by standardized isokinetic stack sampling, under similar conditions, in consecutive runs, working with teflon and quartz filters and an Andersen classification head capable of separating particulates in three classes (larger than 10 microns, between 2.5 and 10 micron and less than 2.5 microns. The samples were analyzed with the same instruments and methodologies in a Colombian laboratory and in the Desert Resources Institute – DRI, at Nevada, USA. Elementary composition, ionic species and carbonaceous matter were determined. Results reported by the DRI and the Alpha laboratories, from Colombia (which reported element compositions by XRF) were carefully reviewed and when any piece of data was odd looking, commentaries and double checking were made both to DRI and Alpha. It is important to comment that there is not a large body of experience with chemical analysis of coal combustion PM 2.5 small boiler emission samples. An unexpected difficulty aroused due to the large amounts of matter in many of the filters, as compared to the usual amounts found in ambient PM 2.5 samples.
- 4. The information on boiler operation, stack sampling, gas composition, particle emissions and chemical composition was taken to spread sheets for correlation analysis and preparation of tables and graphs. Results and Discussion Table 1 shows the general results for all coal boilers studied. It shows both sampling and process information. Table 1 Summary of results obtained in coal boiler PM sampling Variable Units Ave. Max. Min. St. Dev. % Stack samples 36 Companies 11 Sources studied 14 Boiler nominal power BHP 664 2.000 150 Boiler load % 45,0 99,3 18,8 58,2 Coal flow kg/hr 790 2.964 74 90,6 Boiler exit temperature °C 180,8 242,6 139,4 13,4 Stack temperatura °C 151,9 197,5 103,2 15,7 Stack actual flow m3/min 373 1.123 125 71,0 Stack mass flow kg/hr 15.818 47.452 5.407 71,6 Boiler steam flow lb/hr 11.606 41.443 902 90,0 Water content % vol 7,2 13,1 4,2 35,2 O2 % vol 13,5 18,7 4,1 26,5 CO2 % vol 6,8 13,9 1,7 52,8 CO ppm 296 3.241 0 280,9 SO2 ppm 111 258 21 74,7 NO ppm 57 187 0 92,8 NO2 ppm 4,9 14,6 0,5 76,7 NOx ppm 68 202 7 77,0 Boiler efficiency % 71,1 87,4 49,5 15,8 Excess air % 321 911 43 85,1 PM 2.5 fraction % PM 37,8 96,9 4,3 74,5 PM 2.5 concentration mg/Nm3 65,1 251,3 1,1 94,3 Total PM concentration mg/Nm3 186,9 689,3 18,7 85,4 PM 2.5 emissions kg/hr 1,08 4,84 0,029 103,2 Total PM emissions kg/hr 3,09 20,35 0,100 141,9 PM 2.5 emissions kg/t coal 1,25 3,47 0,017 73,2 Total PM emissions kg/t coal 4,04 14,21 0,29 81,1 PM 2.5 emissions kg/106 Kcal 0,24 0,68 0,0032 73,85 Total PM emissions kg/106 Kcal 0,76 2,59 0,057 78,81
- 5. The boilers studied were small and medium size ones. The five larger ones, of more than 1.000 BHP were water-tube boilers, the rest fire-tube boilers. Only one, a 1.200 BHP unit, was feed with pulverized coal, the rest were feed coarse size coal, most by travelling grate. Two had bag house filters, the rest cyclone collectors. Boiler operation showed in general very high air excesses and somewhat low thermal efficiencies. Efficiencies were lower for high air excesses and small size. Operating loads tended to be also low, 45 % in the average. See figures 1, 2 ,3 and 4. Figure 1. Boiler efficiencies and air excesses 100 80 60 40 R² = 0,91 20 % 0 B n y o c r e f l i , 0 100 200 300 400 500 600 700 800 900 1000 Air excess, % Figure 2. Boiler efficiencies and boiler size 100 80 R² = 0,27 60 40 20 % 0 B n y o c r e f l i , 0 500 1000 1500 2000 2500 Boiler size BHP Figure 3. Boiler efficiencies and boiler load 100 R² = 0,47 80 60 40 % E n y e c f i , 20 0 0 10 20 30 40 50 60 70 80 90 100 Boiler load, %
- 6. Figure 4. Boiler loads and boiler sizes 100 80 60 40 % B d 20 a o r e l i , 0 0 500 1000 1500 2000 2500 Boiler size BHP All boilers were working with bituminous coal, mined from the nearby Amagá range, which has around 60 to 65 % carbon, 13 to 18 % O2, 3 to 5 % H2, 0.50 Sulfur, 6 to 12 % ashes and 6 to 12 % humidity. High heat value are between 5.500 and 6.500 Kcal./Kg The PM concentration emission limit, recently formulated, for existing boilers, is 200 mg/NM3 at 11 % O2 , with no legal limits yet applying to PM 2.5 emissions. The boilers were, on average, close to this PM emission limit, but 45 % of the stack sampling tests showed PM concentrations over the limits. Small boilers tended in larger proportion to surpass the established limits, see figure 5. Figure 5. PM 2.5 concentration and coal flow 700 600 500 400 300 200 100 % O 2 1 a t 0 0 500 1000 1500 2000 2500 3000 3500 M m N Coal flow, kg/hr P n 3 g a o r e c t / i Emission limit, 200 mg/Nm3 at 11 % O2 The boilers exhibited a wide range of specific PM 2.5 emissions, calculated per ton of coal and per 106 Kcal. The PM 2.5 fraction of total PM showed ample variations, being in average a 36 % with no clear relation to boiler size, see figure 6.
- 7. Figure 6. PM 2.5 fraction and coal flow 120 100 80 60 40 20 % M P n o a 5 2 c r t f i , . 0 0 500 1000 1500 2000 2500 3000 3500 Coal flow, kg/hr It is evident that a representative sample of the industrial boilers was the basis for this study, where a wide range of boiler loads and working operations were tested. This means that the PM 2.5 emissions studied will represent the existing situation for stationary combustion sources of coal boiler type. Most boilers in the region are fueled by coal. A heavy fuel boiler, two diesel and a gas natural boiler were also included in the sample, in order to compare them to the coal boilers. Table 2 shows the sampling results for them. Table 2 Summary of results obtained with different fuel boilers Heavy Diesel Natural Variable Units Coal fuel oil fuel gas Stack samples 36 3 4 1 Companies 11 1 2 1 Sources studied 14 1 2 1 Boiler nominal power BHP 664 100 263 481 Boiler load % 45,0 21,4 29,9 21,5 Fuel flow kg/hr 790 27,7 53,5 73 Boiler exit temperature °C 180,8 228,5 230,6 215,8 Stack temperature °C 151,9 154,5 192,3 213,8 Stack actual flow m3/min 373 21,3 77,1 88,78 Stack mass flow kg/hr 15.818 844 2.835 3.174 Boiler steam flow lb/hr 11.606 640 596 Water content % vol 7,2 16,0 6,9 12,18 O2 % vol Dry 13,5 7,8 11,2 9,71 CO2 % vol Dry 6,8 5,1 4,3 4,43 CO ppm vol dry 296 15.098 SO2 ppm vol dry 111 55,7 58,8 NO ppm vol dry 57 95,8 12,3 15,5
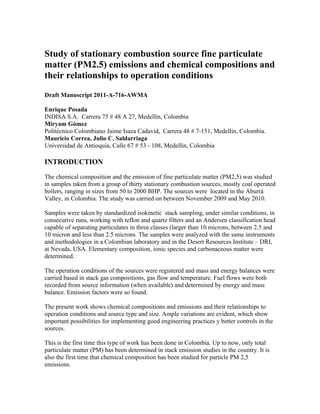
- 8. NO2 ppm vol dry 4,9 7,5 1,0 1,2 NOx ppm vol dry 68 103,3 13,2 16,7 Boiler Thermal efficiency (bassed on high fuel combustion heat) % 71,1 61,9 70,7 70,3 Excess air % 321 110,7 259,9 146,6 PM 2.5 as percentaje of total PM % 37,8 26,9 9,4 2,73 mg/Nm3 PM 2.5 concentration (wet basis) 65,1 333,0 0,37 0,33 mg/Nm3 PM concentration (wet basis) 186,9 1.246 7,3 12,11 PM 2.5 emissions kg/hr 1,08 0,25 0,0007 0,00092 PM emissions kg/hr 3,09 0,94 0,0097 0,03359 PM 2.5 emissions kg/ton fuel 1,25 9,20 0,018 0,012 PM emissions kg/ton fuel 4,04 33,90 0,36 0,46 PM 2.5 emissions Kg/106 Kcal 0,24 0,97 0,0017 0,0011 PM emissions Kg/106 Kcal 0,76 3,58 0,035 0,039 It is clear than the natural gas and diesel boilers emit much less PM and PM 2.5 than the coal and the heavy fuel boilers. The only heavy fuel boiler studied is a heavy emitter of CO and PM , as compared even to the worst coal boilers. As there were in general several tests performed for each boiler, it was possible to prepare curves relating boiler efficiency with to emission factors. Figure 7 shows this analysis.
- 9. Figure 7. PM 2.5 emission factor and boiler efficiency obtained in runs for each boiler 1,4 1,2 1,0 0,8 0,6 0,4 M m K P k n a g o 5 2 c e s l / i , . 0,2 0,0 50 55 60 65 70 75 80 85 90 95 Boiler efficiency, % Boiler 1 300 BHP Boiler 2 600 BHP Boiler 4 800 BHP Boiler 5 100 BHP Boiler 6 600 BHP Boiler 7 600 BHP Boiler 8 150 BHP Boiler 9 1.000 BHP Boiler 10 1.000 BHP Boiler 11 1.200 BHP Boiler 12 150 BHP Boiler 14 600 BHP It can be seen that, in general, PM 2.5 emissions tend to decrease when boiler efficiency increases. The influence of efficiency seems in general significant for most boilers studied. This is an important point to be made, as there is much to gain by operating the boilers at higher efficiencies by controlling air excesses. This will mean fuel savings, lower PM 2.5 emissions. Table 3 shows the results obtained in the chemical analysis of the PM 2.5 samples taken in the stack tests for the coal boilers. Table 3 Summary of results obtained in the chemical analysis of PM 2.5 samples for coal boilers St. Dev, Ion analysis Ave. Max. Min. % Chlorides 0,262 2,16 0,000 208,7 Nitrates 0,048 0,19 0,000 116,1 Phosphates 0,013 0,05 0,000 135,1 Sulfates 50,554 69,39 4,212 31,5
- 10. Sodium 19,486 29,82 0,679 45,6 Ammonium 0,301 1,51 0,000 130,1 Potassium 2,942 8,60 0,095 76,1 Calcium 0,652 3,15 0,040 135,9 Magnesium 0,166 1,00 0,009 179,5 Lithium 0,007 0,02 0,000 79,4 Brome 0,003 0,02 0,000 150,2 Fluorides 0,271 2,76 0,000 256,2 Total ions 74,704 103,12 11,311 30,5 Element analysis by XRF expressed St. Dev, as oxides Ave. Max. Min. % Fe2O3 2,717 13,72 0,194 163,0 Al2O3 2,598 36,60 0,001 362,4 PbO 0,482 1,78 0,012 139,7 Na2O 0,221 3,32 0,000 387,3 VO2 0,219 3,05 0,000 357,8 ZnO 0,179 0,97 0,000 189,0 As4O6 0,180 1,47 0,005 208,6 K2O 0,202 3,03 0,000 387,3 BaO 0,193 2,35 0,003 309,5 TiO2 0,158 2,27 0,000 370,9 MgO 0,161 2,01 0,000 320,7 Sb2O5 0,130 0,32 0,002 91,8 Ni2O3 0,076 0,22 0,004 65,7 CuO 0,059 0,27 0,000 132,2 SiO2 0,002 0,01 0,000 130,4 Total XRF components 7,785 61,79 0,793 201,9 St. Dev, Organic components and carbon Ave. Max. Min. % Organic Carbon - OC 1,789 4,68 0,142 87,0 Elemental Carbon - EC 4,430 26,24 0,001 166,2 H2, O2 and N2 associated with OC 0,953 2,49 0,076 87,0 Total organic components and carbon 7,172 33,41 0,218 130,7 Total mass 89,661 106,309 80,000 10,1 When mass closure was higher than 120 % or lower than 80 %, the percentages for all components were adjusted in the same proportion so that mass closure was taken to these limits. Table 3 shows these values. Total mass in the filters was in general close to a 100 % closure, with an average of 86,67 % for the coal boiler PM 2.5 samples. With the adjusting the average closure was the one reported in table 3, 89.661 %
- 11. The following figures show the composition of the samples according to individual tests, in order to show how variable the compositions are. Except for the behavior of sulfates and sodium, the variations are quite significant. Figure 8 shows that, in general, ions are the dominant components. Figure 8. PM 2.5 composition according to boiler test, expressed by coal flow 120 100 80 60 40 W M P n p h 5 2 o a g c r e t i , 20 0 74 85 87 142 175 373 572 572 618 690 693 846 1085 1635 1713 Coal flow, kg/hr Total oxides % weight Total ions % weight Total organic fraction % weight It is also noticeable that carbonaceous matter is more prevalent in the small boilers, which are also the less efficient (figure 9) Figure 9. PM 2.5 composition, carbonaceous matter
- 12. 40 35 30 25 20 15 10 5 0 W M P n p h 5 2 o a g c r e 1 2 3 4 5 6 7 8 9 10 11 12 13 14 15 t i , Coal flow, kg/hr Total organic fraction % weight An ionic balance was done with the ionic components, to get an approach to the possible ionic combinations in the PM 2.5 materials. Figure 10 and 11 show the results of this exercise, which indicates that sodium sulfate is the major component for the great majority of samples, Figure 10. PM 2.5 sulfates according, to boiler test expressed by coal flow 100 90 80 70 60 50 40 30 M W P n p h 20 o g 5 2 a e c r t i , 10 0 74 85 87 142 175 373 572 572 618 690 693 846 1085 1635 1713 Coal flow, kg/hr NaSO4 K2SO4 CaSO4 (NH4)2SO4 Other sulfates (SO4-2) Total sulfates (SO4-2) Figure 11. PM 2.5 nitrates and phosphates and coal flows
- 13. 0,25 0,20 0,15 0,10 0,05 M W P n p h o g 5 2 a e c r t i , 0,00 74 85 87 142 175 373 572 572 618 690 693 846 1085 1635 1713 Coal flow, kg/hr Total nitrates (NO3-1) Total Phosfates (PO4-3) Figures 12 and 13 show the results for XRF elements converted into oxides. Looking for clear tracing elements for PM 2.5 coming from coal combustion in the region, Sb and As appear in many of the samples. Figure 12. PM 2.5 metal oxides and coal flows 10 8 6 4 2 M W P n p h o g 5 2 a e c 0 r t i , 74 85 87 142 175 373 572 572 618 690 693 846 1085 1635 1713 Coal flow, kg/hr Fe2O3 Al2O3 PbO Na2O VO2 ZnO Figure 13. PM 2.5 metal oxides and coal flows
- 14. 3,5 3,0 2,5 2,0 1,5 1,0 M W P n p h o g 5 2 a e c r t i , 0,5 0,0 74 85 87 142 175 373 572 572 618 690 693 846 1085 1635 1713 Coal flow, kg/hr As4O6 K2O BaO TiO2 MgO Sb2O5 SUMMARY This work is a major step in the study of PM 2.5 sources in the Valle de Aburrá region and in Colombia. It is the first time that PM 2.5 sampling is undertaken in a systematic way for a set of major industrial sources of this contaminant. The information on PM 2.5 fraction will allow some valuable initial estimation of the contribution of stationary combustion industrial sources operated by coal to the atmospheric pollution in the region, which up to the present time has been limited to the study of total PM. A very important finding of this study is the influence that operation conditions, represented by boiler efficiency, have on PM 2.5 and PM emissions. Local environmental authorities and companies should include process optimization as part of their pollution control programs and activities. This study shows that a significant part of the local boilers are operated at low efficiencies and high air excesses and that total PM limits are not fully met. The chemical composition of PM 2.5 coming from coal operated boilers has a distinctive chemical structure as compared to what has been found in the analysis of sampling filters located in urban areas in the Valle of Aburrá area. These show a dominance of organic and elemental carbon. This seems to confirm that vehicle contributions are much more influent than coal boilers emissions, a find that other studies also suggest.
- 15. It is clear that sulfur and sulfates, play a major role in the formation of PM 2.5 during boiler combustion, being the major constituents. They will combine with the metals in the coal ashes to form salts, such as sodium sulfates. It seems logical to expect that a larger presence of sulfur in the coal would contribute to larger PM 2.5 emissions. Local coals are low in sulfur, which seems quite favorable in this sense. The low presence of carbonaceous matter (EC and OC and their associated compounds) indicate that combustion processes are relatively complete. However, for the small and less efficient boilers, this matter show higher values, which are also associated with lower efficiencies. ACKNOWLEDGMENTS The authors must express acknowledgments for the support given by the companies that allowed the sampling procedure to be developed in their premises. Also to the AREA METROPOLITANA DELVALLE DE ABURRÁ , which is the local environmental authority, for its economical contribution to this study. REFERENCES 1 Su, Ge et al, Emissions of Air Pollutants from Household Stoves: Honeycomb Coal versus Coal Cake. In Environ. Sci. Technol. 2004, 38, 4612-4618 2 Behrentz, E; Sanchez, N, Caracterización de material particulado y fuentes receptores. Facultad de Ingeniería, Universidad de los Andes. 2006. 3 Gómez, M. et al. Determinación de la contribución de fuentes de material particulado PST y PM 10 en tres zonas del Valle de Aburrá. Área Metropolitana del Valle de Aburrá. 2008