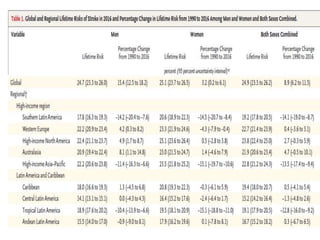
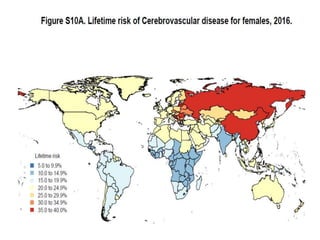
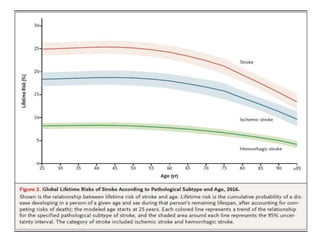
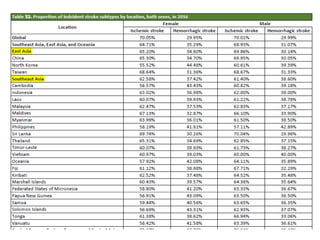
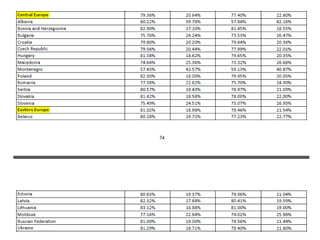
Journal presentation
Dr. Md. Mostafa-Al-Rasel
IMO (Medicine)
Medicine Unit-5
ShSMCH
‘Global, Regional, and Country-Specific
Lifetime Risks of Stroke, 1990 and 2016’
• Source: The New England Journal of Medicine
• Date of Publication: December 20, 2018
Introduction
 Stroke accounts for almost 5% of all disability-
adjusted life-years and 10% of all deaths worldwide
 The bulk of this burden (>75% of deaths from stroke
and >80% of disability-adjusted life-years) occurring
in low-income and middle-income countries.
 According to several surveys, the global burden of
stroke has been increasing, and prevention of stroke
may require an improved understanding of the risks
among younger persons.
 Stroke prevention strategies in low-income and
middle-income countries may differ from those
adopted in high-income countries owing to
differences in access to health care, health
technologies, and relative rates of risk factors for
stroke.
Introduction
• Estimates of lifetime risk (defined as the
cumulative probability of a disease developing
in a person of a given age and sex during that
person’s remaining lifespan, after accounting
for competing risks of death) provide a measure
of disease risk in large populations.
• Estimates of lifetime risk of stroke may be
useful for the long-term planning of health
systems
Introduction
• Researchers used the results of the Global Burden of
Disease (GBD) Study 2016, which estimated major
disease burden from 1990 through 2016, to
compare the estimated global, regional, and
country-specific lifetime risks of stroke in 2016 with
those in 1990.
• These estimates were stratified according to
pathological subtype of stroke, age, sex, and socio-
demographic index (SDI) and accounted for the
competing risk of death from any cause other than
stroke.
• The GBD is an ongoing global collaboration that uses
all available epidemiologic data to provide a
comparative assessment of health loss from 328
diseases across 195 countries and territories.
Background
• The lifetime risk of stroke has been calculated in a
limited number of selected populations.
• Diverging trends in stroke incidence and mortality
rates have been observed between developed
countries (where the rates are decreasing) and
developing countries (where the rates are
increasing) against a background of increasing life
expectancy in almost all countries.
• Investigators sought to estimate the lifetime risk of
stroke at the regional, country, and global level using
data from a comprehensive study of the prevalence
of major diseases.
Methods
• Place of study – global, regional (21 GBD
regions nested within 7 GBD super-regions),
and national (195 countries) levels
• Study period – from 1990 through 2016
• Funded by - the Bill and Melinda Gates
Foundation
Methods
Estimating Stroke Incidence and Mortality
 Researchers used estimates from the GBD Study 2016
of the rate of first stroke, cause-specific mortality, and
all-cause mortality at the global, regional (21 GBD
regions nested within 7 GBD super-regions), and
national (195 countries) levels, stratified according to
age and sex.
 Analyses were performed separately for ischemic
stroke and hemorrhagic stroke; the latter included
intracerebral hemorrhagic stroke and non traumatic
subarachnoid hemorrhagic stroke.
Methods
Estimating Lifetime Risk of Stroke
• Countries were categorized into quintiles of the SDI
(high, high-medium, medium, medium-low, and
low level of development) used in the GBD Study
2016.
• The SDI, a composite indicator of development
similar to the Human Development Index, is based
on country-level income per capita, average
educational attainment among persons older than
15 years of age, and total fertility rate.
• Researchers used stroke incidence, prevalence, and
mortality rates in each 5-year age group to estimate
the lifetime risk of stroke among persons at a given
age.
 Mortality was estimated by means of the
Cause of Death Ensemble model, in which vital
registration, verbal autopsy data were considered.
 Stroke incidence was estimated with the use of
DisMod-MR, a Bayesian meta-regression disease
modeling tool.
Statistical analysis
• Point estimates and 95% uncertainty intervals
representing the 2.5th and 97.5th percentiles
around the estimate were used to compare
results between groups.
• Differences in the estimates of the risk of stroke
were considered to be significant when the 95%
uncertainty intervals did not overlap or when the
95% uncertainty interval for relative percentage
change did not include zero.
Results
Results
• In 2016, the global lifetime risk of stroke from the
age of 25 years onward was 24.9% (95%
uncertainty interval, 23.5 to 26.2), and there
were regional and between-country differences.
• China had the highest estimated risk (39.3%; 95%
uncertainty interval, 37.5 to 41.1), and the risks
were similarly high in Bosnia and Herzegovina,
Bulgaria, Latvia, Macedonia, Montenegro,
Romania, and Russia.
Results
• Among the 21 GBD regions, East Asia had the
highest risk (38.8%; 95% uncertainty interval,
37.0 to 40.6), followed by Central Europe
(31.7%; 95% uncertainty interval, 30.0 to 33.3)
and Eastern Europe (31.6%; 95% uncertainty
interval, 27.6 to 35.6); eastern sub-Saharan
Africa had the lowest risk (11.8%; 95%
uncertainty interval, 10.9 to 12.8).
Results
• When the risks were compared across SDI
quintiles, the high-middle–SDI countries had
the greatest risk (31.1%; 95% uncertainty
interval, 29.0 to 33.0), followed by the middle-
SDI countries (29.3%; 95% uncertainty interval,
27.8 to 30.8);
• The low-SDI countries had the lowest risk
(13.2%; 95% uncertainty interval, 12.3 to 14.2).
• The risk was 23.5% (95% uncertainty interval,
22.2 to 24.8) in high-SDI countries.
Results
• In 2016, the global lifetime risk of stroke among
men (24.7%; 95% uncertainty interval, 23.3 to
26.0) was not significantly different from that
among women (25.1%; 95% uncertainty interval,
23.7 to 26.5), but there were regional and
between-country differences in sex-specific risk.
• The greatest risk among men was in China
(41.1%; 95% uncertainty interval 39.2 to 42.9);
among women in China, the risk was 36.7% (95%
uncertainty interval, 35.0 to 38.6), which
accounted for the largest difference in risk
between men and women among the nations.
Results
• The greatest risk among women was in Latvia
(41.7%; 95% uncertainty interval, 37.7 to
45.4), and the risks among women in Albania,
Belarus, Bosnia and Herzegovina, Bulgaria,
Lithuania, Macedonia, Monte-negro, Romania,
Russia, Serbia, Slovakia, and Ukraine were
similar.
Result
• The estimates of global lifetime risk of stroke
increased from 22.8% in 1990 to 24.9% in 2016,
representing a relative increase of 8.9% (95%
uncertainty interval, 6.2 to 11.5)
• The difference is significant, as reflected by the
exclusion of zero in the uncertainty interval.
• The increase in the risk was greater among men
(15.4%; 95% uncertainty interval, 12.5 to 18.2)
than among women (3.2%; 95% uncertainty
interval, 0.2 to 6.1), and the increase in the risk of
ischemic stroke (12.7%; 95% uncertainty interval,
8.9 to 16.3) was greater than that of hemorrhagic
stroke (4.0%; 95% uncertainty interval, 0.2 to
7.6).
Discussion
• The global lifetime risk of stroke from the age
of 25 years onward is estimated to have
increased from 22.8% in 1990 to 24.9% in
2016, with the change in the risk of ischemic
stroke exceeding that of hemorrhagic stroke.
• The estimated global lifetime risk of stroke has
declined with increasing age, in part owing to
age-related competing risks of other diseases.
Discussion
• In the comparative risk assessment performed
in the GBD Study, elevated blood pressure
was estimated as the leading attributable risk
factor for stroke across all SDI quintiles, with
greater attribution to air pollution and low
intake of fruit in low-SDI countries and high
body-mass index and high fasting plasma
glucose levels in high-SDI countries.
Discussion
• Knowledge of lifetime risk may be useful for
stroke prevention and public education.
• High estimates of lifetime risk of stroke
suggest that there is possible value of
measures for the primary prevention of stroke
throughout a person’s lifespan and suggest
that strategies to reduce cardiovascular risk
remain relevant for both younger and older
adults.
Strength
• The systematic use of data and methods that
allow for comparable estimates of lifetime risk of
stroke among different locations and between
different years.
• Researchers provide estimates of lifetime risk of
stroke only among persons 25 years of age or
older in contrast to other studies that estimated
lifetime risk of stroke among persons 45 years of
age or older.
• Furthermore, the estimates of lifetime risk of
stroke that we provide account for competing risk
of death from any cause other than stroke and
represent whole populations, possibly making the
results generalizable.
Limitation
• The accuracy of the estimates of lifetime risk of
stroke was limited by the accuracy and
availability of epidemiologic data from the
countries studied.
• There was a lack of sufficient epidemiologic
data on stroke incidence and case fatality for
most countries in the world.
• In these countries, estimates were dependent
on geospatial statistical models that
incorporated data from neighboring countries
and data on country-level risk exposure.
Limitation
• Researchers did not differentiate between
subarachnoid hemorrhagic and intracerebral
hemorrhagic stroke; these were combined in
the estimate of hemorrhagic stroke.
• Finally, researchers analyzed only the lifetime
risk of first-ever stroke and not recurrent
stroke.
Conclusion
• The study provided global, regional, and
country-specific estimates of the lifetime risk
of stroke according to sex and age.
• In 2016, the global lifetime risk of stroke from
the age of 25 years onward was approximately
25% among both men and women.
• There was geographic variation in the lifetime
risk of stroke, with the highest risks in East
Asia, Central Europe, and Eastern Europe.
Stroke journal
Stroke journal
Stroke journal
Stroke journal

Stroke journal

  • 1.
    Journal presentation Dr. Md.Mostafa-Al-Rasel IMO (Medicine) Medicine Unit-5 ShSMCH
  • 2.
    ‘Global, Regional, andCountry-Specific Lifetime Risks of Stroke, 1990 and 2016’ • Source: The New England Journal of Medicine • Date of Publication: December 20, 2018
  • 3.
    Introduction  Stroke accountsfor almost 5% of all disability- adjusted life-years and 10% of all deaths worldwide  The bulk of this burden (>75% of deaths from stroke and >80% of disability-adjusted life-years) occurring in low-income and middle-income countries.  According to several surveys, the global burden of stroke has been increasing, and prevention of stroke may require an improved understanding of the risks among younger persons.  Stroke prevention strategies in low-income and middle-income countries may differ from those adopted in high-income countries owing to differences in access to health care, health technologies, and relative rates of risk factors for stroke.
  • 4.
    Introduction • Estimates oflifetime risk (defined as the cumulative probability of a disease developing in a person of a given age and sex during that person’s remaining lifespan, after accounting for competing risks of death) provide a measure of disease risk in large populations. • Estimates of lifetime risk of stroke may be useful for the long-term planning of health systems
  • 5.
    Introduction • Researchers usedthe results of the Global Burden of Disease (GBD) Study 2016, which estimated major disease burden from 1990 through 2016, to compare the estimated global, regional, and country-specific lifetime risks of stroke in 2016 with those in 1990. • These estimates were stratified according to pathological subtype of stroke, age, sex, and socio- demographic index (SDI) and accounted for the competing risk of death from any cause other than stroke. • The GBD is an ongoing global collaboration that uses all available epidemiologic data to provide a comparative assessment of health loss from 328 diseases across 195 countries and territories.
  • 6.
    Background • The lifetimerisk of stroke has been calculated in a limited number of selected populations. • Diverging trends in stroke incidence and mortality rates have been observed between developed countries (where the rates are decreasing) and developing countries (where the rates are increasing) against a background of increasing life expectancy in almost all countries. • Investigators sought to estimate the lifetime risk of stroke at the regional, country, and global level using data from a comprehensive study of the prevalence of major diseases.
  • 7.
    Methods • Place ofstudy – global, regional (21 GBD regions nested within 7 GBD super-regions), and national (195 countries) levels • Study period – from 1990 through 2016 • Funded by - the Bill and Melinda Gates Foundation
  • 8.
    Methods Estimating Stroke Incidenceand Mortality  Researchers used estimates from the GBD Study 2016 of the rate of first stroke, cause-specific mortality, and all-cause mortality at the global, regional (21 GBD regions nested within 7 GBD super-regions), and national (195 countries) levels, stratified according to age and sex.  Analyses were performed separately for ischemic stroke and hemorrhagic stroke; the latter included intracerebral hemorrhagic stroke and non traumatic subarachnoid hemorrhagic stroke.
  • 9.
    Methods Estimating Lifetime Riskof Stroke • Countries were categorized into quintiles of the SDI (high, high-medium, medium, medium-low, and low level of development) used in the GBD Study 2016. • The SDI, a composite indicator of development similar to the Human Development Index, is based on country-level income per capita, average educational attainment among persons older than 15 years of age, and total fertility rate. • Researchers used stroke incidence, prevalence, and mortality rates in each 5-year age group to estimate the lifetime risk of stroke among persons at a given age.
  • 10.
     Mortality wasestimated by means of the Cause of Death Ensemble model, in which vital registration, verbal autopsy data were considered.  Stroke incidence was estimated with the use of DisMod-MR, a Bayesian meta-regression disease modeling tool. Statistical analysis
  • 11.
    Statistical analysis • Pointestimates and 95% uncertainty intervals representing the 2.5th and 97.5th percentiles around the estimate were used to compare results between groups. • Differences in the estimates of the risk of stroke were considered to be significant when the 95% uncertainty intervals did not overlap or when the 95% uncertainty interval for relative percentage change did not include zero.
  • 12.
  • 14.
    Results • In 2016,the global lifetime risk of stroke from the age of 25 years onward was 24.9% (95% uncertainty interval, 23.5 to 26.2), and there were regional and between-country differences. • China had the highest estimated risk (39.3%; 95% uncertainty interval, 37.5 to 41.1), and the risks were similarly high in Bosnia and Herzegovina, Bulgaria, Latvia, Macedonia, Montenegro, Romania, and Russia.
  • 16.
    Results • Among the21 GBD regions, East Asia had the highest risk (38.8%; 95% uncertainty interval, 37.0 to 40.6), followed by Central Europe (31.7%; 95% uncertainty interval, 30.0 to 33.3) and Eastern Europe (31.6%; 95% uncertainty interval, 27.6 to 35.6); eastern sub-Saharan Africa had the lowest risk (11.8%; 95% uncertainty interval, 10.9 to 12.8).
  • 18.
    Results • When therisks were compared across SDI quintiles, the high-middle–SDI countries had the greatest risk (31.1%; 95% uncertainty interval, 29.0 to 33.0), followed by the middle- SDI countries (29.3%; 95% uncertainty interval, 27.8 to 30.8); • The low-SDI countries had the lowest risk (13.2%; 95% uncertainty interval, 12.3 to 14.2). • The risk was 23.5% (95% uncertainty interval, 22.2 to 24.8) in high-SDI countries.
  • 19.
    Results • In 2016,the global lifetime risk of stroke among men (24.7%; 95% uncertainty interval, 23.3 to 26.0) was not significantly different from that among women (25.1%; 95% uncertainty interval, 23.7 to 26.5), but there were regional and between-country differences in sex-specific risk. • The greatest risk among men was in China (41.1%; 95% uncertainty interval 39.2 to 42.9); among women in China, the risk was 36.7% (95% uncertainty interval, 35.0 to 38.6), which accounted for the largest difference in risk between men and women among the nations.
  • 21.
    Results • The greatestrisk among women was in Latvia (41.7%; 95% uncertainty interval, 37.7 to 45.4), and the risks among women in Albania, Belarus, Bosnia and Herzegovina, Bulgaria, Lithuania, Macedonia, Monte-negro, Romania, Russia, Serbia, Slovakia, and Ukraine were similar.
  • 23.
    Result • The estimatesof global lifetime risk of stroke increased from 22.8% in 1990 to 24.9% in 2016, representing a relative increase of 8.9% (95% uncertainty interval, 6.2 to 11.5) • The difference is significant, as reflected by the exclusion of zero in the uncertainty interval. • The increase in the risk was greater among men (15.4%; 95% uncertainty interval, 12.5 to 18.2) than among women (3.2%; 95% uncertainty interval, 0.2 to 6.1), and the increase in the risk of ischemic stroke (12.7%; 95% uncertainty interval, 8.9 to 16.3) was greater than that of hemorrhagic stroke (4.0%; 95% uncertainty interval, 0.2 to 7.6).
  • 25.
    Discussion • The globallifetime risk of stroke from the age of 25 years onward is estimated to have increased from 22.8% in 1990 to 24.9% in 2016, with the change in the risk of ischemic stroke exceeding that of hemorrhagic stroke. • The estimated global lifetime risk of stroke has declined with increasing age, in part owing to age-related competing risks of other diseases.
  • 26.
    Discussion • In thecomparative risk assessment performed in the GBD Study, elevated blood pressure was estimated as the leading attributable risk factor for stroke across all SDI quintiles, with greater attribution to air pollution and low intake of fruit in low-SDI countries and high body-mass index and high fasting plasma glucose levels in high-SDI countries.
  • 27.
    Discussion • Knowledge oflifetime risk may be useful for stroke prevention and public education. • High estimates of lifetime risk of stroke suggest that there is possible value of measures for the primary prevention of stroke throughout a person’s lifespan and suggest that strategies to reduce cardiovascular risk remain relevant for both younger and older adults.
  • 28.
    Strength • The systematicuse of data and methods that allow for comparable estimates of lifetime risk of stroke among different locations and between different years. • Researchers provide estimates of lifetime risk of stroke only among persons 25 years of age or older in contrast to other studies that estimated lifetime risk of stroke among persons 45 years of age or older. • Furthermore, the estimates of lifetime risk of stroke that we provide account for competing risk of death from any cause other than stroke and represent whole populations, possibly making the results generalizable.
  • 29.
    Limitation • The accuracyof the estimates of lifetime risk of stroke was limited by the accuracy and availability of epidemiologic data from the countries studied. • There was a lack of sufficient epidemiologic data on stroke incidence and case fatality for most countries in the world. • In these countries, estimates were dependent on geospatial statistical models that incorporated data from neighboring countries and data on country-level risk exposure.
  • 30.
    Limitation • Researchers didnot differentiate between subarachnoid hemorrhagic and intracerebral hemorrhagic stroke; these were combined in the estimate of hemorrhagic stroke. • Finally, researchers analyzed only the lifetime risk of first-ever stroke and not recurrent stroke.
  • 31.
    Conclusion • The studyprovided global, regional, and country-specific estimates of the lifetime risk of stroke according to sex and age. • In 2016, the global lifetime risk of stroke from the age of 25 years onward was approximately 25% among both men and women. • There was geographic variation in the lifetime risk of stroke, with the highest risks in East Asia, Central Europe, and Eastern Europe.