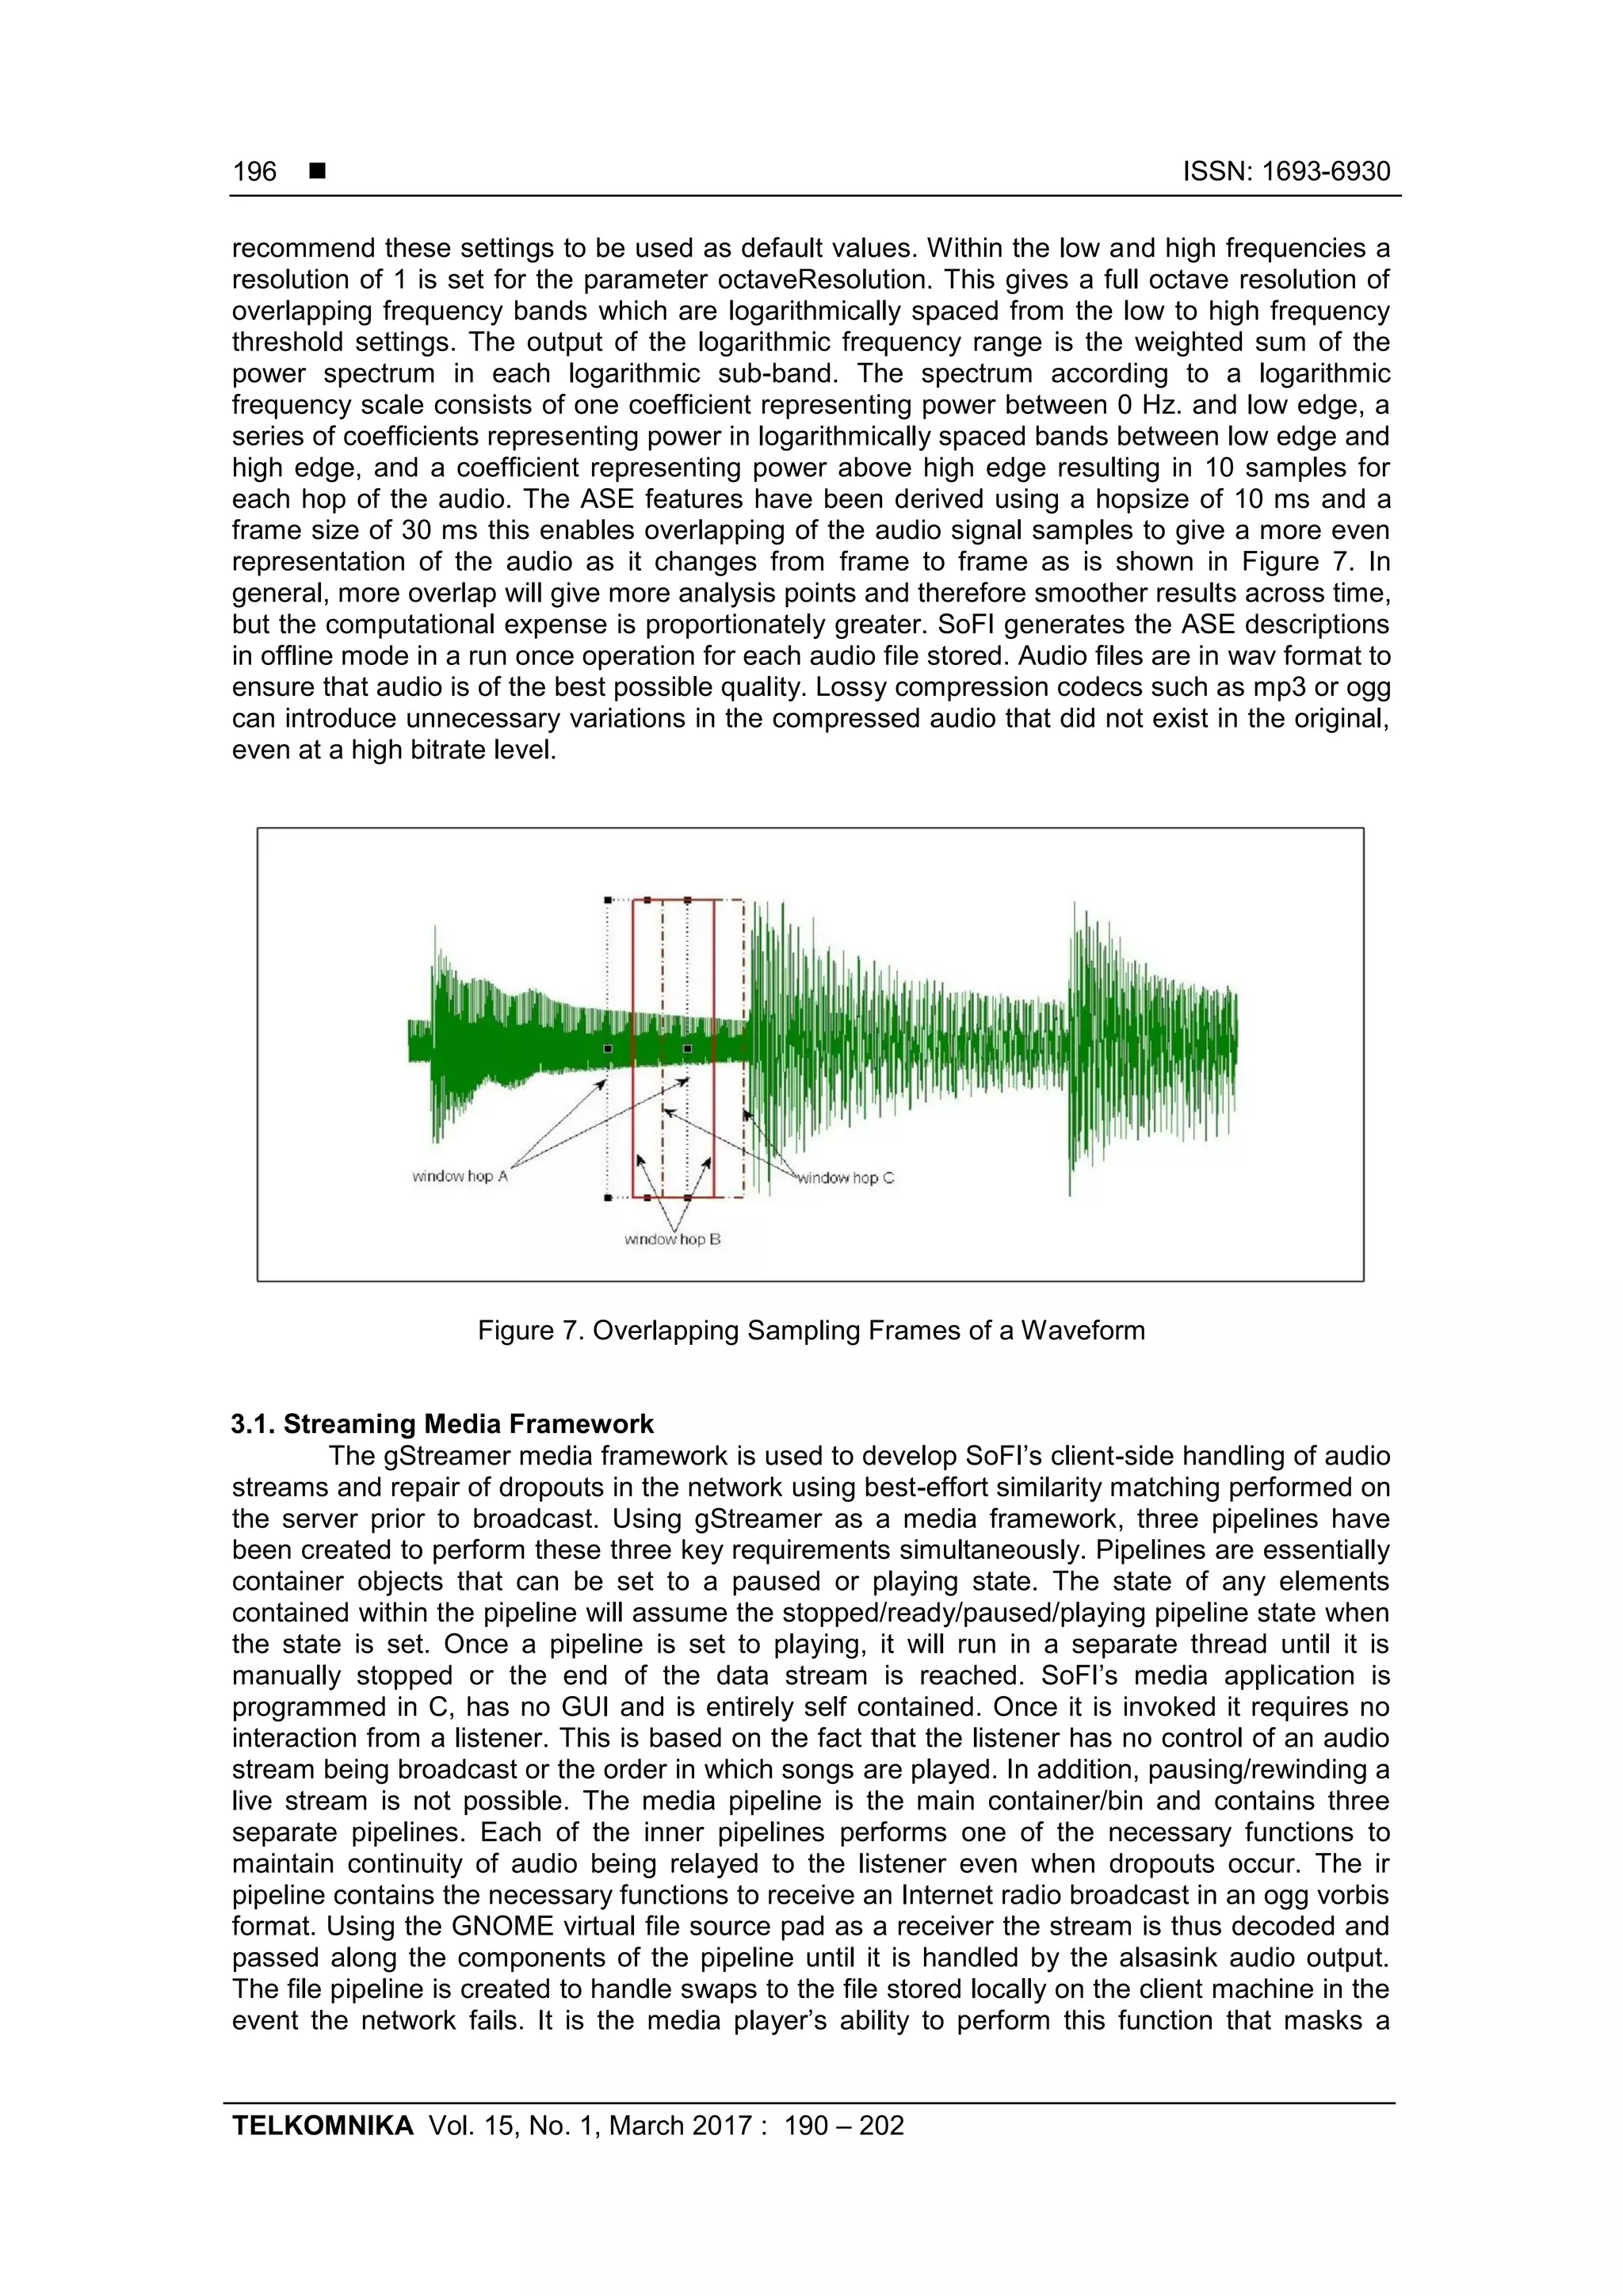
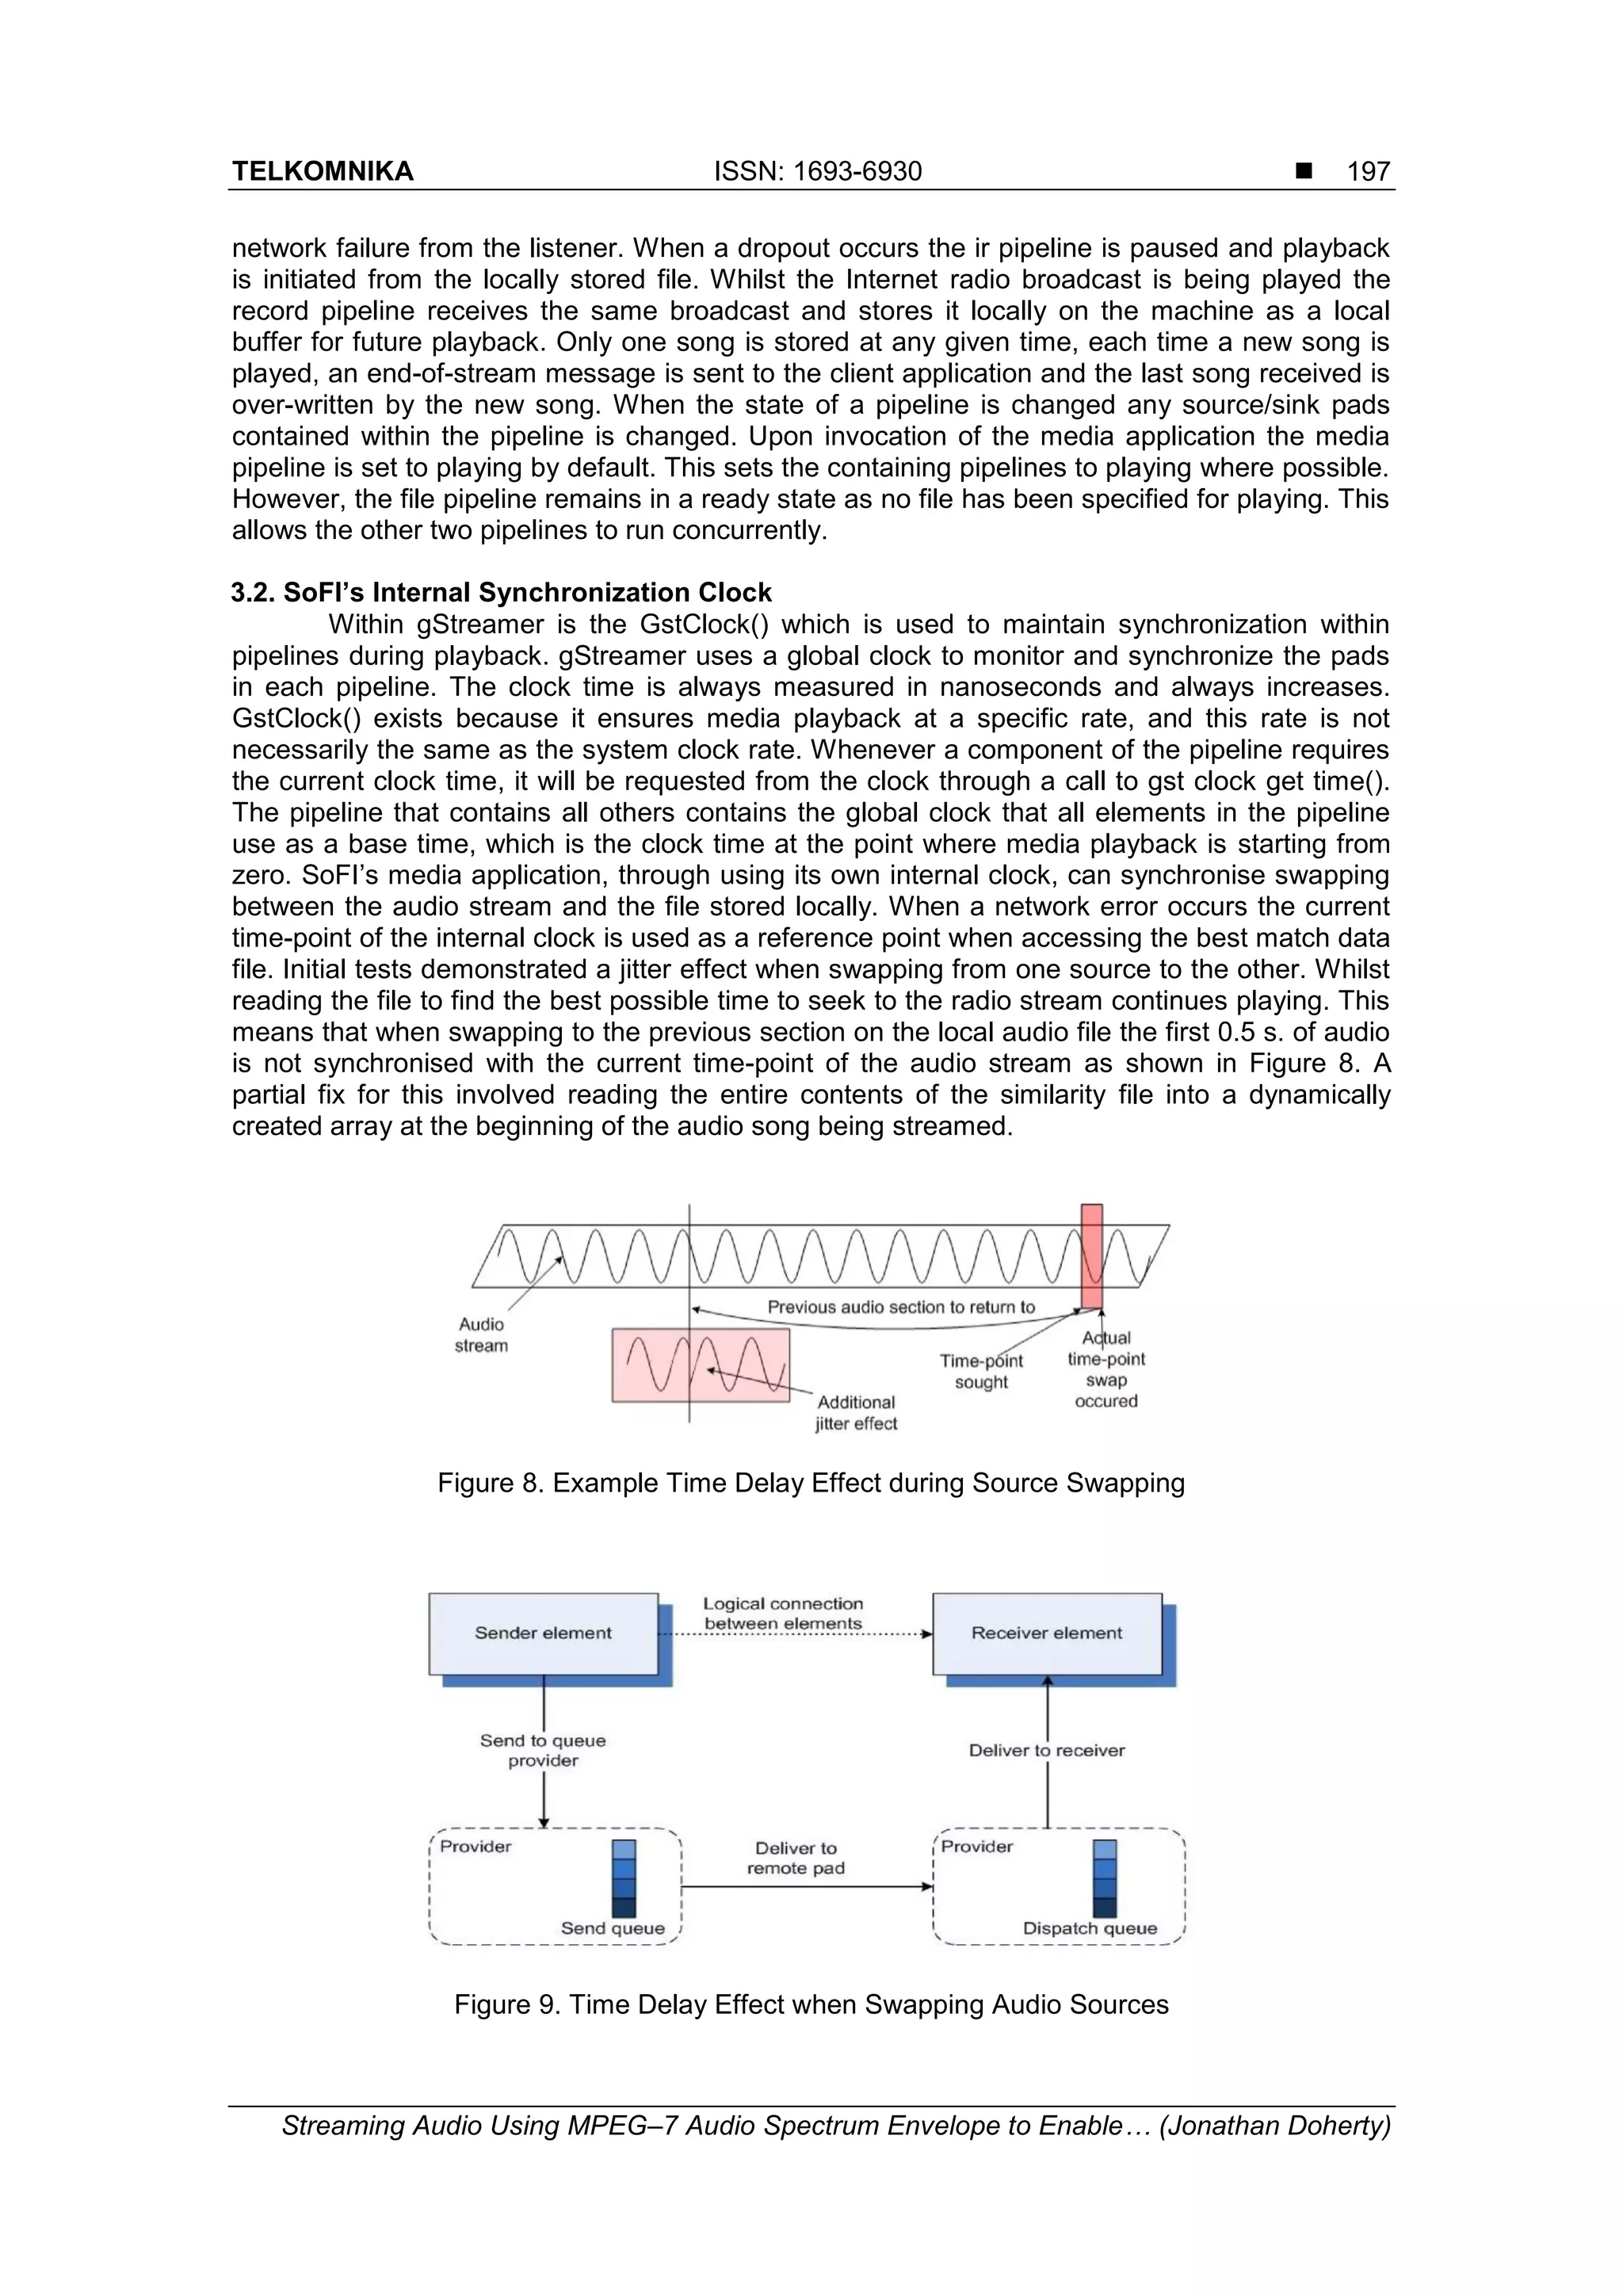
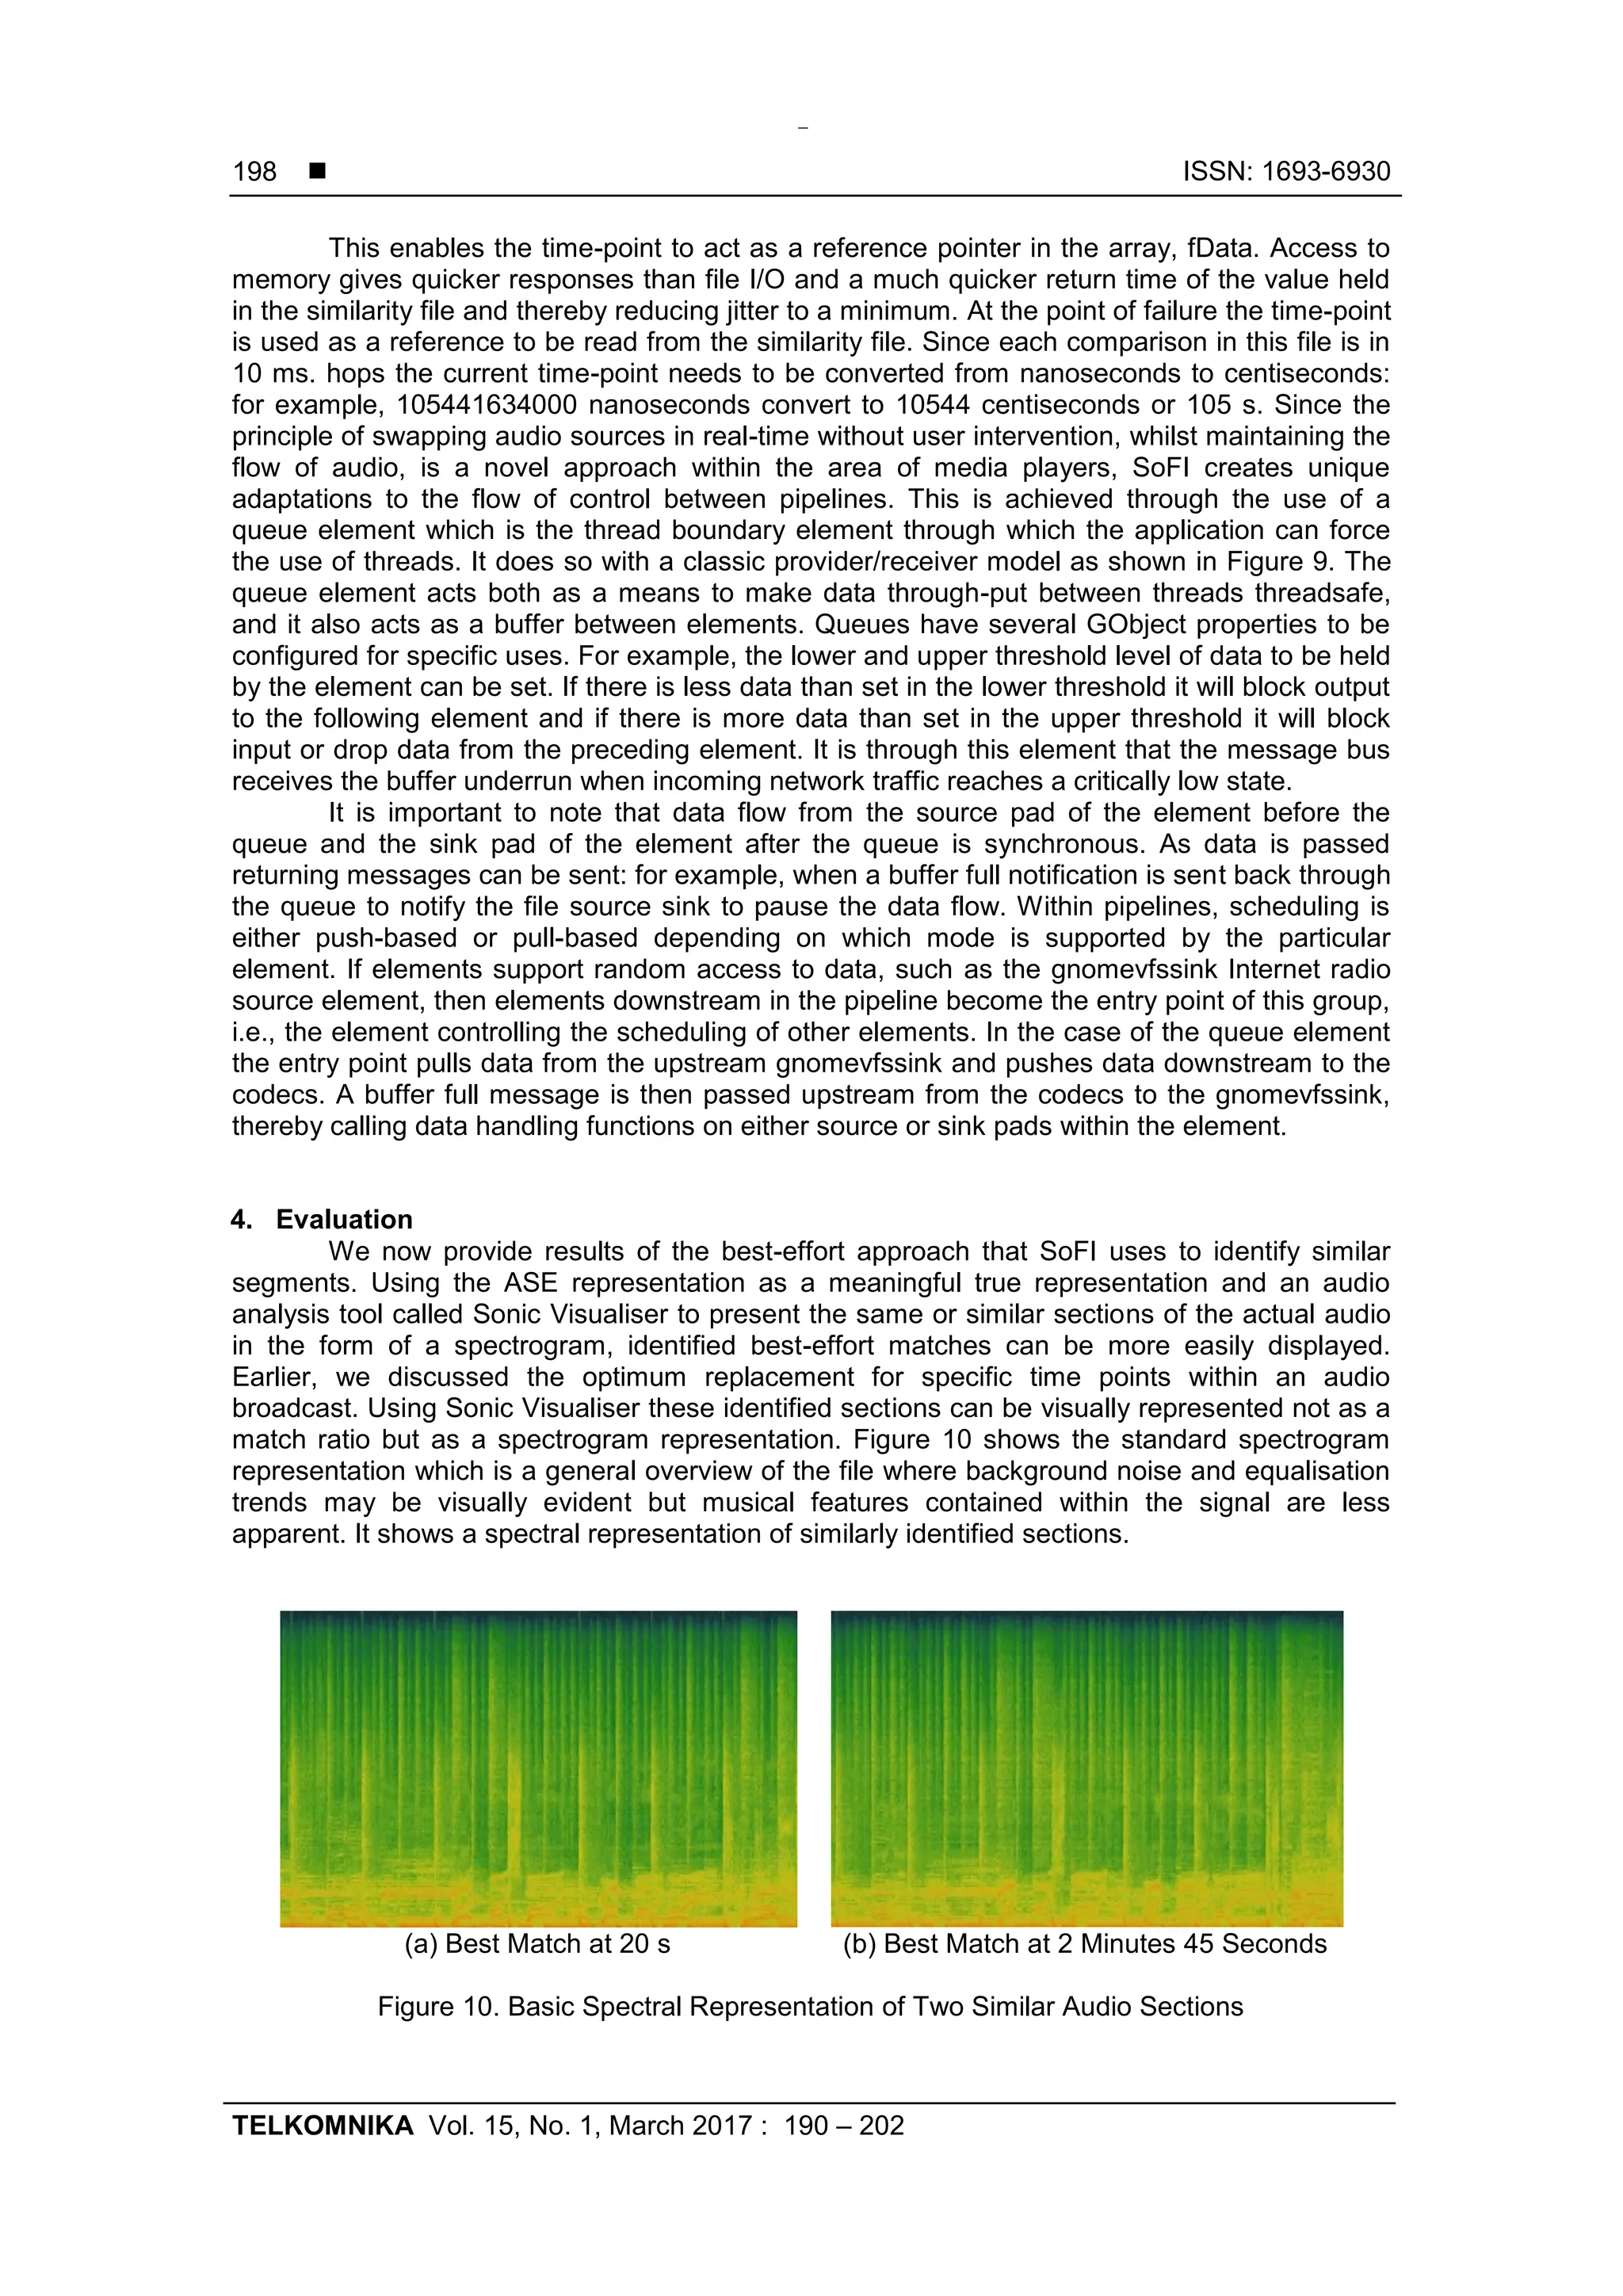
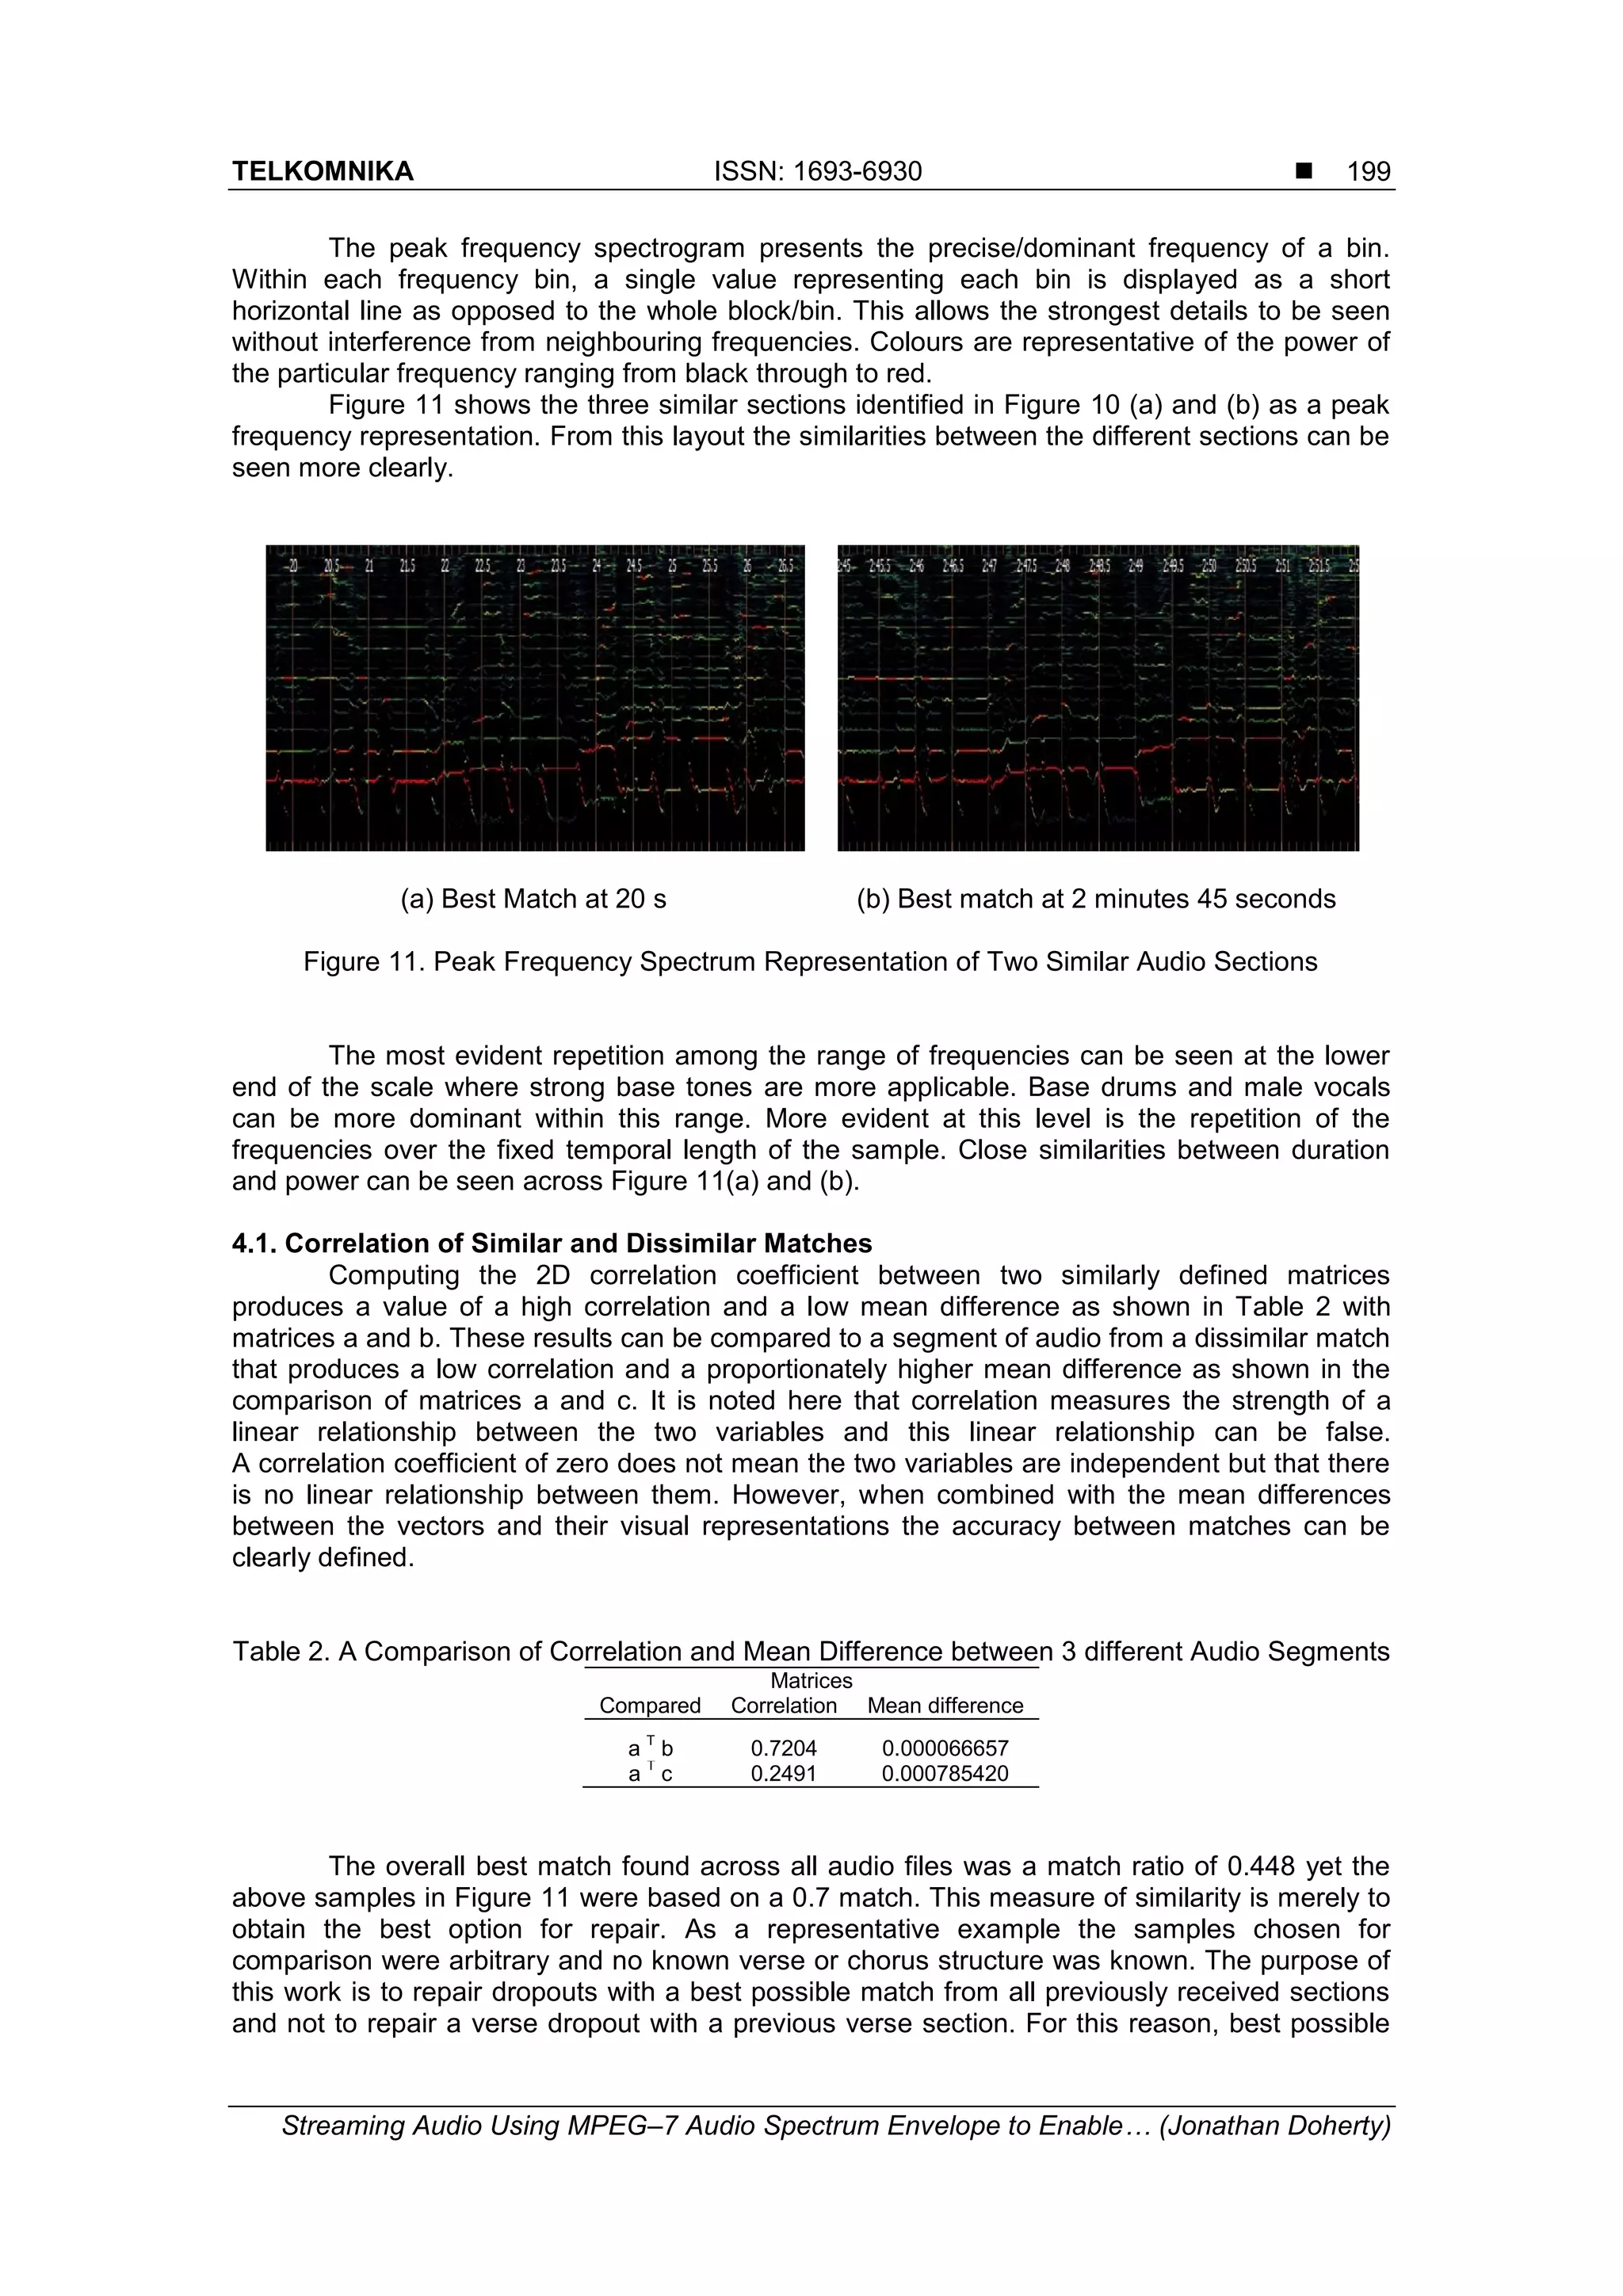
The document discusses a method for improving audio streaming quality over networks by utilizing MPEG-7 audio spectrum envelope for self-similarity detection in polyphonic audio. It highlights the limitations of traditional error correction methods and presents strategies for metadata tagging and similarity analysis to enhance music information retrieval. Advanced approaches such as k-means clustering and feature extraction are outlined, emphasizing the importance of retaining significant data while reducing dimensionality for effective audio classification and retrieval.
![TELKOMNIKA, Vol.15, No.1, March 2017, pp. 190~202
ISSN: 1693-6930, accredited A by DIKTI, Decree No: 58/DIKTI/Kep/2013
DOI: 10.12928/TELKOMNIKA.v15i1.4581 190
Received October 2, 2016; Revised December 18, 2016; Accepted January 12, 2017
Streaming Audio Using MPEG–7 Audio Spectrum
Envelope to Enable Self-similarity within Polyphonic
Audio
Jonathan Doherty, Kevin Curran*, Paul McKevitt
School of Computing and Intelligent Systems, Faculty of Computing and Engineering, Ulster University,
Derry, Northern Ireland, United Kingdom BT48 7JL
*Corresponding author, e-mail: kj.curran@ulster.ac.uk
Abstract
The ability of traditional packet level Forward Error Correction approaches can limit errors for
small sporadic network losses but when dropouts of large portions occur listening quality becomes an
issue. Services such as audio-on-demand drastically increase the loads on networks therefore new, robust
and highly efficient coding algorithms are necessary. One method overlooked to date, which can work
alongside existing audio compression schemes, is that which takes account of the semantics and natural
repetition of music through meta-data tagging. Similarity detection within polyphonic audio has presented
problematic challenges within the field of Music Information Retrieval. We present a system which works
at the content level thus rendering it applicable in existing streaming services. Using the MPEG–7 Audio
Spectrum Envelope (ASE) gives features for extraction and combined with k-means clustering enables
self-similarity to be performed within polyphonic audio.
Keywords: MPEG–7, Music Information Retrieval (MIR), packet loss, wireless networks, multimedia
streaming
Copyright © 2017 Universitas Ahmad Dahlan. All rights reserved.
1. Introduction
Structuring a query for music is made difficult owing to the varying representations and
interpretations including natural transitions in music. Adding to the complexity of music structure
and query structure is the method of audio analysis. The format of an audio file limits its type of
use since different file formats exist to allow for better reproduction, compression and analysis.
Hence it is also true that different digital audio formats lead to different methods of analysis.
Musical Instrument Digital Interface (MIDI) files were created to distribute music playable on
synthesisers of both the hardware and software variety among artists and equipment and
because of its notational style the MIDI format allows analysis of pitch, duration and intensity [1].
An excellent tool for analysis of MIDI files is the MIDI Toolbox [2] which is based on symbolic
musical data but signal processing methods are applied to cover such aspects of musical
behaviour as geometric representations and short-term memory. Previous work within
polyphonic music has shown that similarity within different sections of a piece of music can aid
in both pattern matching for searching large datasets and pattern matching within a single audio
file [3]. Results from analysis of an audio stream are stored in a similarity matrix created by [4].
The similarity matrix is generated by measuring the difference between row and column for the
same data. Data along the i
0
,j
0
to i
1
,j
1
diagonal will have an exact similarity, but any comparisons
‟off‟ the diagonal give a measure of how similar the two values are. Analysis is performed using
short time Fourier transform to determine the spectral properties of the segmented audio, this is
a variation of the discrete Fourier transform which allows for the influence of time as a factor [5]
used chroma based spectrum analysis technique to identify the chorus or refrain of a song by
identifying repeated sections of the audio waveform with the results also being stored in a
similarity matrix. The following range of applications vary from database search/retrieval
applications and indexing systems that allow quicker user browsing, to automatic music
replication systems based on a specific composer‟s style. It should be noted that music
recognition is still only in its infancy and has limited accurate results. The recognition of scanned
text can have an accuracy of up to 95%, programs using speech recognition have 70-80%](https://image.slidesharecdn.com/224581-200902090146/75/Streaming-Audio-Using-MPEG-7-Audio-Spectrum-Envelope-to-Enable-Self-similarity-within-Polyphonic-Audio-1-2048.jpg)
![TELKOMNIKA ISSN: 1693-6930
Streaming Audio Using MPEG–7 Audio Spectrum Envelope to Enable… (Jonathan Doherty)
191
accuracy, whereas systems for music recognition only claim a 60-70% accuracy rating
depending on the audio format, although new research is producing results of up to 90% when
using the MIDI format [6].
MELody inDEX [7] is a ‟Query-by-Humming‟ application similar to systems which allows
a user to use a microphone to enter notes by humming a tune and then searches in a database
for a similar match. To match user input with content held in the database, MELDEX primarily
uses pitch and the fundamental frequency to process the signal for similarity matching.
MELDEX filters the input to remove as many harmonics as possible, while preserving the
fundamental frequency. The beginnings and ends of notes are defined using a technique
primarily found in voice recognition, notes are dependent on the user using 'ta' or 'da' to hum the
input, this causes a drop in amplitude of the waveform of 60ms at each utterance allowing each
note to be more easily identified. MELDEX then uses ‟string-matching‟ to identify the input from
the user with audio held in a database using approximation to score the results which are
returned in order of accuracy. Similarly, the Melody Hound melody recognition system [8]. It was
originally known as „Tuneserver‟ and hosted by the University of Karlsruhe. It was designed
initially for Query by Whistling, i.e. it will return the song in the database that most closely
matches a whistled query. A more unusual method of input is where the user can enter
information about a song in the form of Parson‟s code. Each pair of consecutive notes is coded
as “U” (“up”) if the second note is higher than the first note, “R” (“repeat”) if the pitches are
equal, and “D” (“down”) otherwise. The first note of any tune is the reference point so it does not
show up explicitly in the Parsons code and is entered as an asterisk (*) [9] showed that this
simple encoding of tunes, which ignores most of the information in the musical signal, can still
provide enough information for distinguishing between a large number of tunes. Figure 1 shows
the first line of a “12 Bar Blues” music score with the resultant Parson‟s Code.
Figure 1. Parson‟s Code Representation of a Music Score
Humdrum is a general-purpose software system intended to assist music [10]. The
syntax provides a common framework for representing information in ASCII format. Within the
syntax an endless number of representation schemes can be ‟user defined‟. The Humdrum
Toolkit provides a set of more than 70 inter-related software tools.
Themefinder [11] identifies common themes in Western classical music, Folksongs, and
Latin Motifs of the sixteenth century. Themefinder provides a web-based interface of the
Humdrum toolkit which indexes musical data for searching [10]. This in turn allows searching of
databases containing musical themes. Currently, the most commonly used Humdrum
representation is **kern. Kern is a core pitch/duration representation.
C-BRAHMS (Content-Based Retrieval and Analysis of Harmony and other Music
Structures) [12] concentrates on retrieving polyphonic music from large scale music databases
containing symbolically encoded music. C-Brahms uses a number of different algorithms that
allow music to be in various formats, including MIDI, monophonic and polyphonic. It also allows
partial and exact matching approaches. C-Brahms uses a geometric representation of both the
query pattern and the source pattern allowing a Euclidean measurement of difference.
CubyHum is a ‟Query by Humming‟ application [13] that attempts to detect pitches in a
sung melody and compares these with symbolic representations of known melodies within a
stored database. CubyHum estimates the pitch from the query by a technique called sub-
harmonic summation (SHS) that was initially proposed by [14]. In short time frames SHS
computes the sum of harmonically compressed spectra and selects the maximum sum result as
the pitch estimate in that time frame. Standard signal processing techniques using short-time
energy, pitch level shifts and amplitude envelopes are then used for finding note onsets. The](https://image.slidesharecdn.com/224581-200902090146/75/Streaming-Audio-Using-MPEG-7-Audio-Spectrum-Envelope-to-Enable-Self-similarity-within-Polyphonic-Audio-2-2048.jpg)
![ ISSN: 1693-6930
TELKOMNIKA Vol. 15, No. 1, March 2017 : 190 – 202
192
resultant data is then combined to describe the pitch and duration of the query allowing normal
transcription to the MIDI format for comparison with songs stored in the database.
Notify! Whistle is a query by whistling/humming system for melody retrieval similar to
CubyHum along with a similar conversion of user queries to a MIDI format. By using a piano roll
representation of the query the user is allowed to change the original input to account for errors
[15]. However, unlike CubyHum which uses a string-based approach for comparisons, [15] uses
an index-based approach for pattern matching. By describing songs as notes within documents
represented by the form Di N and queries as Q N allows queries to be performed using set
theory and is an alternative approach to the problem of incorrect notes and mismatches that are
common with user generated input queries.
Muscle Fish’s content-based retrieval CBR technology searches for audio files on the
basis of how they sound [16, 17]. It can also be used to classify sound files or live sound inputs.
An additional feature of Muscle Fish is its ability to cluster sound files according to category and
search for sounds that are similar in their features. Muscle Fish‟s approach is to analyze sound
files for a specific set of psychoacoustic features. This results in a query vector of attributes that
include loudness, pitch, bandwidth and harmonicity. A covariance-weighted Euclidean
(Mahalonobis) distance is then used as a measure of similarity between a given sound example
and all other sound examples. Sounds are then ranked by distance with the closer ones being
more similar.
2. Visualizing Structure and Repetition in Music
Pre-processing a song and storing the results for future on-the-spot repair is a-run-
once-and-use-many-times approach to improving a listener's experience when less than
optimum conditions occur. Linear Predictive Coding and Linear Interpolation have been a
popular choice for attempting Forward Error Correction (FEC), but limitations on signal analysis
can give a poor overall listening experience. The use of MPEG–7 as an initial representation of
an audio signal greatly reduces the preprocessing required whilst retaining as much of the
relevant information as possible. Many applications use MPEG–7 as a metadata description tool
to form a database of standardised audio signal content with emphasis on the low-level physical
content primarily to supplement the metadata already stored. By combining the MPEG–7
metadata with the MP3 metadata can widen the search criteria for current and future
applications. This content can facilitate general search queries but can also be useful as a data
reduction method for similarity analysis.
The core MPEG–7 representation, the Audio Spectrum Envelope (ASE) as shown in
Figure 2, is used here as the foundation for similarity analysis. Where an audio waveform only
gives the peak height of the power of the frequency, the ASE gives an equal representation
across the full spectrum and repeating patterns become more visible. Using correct features
and levels of detail are crucial for the classification of sections of audio since small changes to
settings can have very different results. A classification algorithm will always come up with some
kind of result, but a poor choice of feature extraction will lead to a result that does not reflect the
true nature of the underlying data e.g. using the MPEG–7 Spectral Centroid instead of the
Temporal Centroid when determining the temporal properties of audio. The purpose of MPEG-7
feature extraction is to obtain a low-complex description of the content of the audio source. A
balanced trade-off between reducing the dimensionality of data and retaining maximum
information content must be performed. Too many dimensions cause problems with
classification, whilst dimensionality reduction invariably introduces information loss. Our goal is
thus to maximize the amount of information per dimension whilst maintaining a minimal sized
dataset. As with all forms of analysis/data reduction when performed on time-dependent data,
the problem of generalisation occurs. Figure 3 shows this in more detail where the same note is
repeated but the extracted signal value for the repeated note varies slightly from the original.
This is due to windowing attributed to DSP where signals are sampled at discrete time points
and it is expected that some deviation will occur. The differences shown are for one frequency
band within the ASE but this effect occurs within all frequency bands of the sample, as is shown
in Table 1 regardless of the hopsize. Although the differences between notes A and B appear to
be small it must be noted that they are represented in a log frequency scale where small
differences can represent very different audio signals.](https://image.slidesharecdn.com/224581-200902090146/75/Streaming-Audio-Using-MPEG-7-Audio-Spectrum-Envelope-to-Enable-Self-similarity-within-Polyphonic-Audio-3-2048.jpg)
![TELKOMNIKA ISSN: 1693-6930
Streaming Audio Using MPEG–7 Audio Spectrum Envelope to Enable… (Jonathan Doherty)
195
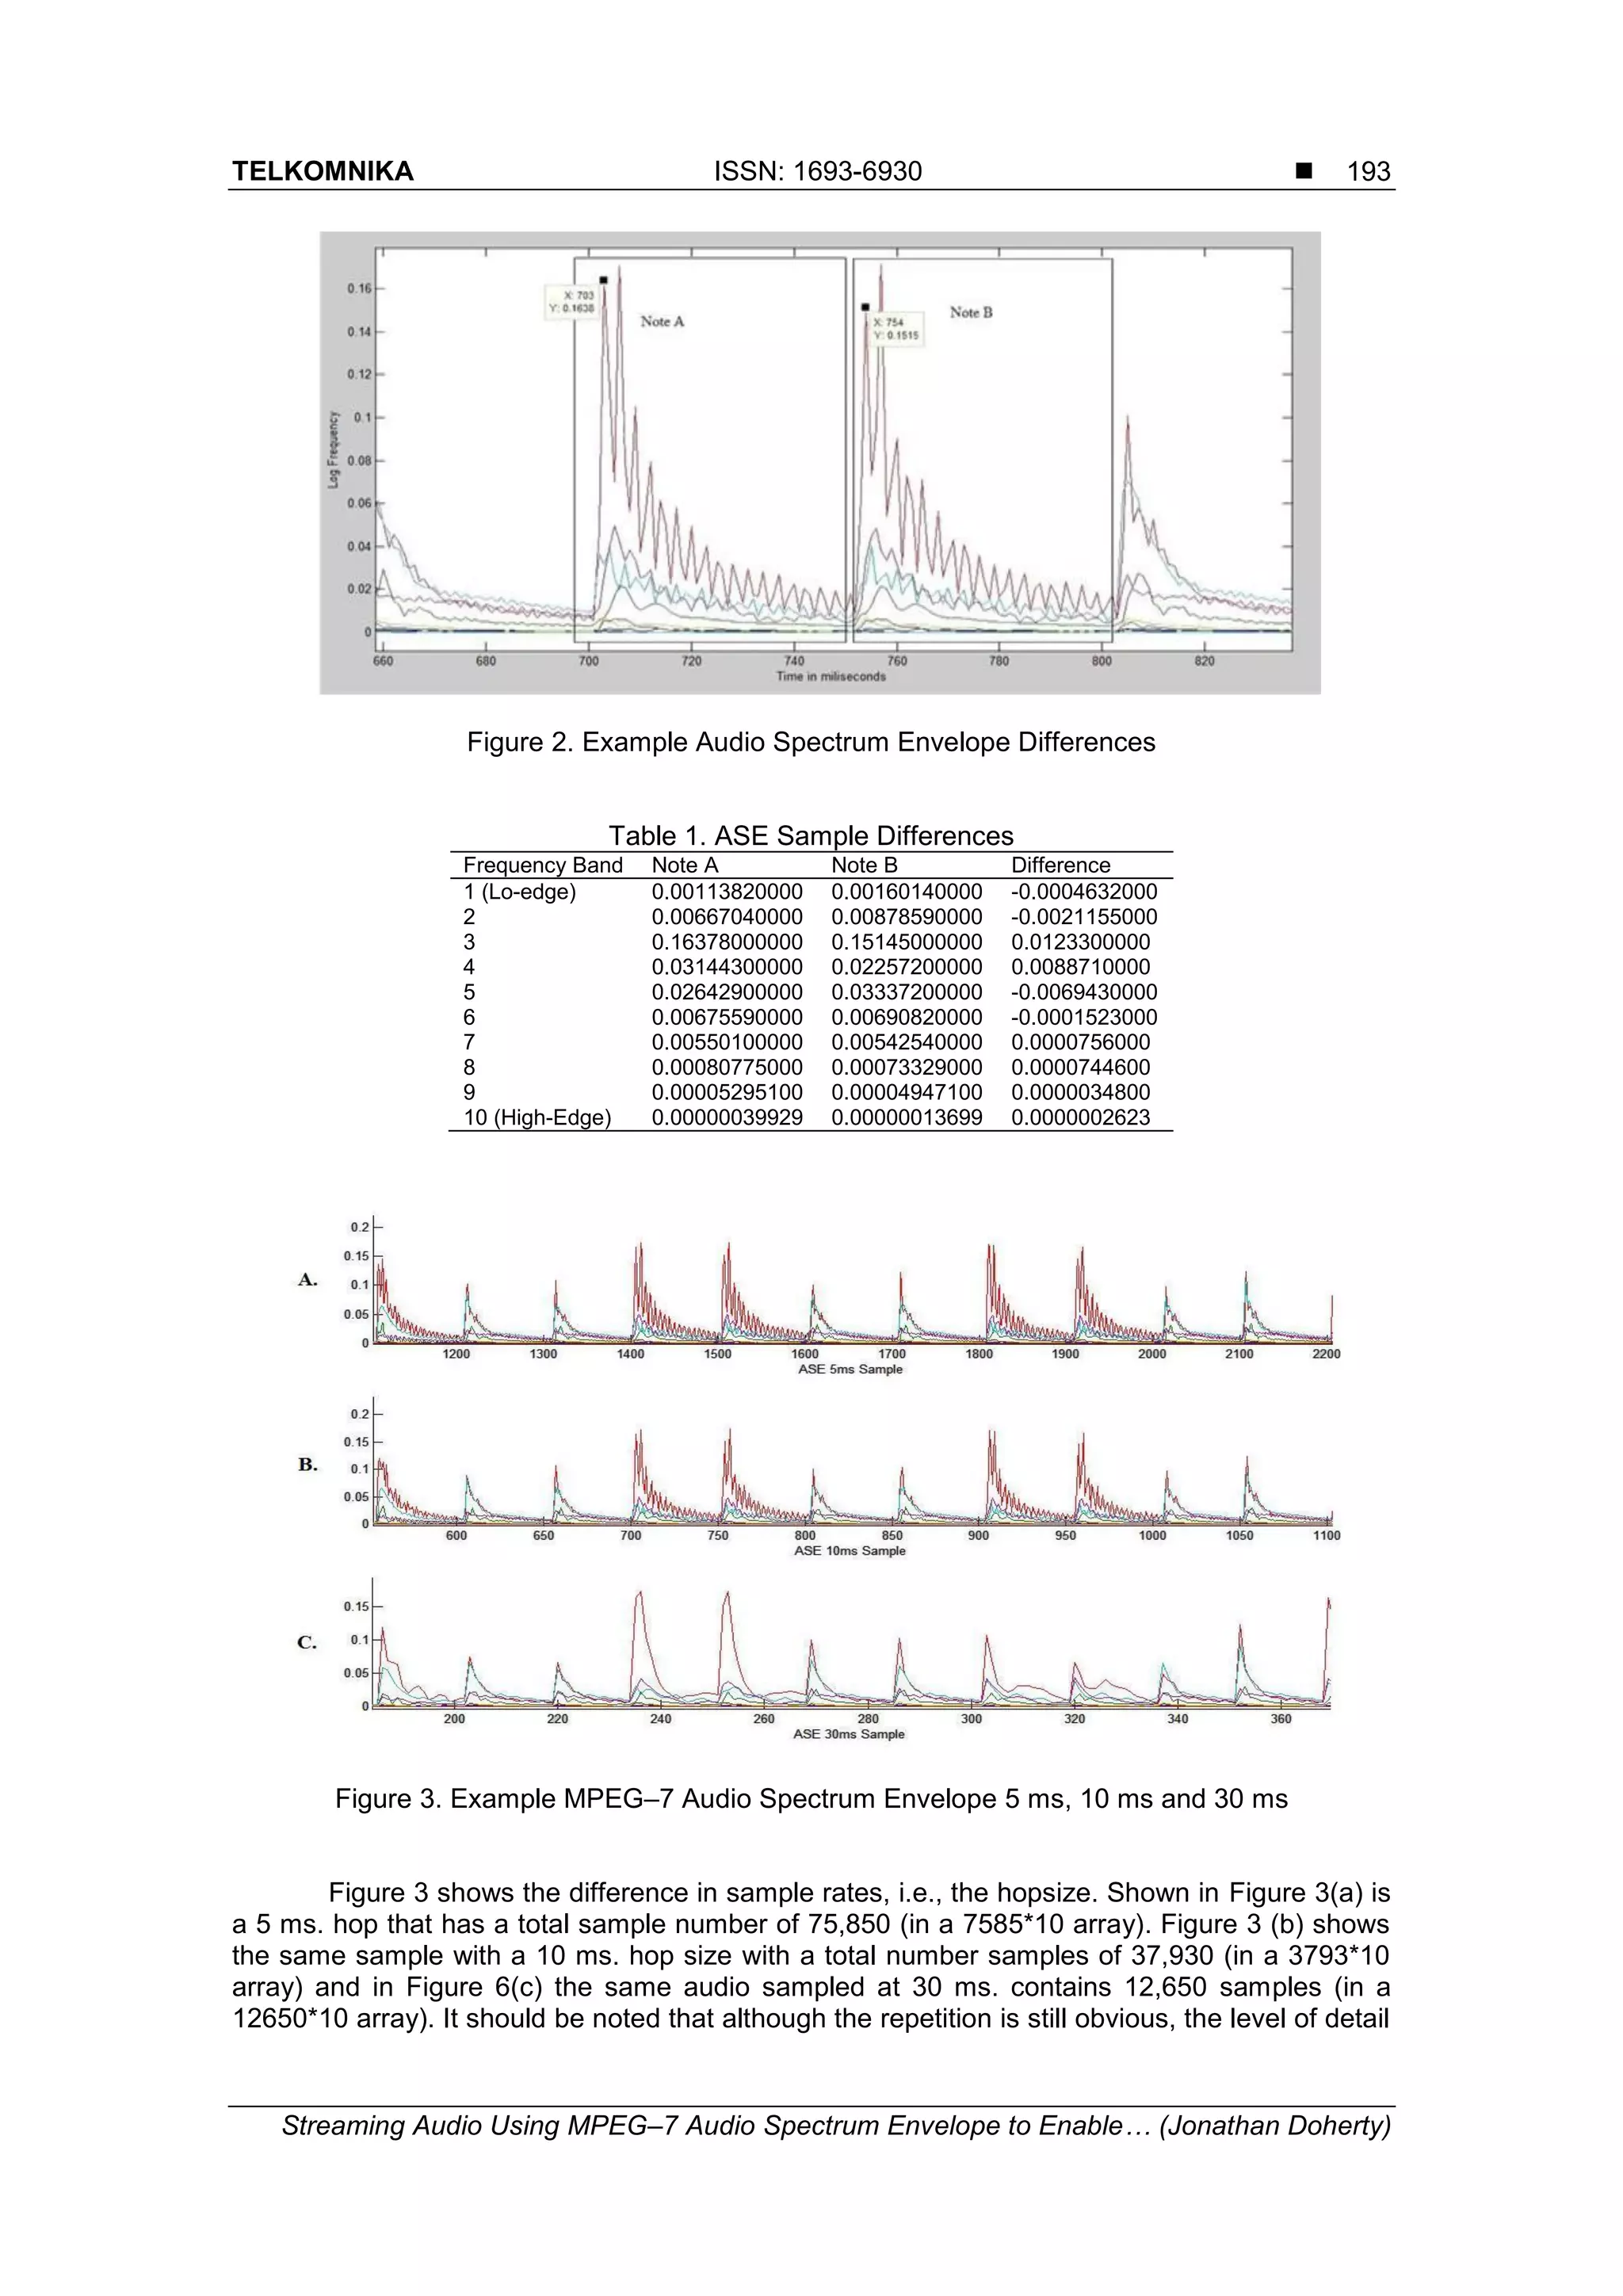
frequency can be extracted/determined. In addition, the more convoluted the audio is, the more
difficult it becomes to obtain usable results.
Figure 6 shows the fundamental frequencies of two different pieces of music as defined
by the MPEG–7 standard. Figure 6(a) is the analysis of the 12 Bar Blues used throughout this
work, and Figure 6(b) is a similar length of music but from a song in Western Tonal Format
(WTF), with at least two repeating sections containing multiple instruments and vocals. Whereas
the repeating pattern of the 12 Bar Blues can be seen clearly in Figure 6(a) the repetition is lost
when multiple instruments and vocals are added as shown in Figure 6(b). The contrast between
drums, guitars and vocals can change the fundamental frequency estimation dramatically.
Figure 6. Example MPEG–7 Fundamental Frequency of Two Audio Signals
Having polyphonic audio in a clustered format allows the identification of large sections
of audio to be performed with various string matching techniques. We previously outlined
various methods of measuring the differences/distance between two fixed length strings which
are again dependent on the nature of the data. Although the clusters presented earlier are
identified by digits there is no actual numerical association other than as an identifier hence the
clusters are presented in a nominal scale. For example, consider the sequence of numbers 1, 2,
3. It can be said that 3 is higher than 2 and 1, while 2 is higher than 1. However, during the
clustering process when two similar samples are found they could be as easily identified by
using characters or symbols provided a nominal scale is used. By comparing a string of clusters
using the hamming scale any metric value is ignored and only the number of differences
between the two strings is calculated. However, if a ranking system is applied then ordinal
variables can be transformed into quantitative variables through normalization. To determine
distance between two objects represented by ordinal variables, it needs to transform the ordinal
scale into ratio scale. This allows the distance to be calculated by treating the ordinal value as
quantitative variables and using Euclidean distance, city block distance, Chebyshev distance,
Minkowski distance or the coefficient correlation as distance metrics. Without rank the most
effective measure is the hamming distance
3. Song Form Intelligence (SoFI) Audio Repair Framework
The settings used for extraction are stored in XML. The low and high edge thresholds
are set to 16 KHz. and 62.5 Hz respectively. These settings are shown to be the upper and
lower bounds of the human auditory system [18]. Sounds above and below these levels are of
little value and present no additional information that can be utilised when extracting the
frequencies. Experiments with values above and below these levels produced results with no
gain and more detrimental output as the resultant data was clouded with noise that did not
belong to the audio being analysed. It should be noted that the Joanneum Research facility [19]](https://image.slidesharecdn.com/224581-200902090146/75/Streaming-Audio-Using-MPEG-7-Audio-Spectrum-Envelope-to-Enable-Self-similarity-within-Polyphonic-Audio-6-2048.jpg)
![TELKOMNIKA ISSN: 1693-6930
Streaming Audio Using MPEG–7 Audio Spectrum Envelope to Enable… (Jonathan Doherty)
201
Using a ten point Likert scale
,
test subjects were given eight audio files to listen to in
succession and asked to rate the repair in a questionnaire form. Since the tests were to be the
same for each listener the audio repair in each song was simulated and stored locally as a wave
file. Using sample time-points that have been identified as similar within the collection of songs,
specific experiments were executed at predetermined time-points. The point of failure for each
song was decided by the particular test, i.e. a verse failure, at the beginning of the song and
even the duration of the dropout. The audio files were then reconstructed based on the
identified segments using a wave editor to ensure precise matching of time-points. This
removed any possible ambiguity introduced by re-running the audio broadcasts multiple times
with varying network characteristics. Each song was evaluated when it had completed and
before the next began. Once all songs had been played at least once a general rank for all the
songs was requested from each test subject. This rank was based on an order of preference of
one to eight with one being the most favored method of repair and eight the least favored.
5. Conclusion
We have discussed the problems and solutions for repairing dropouts whilst streaming
audio across wireless bursty networks. Previous research in the field of Music Information
Retrieval is presented, this includes query-by-humming, melody recognition, recommender
systems, and music representation in textural format, music indexing systems for similar music
queries, content based retrieval approaches, along with associated tools. We also investigated
the syntax and semantics of music as meaningful textural representations of music content.
Frequency and pitch detection were reviewed along with beat detection to aid in characterizing
the rhythm and tempo of music and audio. The problems associated with jitter and streaming
media were reviewed alongside systems that attempt repair at a network level. Having
examined the associated problems and previous work on identifying music similarity and audio
repair of time dependent audio broadcasts, we designed a framework that utilises self-similarity
identification for automatic re-pair of bursty dropouts in streamed audio. Feature extraction of
audio utilising MPEG–7 low level descriptors was presented as a method of data reduction that
allows for pertinent data to be retained whilst minimising the overall volume of data to be
analysed. A framework for feature extraction and similarity detection together with distance
measures of successful self-similarity detection presents a unique approach to the area of
receiver based audio repair when dropouts of time dependent audio are received. Based on this
framework SoFI (Song Form Intelligence), an intelligent media streaming/receiving system that
utilises self-similarity to repair bursty errors when receiving time dependent audio broadcasts
was implemented. Utilising the MPEG–7 audio spectrum envelope features, k-means clustering
and categorical measurement of distance segmentation and classification of audio in Western
Tonal Format was performed. Using the resultant output of the similarity identification processes
on the client side enabled SoFI to identify network dropouts and use previously received
sections of audio stored locally for best-effort replacement.
References
[1] Doraisamy S, Ruger S. A Polyphonic Music Retrieval System Using N-Grams. Proceedings of the
International Conference on Music Information Retrieval. 2004: 204-209.
[2] Eerola T, Toiviainen P. MIR in Matlab: The MIDI Toolbox. Proceedings of the International
Conference on Music Information Retrieval. 2004: 22-27.
[3] Meredith D, Wiggins G, Lemstrom K. Pattern Induction and Matching in Poly-phonic Music and Other
Multidimensional Datasets. Proceedings of the 5th World Multiconference on Systemics, Cybernetics
and Informatics (SCI2001). 2001: 22-25.
[4] Foote J, Cooper M. Media Segmentation Using Self-Similarity Decomposition. Proceedings of SPIE.
2003; 5021:167–175
[5] Bartsch M, Wakefield G. To Catch a Chorus: Using Chroma-based Representations for Audio
Thumbnailing. Applications of Signal Processing to Audio and Acoustics, 2001 IEEE Workshop on
2001: 15-18.
[6] Bryan N, Mysore G. Interactive User-Feedback for Sound Source Separation. International
Conference on Intelligent User-Interfaces (IUI), Workshop on Interactive Machine Learning. Santa
Monica. 2013.
[7] Cater A, O‟Kennedy N. You Hum it, and I’ll Play it. 11th Conference on Artificial Intelligence and
Cognitive Science. 2000.](https://image.slidesharecdn.com/224581-200902090146/75/Streaming-Audio-Using-MPEG-7-Audio-Spectrum-Envelope-to-Enable-Self-similarity-within-Polyphonic-Audio-12-2048.jpg)
![ ISSN: 1693-6930
TELKOMNIKA Vol. 15, No. 1, March 2017 : 190 – 202
202
[8] Prechelt L, Typke R. An Interface for Melody Input. ACM Transactions on Computer-Human
Interaction (TOCHI). 2001; 8(2): 133-149.
[9] Parsons D. Directory of Tunes and Musical Themes. S. Brown. 1975.
[10] Humdrum. The Humdrum Toolkit: Software for Music Research. 2008.
[11] Sapp HDC, Aarden B. Themefinder. 2008.
[12] Lemstrom K, Makinen V, Pienimaki A, Turkia M, Ukkonen E. The C-BRAHMS Project. In
Proceedings of the 4th Internationoal Conference on Music Information Retrieval (ISMIR). 2003: 237-
238.
[13] Pauws S. Cubyhum: A fully operational query by humming system. In ISMIR 2002 Conference
Proceedings. 2002: 187-196.
[14] Hermes D. Measurement of pitch by subharmonic summation. The Journal of the Acoustical Society
of America. 1988; 83: 257.
[15] Kurth F, Ribbrock A, Clausen M. Efficient Fault Tolerant Search Techniques for Full-Text Audio
Retrieval. Preprints-Audio Engineering Society. 2002.
[16] Wold E, Blum T, Keislar D, Wheaten J. Content-based classification, search, and retrieval of audio.
Multimedia, IEEE. 1996; 3(3): 27-36.
[17] Wold E, Blum T, Keislar D, Wheaton J. Classification, search, and retrieval of audio. Handbook of
Multimedia Computing. 1999: 207-226.
[18] Pan D, Inc M, Schaumburg I. A tutorial on MPEG/audio compression. Multimedia, IEEE. 1995; 2(2):
60-74.
[19] MPEG–7. MPEG 7 Library: A Complete API to Manipulate MPEG 7 Documents. Joanneum
Research. 2008.](https://image.slidesharecdn.com/224581-200902090146/75/Streaming-Audio-Using-MPEG-7-Audio-Spectrum-Envelope-to-Enable-Self-similarity-within-Polyphonic-Audio-13-2048.jpg)