The document is a study text for the Institute of Chartered Accountants of Nigeria focusing on strategic financial management. It outlines the essential competencies, content areas, and evaluation methods necessary for professional accountants to effectively manage financial strategies, risks, and investment decisions. The text includes various chapters on topics such as investment appraisal, risk management, corporate restructuring, and financial analysis.


![Strategic financial management
© Emile Woolf International 94 The Institute of Chartered Accountants of Nigeria
Solution 2
Project A Project B
Year Cash flow
Cumulative
cash flow Cash flow
Cumulative
cash flow
₦ ₦ ₦ ₦
0 (80,000) (80,000) (80,000) (80,000)
1 20,000 (60,000) 60,000 (20,000)
2 36,000 (24,000) 24,000 4,000
3 36,000 12,000
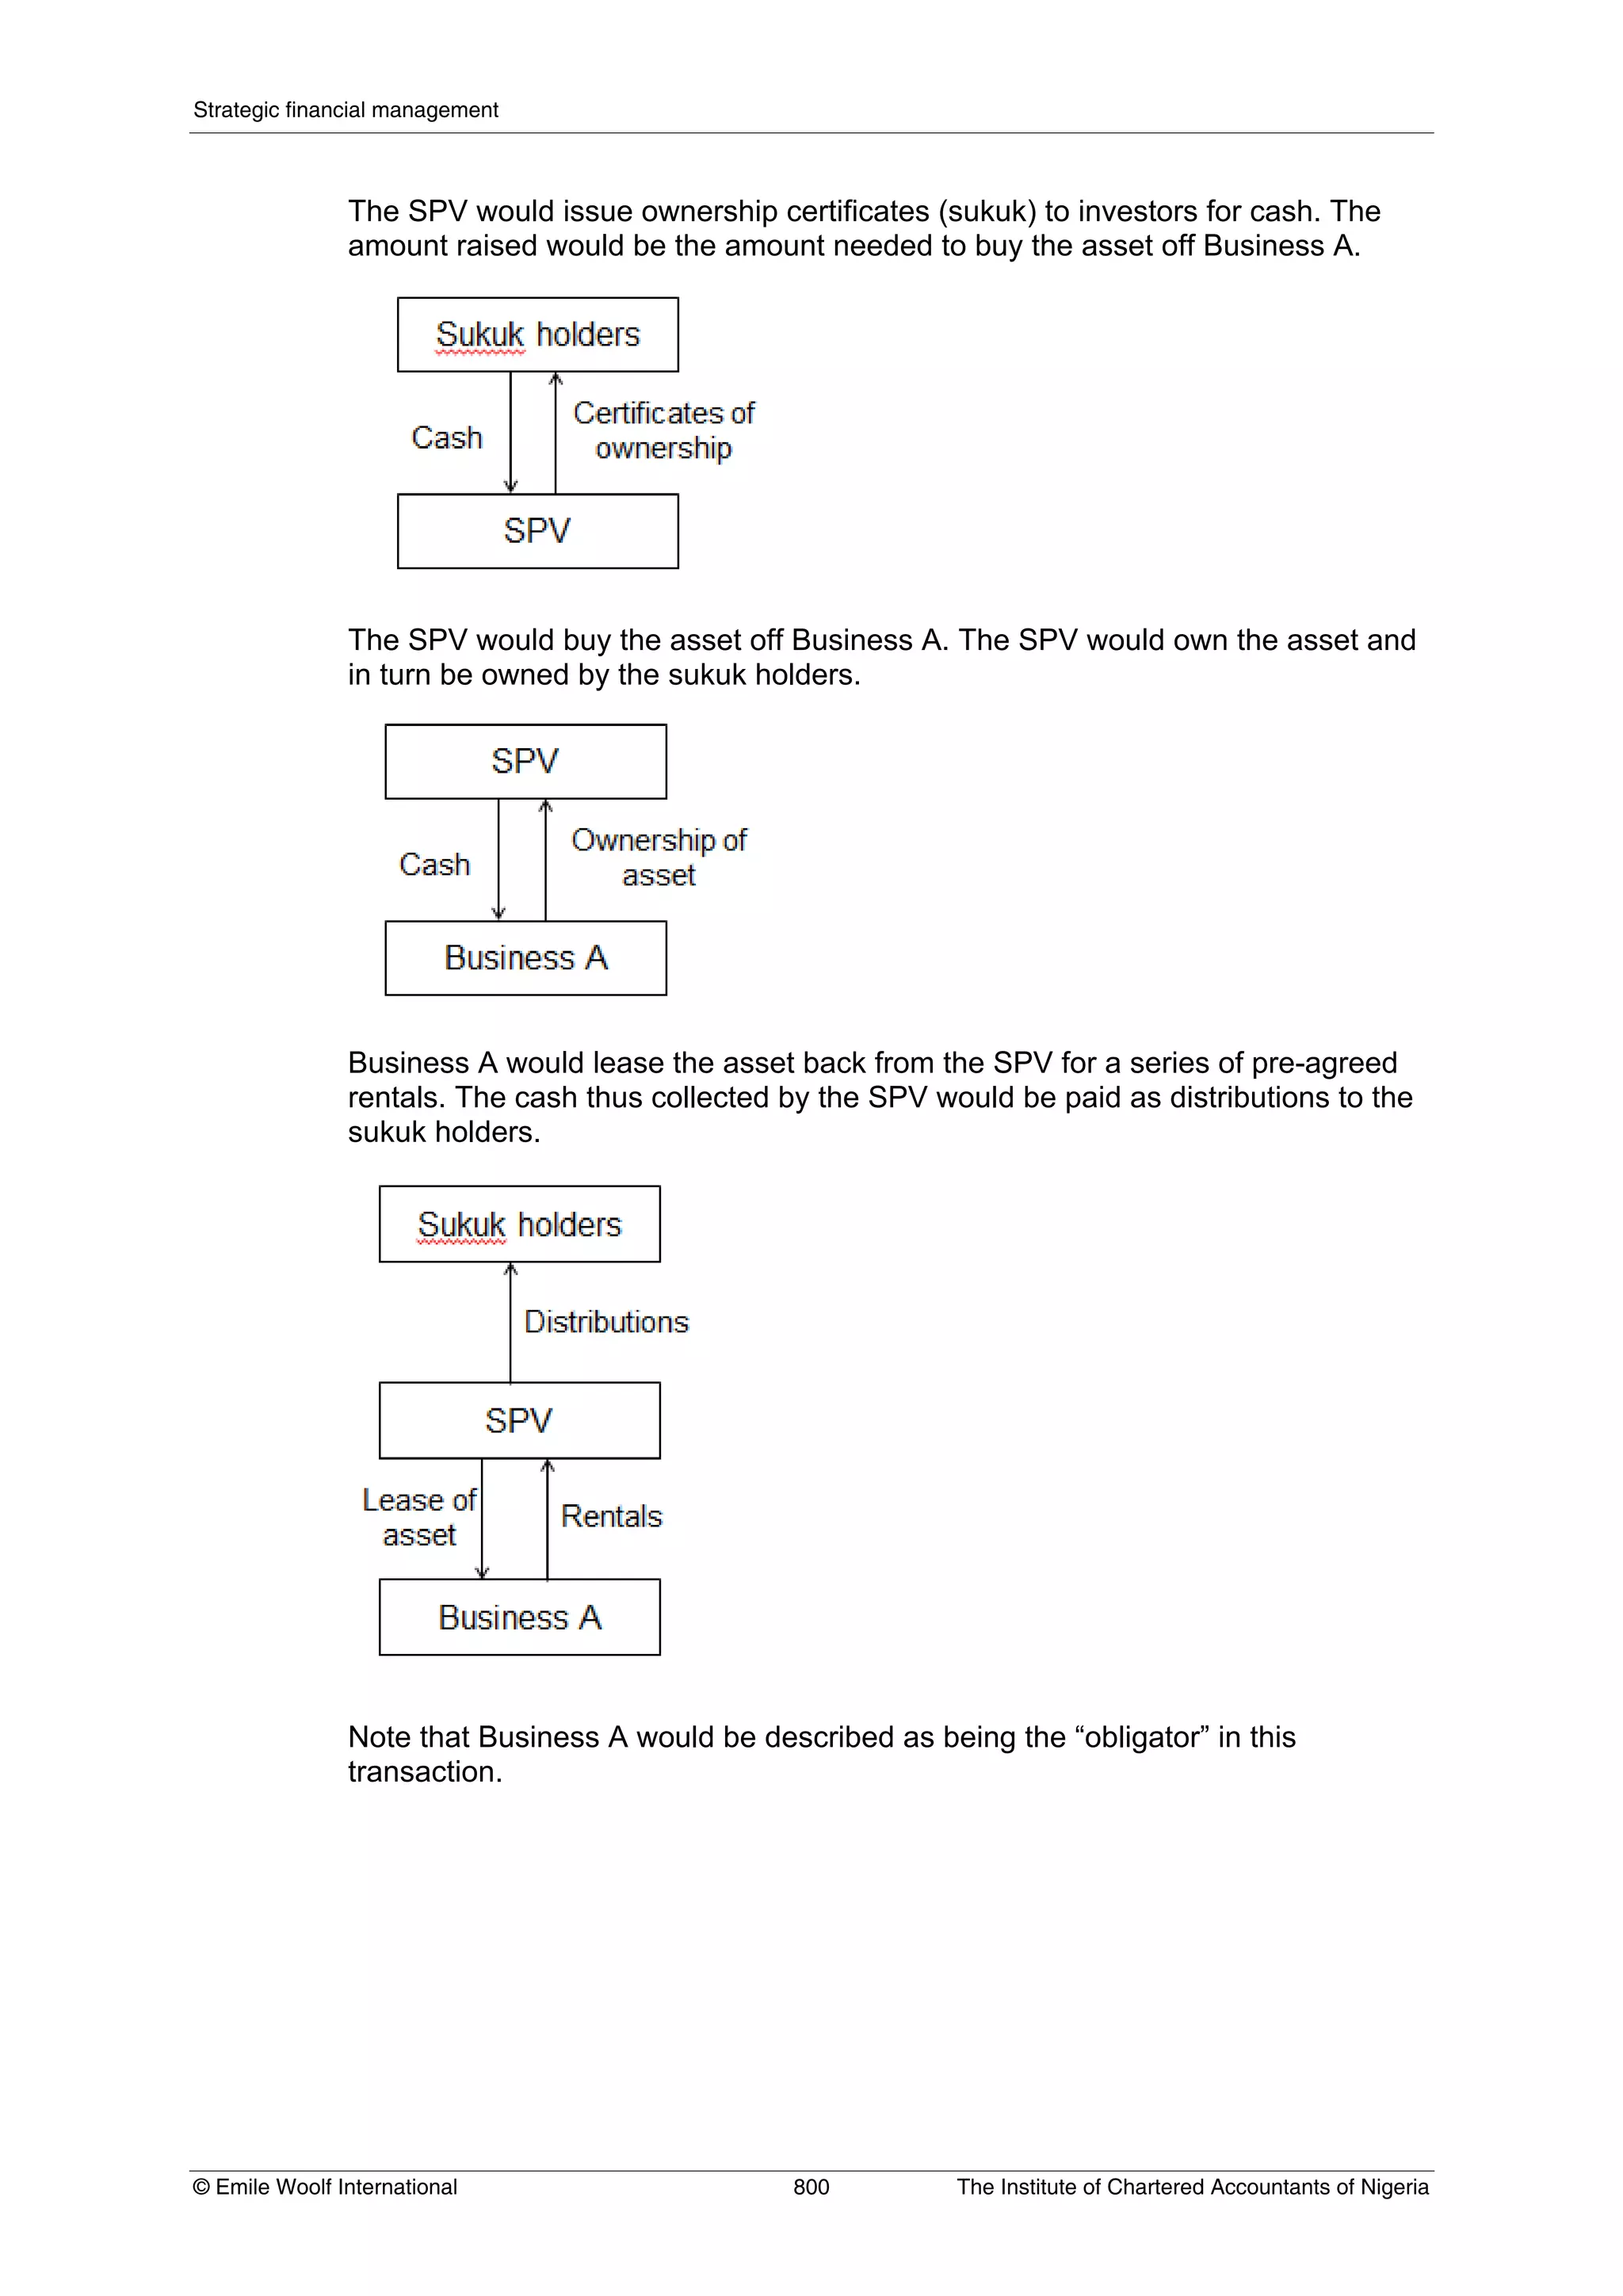
1a If cash flows occur at the end of each year, Project A will pay back after three
years and Project B will pay back after two years.
1b If cash flows occur at a constant rate throughout the year:
Project A will pay back after:
2 years + [(24,000/36,000) × 12 months] = 2 years 8 months.
Project B will pay back after:
1 year + [(20,000/24,000) × 12 months] = 1 year 10 months.
2) Both projects meet the policy requirement that investments must pay back
within three years. The preferred choice would be project B, which pays back
more quickly.
3) An investment decision should not be made on the basis of payback alone.
Payback ignores the total expected returns from a project. In this example,
project A is expected to be more profitable over its full life.
In addition, payback method ignores the time value of money.](https://image.slidesharecdn.com/strategicfinancialmanagement-230111084306-a2c2e0f5/75/Strategic-Financial-Management-pdf-106-2048.jpg)


![Strategic financial management
© Emile Woolf International 140 The Institute of Chartered Accountants of Nigeria
3.2 Discounting money cash flows at the money cost of capital
The cost of capital used in DCF analysis is normally a ‘money’ cost of capital.
This is a cost of capital calculated from current market returns and yields.
When estimates are made for inflation in future cash flows, the rules are as
follows:
Estimate all cash flows at their inflated amount. Since cash flows are
assumed to occur at the year-end, they should be increased by the rate of
inflation for the full year.
To estimate a future cash flow at its inflated amount, you can apply the
formula:
Cash flow in year n at inflated amount = [Cash flow at current price level] ×
(1 + i)n
(where i is the annual rate of inflation).
Discount the inflated cash flows at the money cost of capital, to obtain
present values for cash flows in each year of the project and the NPV for
the project.
Example: Discounting money cash flows at the money cost of capital
A company is considering an investment in an item of equipment costing
₦150,000. The equipment would be used to make a product. The selling price of
the product at today’s prices would be ₦10 per unit, and the variable cost per unit
(all cash costs) would be ₦6.
The project would have a four-year life, and sales are expected to be:
Year Units of sale
1 20,000
2 40,000
3 60,000
4 20,000
At today’s prices, it is expected that the equipment will be sold at the end of Year
4 for ₦10,000. There will be additional fixed cash overheads of ₦50,000 each
year as a result of the project, at today’s price levels.
The company expects prices and costs to increase due to inflation at the following
annual rates:
Item Annual inflation rate
Sales 5%
Variable costs 8%
Fixed costs 8%
Equipment disposal value 6%
The company’s money cost of capital is 12%. Ignore taxation.
Required
Calculate the NPV of the project.](https://image.slidesharecdn.com/strategicfinancialmanagement-230111084306-a2c2e0f5/75/Strategic-Financial-Management-pdf-152-2048.jpg)


![Chapter 7: DCF: risk and uncertainty
© Emile Woolf International 157 The Institute of Chartered Accountants of Nigeria
Practice questions
Using the information from the previous example:
2
a) Estimate the project’s sensitivity to the equipment costs being
higher than expected.
b) Estimate the project’s sensitivity to running costs being higher than
expected.
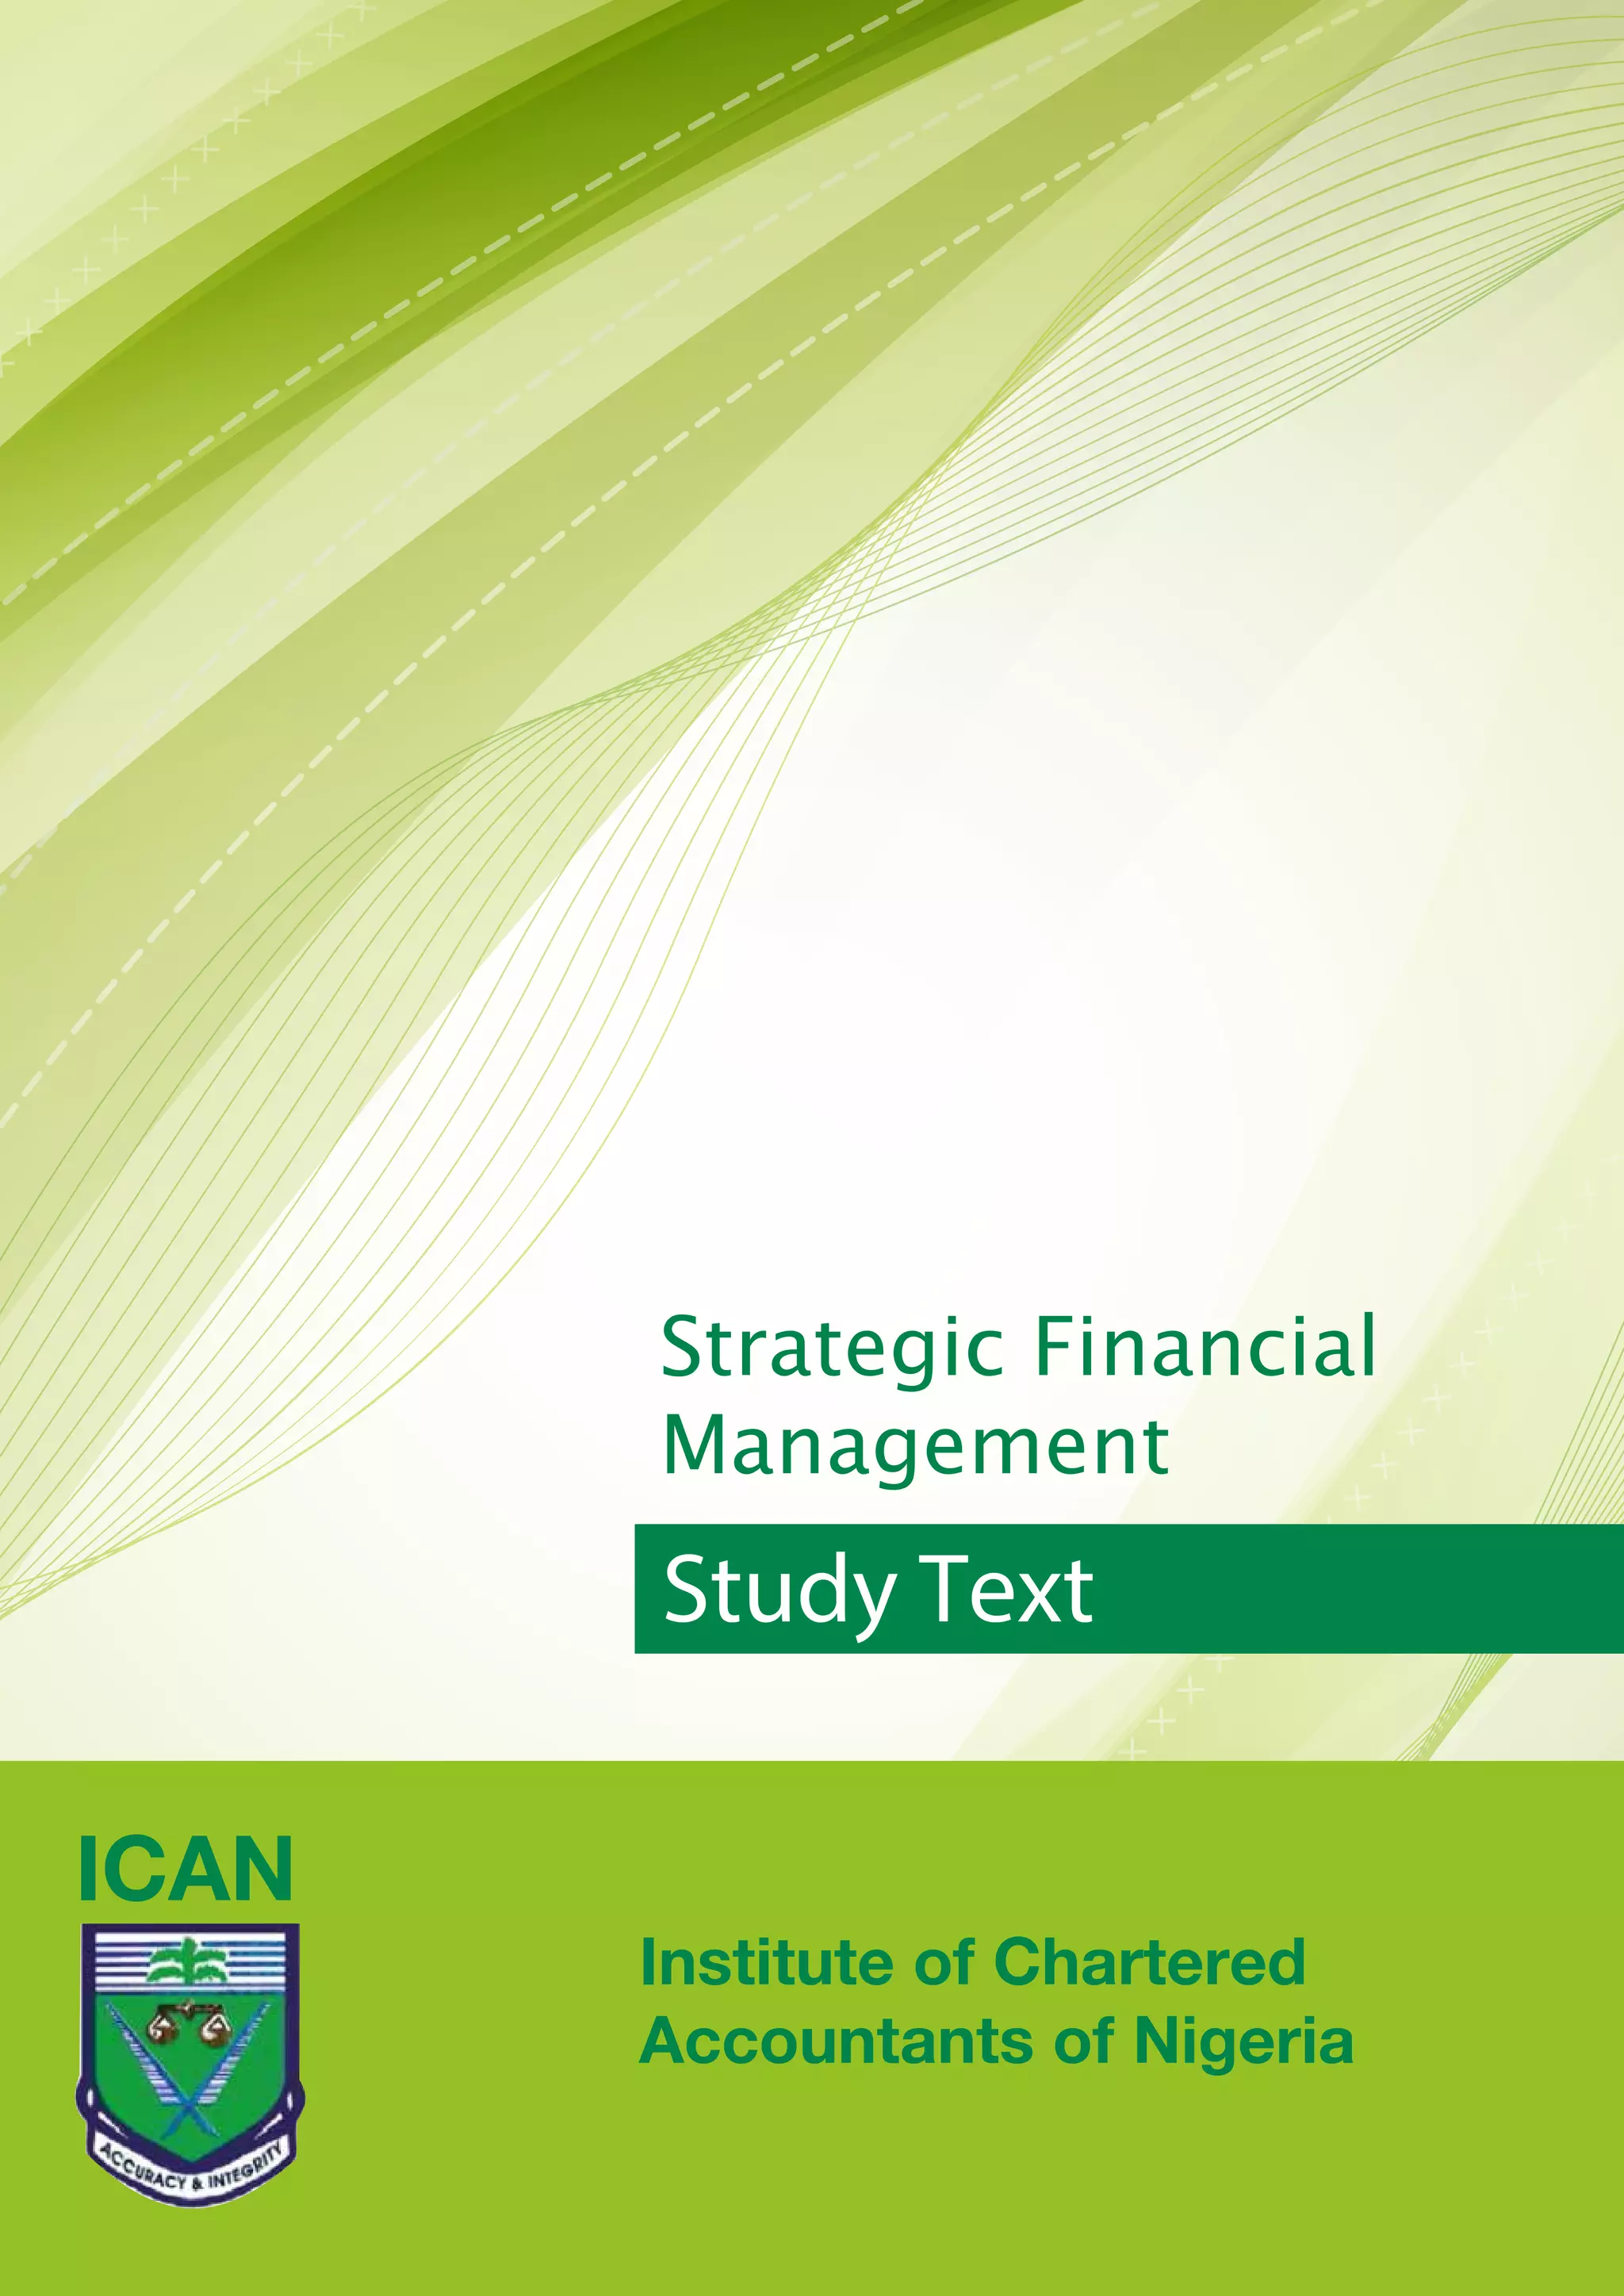
2.4 Estimating the sensitivity of a project to changes in the cost of capital
The sensitivity of the project to a change in the cost of capital can be found by
calculating the project IRR. This can be compared with the company’s cost of
capital.
Example:
A company is considering the following project:
Year Net cash
flow
DCF factor
at 15%
PV DCF factor
at 20%
PV
₦ ₦ ₦
0 (55,000) 1.000 (55,000) 1.000 (55,000)
1 15,000 0.870 13,050 0.833 12,495
2 25,000 0.756 18,900 0.694 17,350
3 30,000 0.658 19,740 0.579 17,370
4 10,000 0.572 5,720 0.482 4,820
NPV 2,410 (2,965)
IRR = 15% + [2,410 / (2,410 + 2,965) ] × (20 – 15)% = 17.2%
The sensitivity of the project to changes in the cost of capital is quite small. The
cost of capital is 10% but the cost of capital would have to be over 17.2% before
the NPV became negative.
This is a rise of 7.2% in absolute terms and 72% in relative terms. (Be careful
when you make statements like this about cost of capital).](https://image.slidesharecdn.com/strategicfinancialmanagement-230111084306-a2c2e0f5/75/Strategic-Financial-Management-pdf-169-2048.jpg)


![Strategic financial management
© Emile Woolf International 230 The Institute of Chartered Accountants of Nigeria
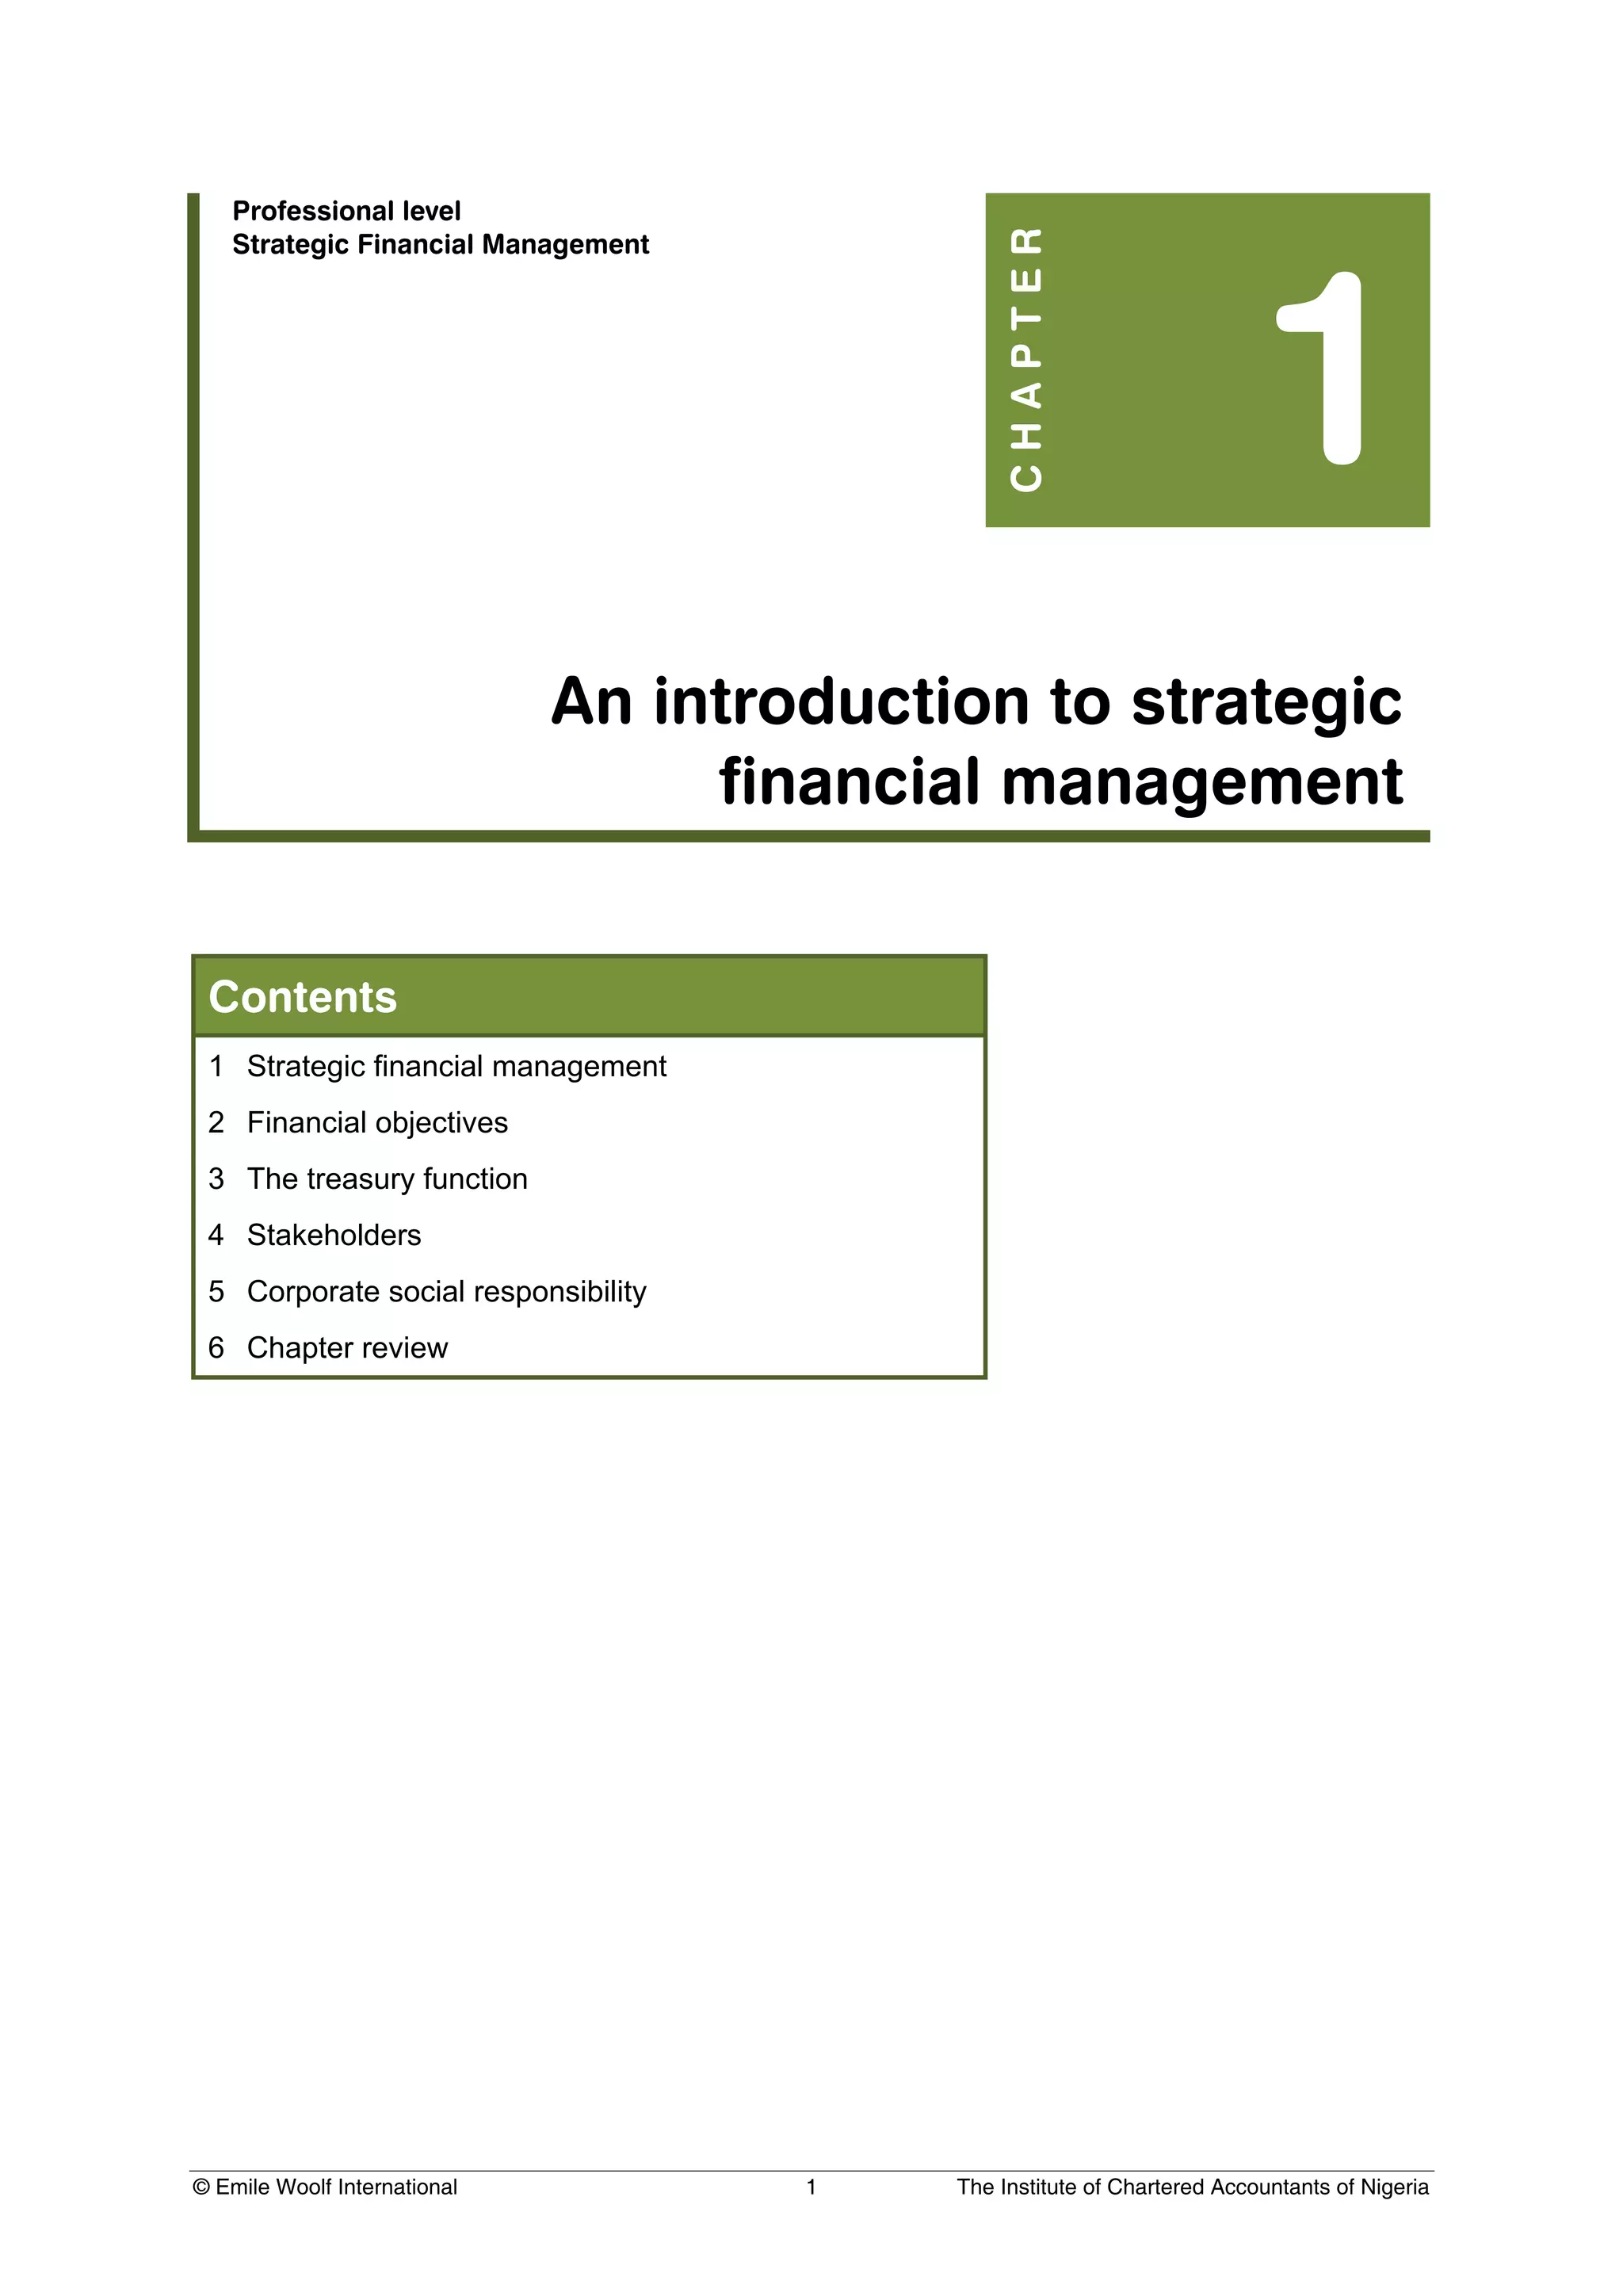
Example (continued): Overtrading
There has been a big increase in inventory, by 100%. The average turnover period
for inventory increased to 91 days in the current year [(600/2,400) 365] from
73 days in the previous year [(300/1,500) 365].
The average time to collect trade receivables has also increased substantially, by
₦320,000 or 97%. The average collection period was 59 days in the current year
[(650/4,000) 365] but only 40 days in the previous year [(330/3,000) 365].
There has been some increase in non-current assets, which has been largely
financed by current liabilities – probably bank overdraft.
There has been a very large increase of ₦250,000 or 125% in trade payables, as
well as a movement from a cash surplus of ₦20,000 to a bank overdraft of
₦500,000. The increase in trade payables is due not only to the growth in sales
volume and cost of sales, but also to an increase in the average payment period
to 68 days in the current year [(450/2,400) 365] from 49 days in the previous
year [(200/1,500) 365].
4.3 Consequences of overtrading and possible remedial action
The consequences of overtrading are eventual insolvency, unless remedial
measures are taken. Insolvency will occur if sales continue to grow and
overtrading continues because a company cannot finance its growth in business
indefinitely with growth in current liabilities.
In the previous example, the company’s bank will eventually refuse to allow any
more overdraft, and might even withdraw the existing overdraft facility if it
believes that the company cannot repay what it already owes. The company’s
suppliers will also eventually refuse to allow longer credit.
Overtrading therefore eventually leads to inadequate liquidity due to insufficient
long-term capital funding.
Remedial action
The action to restore the financial position when a company is overtrading is
either to increase capital or reduce the volume of business that the company is
conducting. The aim should be to achieve a better ratio of long-term capital to
sales, and a suitable level of working capital investment.
One way of increasing long-term capital is to increase profits. A company that is
overtrading should look for ways of improving both the gross profit and net profit
margins, by cutting costs or increasing sales prices. Higher profits will enable the
company to improve its operating cash flows and also to increase its equity
capital by retaining more profit.
However, a problem with trying to resolve a problem of overtrading by improving
profits is that the company might not have time to build up cash flows and profits
soon enough. The bank might withdraw its overdraft facility without notice,
making the company insolvent.](https://image.slidesharecdn.com/strategicfinancialmanagement-230111084306-a2c2e0f5/75/Strategic-Financial-Management-pdf-242-2048.jpg)


![Strategic financial management
© Emile Woolf International 322 The Institute of Chartered Accountants of Nigeria
3.4 Cost of convertible debt
The cost of a convertible bond is the higher of:
The cost of the bond as a straight bond that will be redeemed at maturity,
and
The IRR of the relevant cash flows assuming that the conversion of the
bonds into equity will take place in the future.
The cost of capital of the bond as a straight bond is only the actual cost of the
bond if the bonds are not converted into shares at the conversion date. The IRR
of the relevant cash flows is the cost of the convertible bond assuming that
conversion will take place.
The relevant cash flows for calculating this yield (IRR) are:
The current market value of the bonds (Year 0 outflow);
Annual interest on the bonds up to the time of conversion into equity
(annual inflows);
Tax relief on the interest (annual outflows);
The expected market value of the shares, at conversion date, into which
the bonds can be converted.
Example:
The current market value of a company’s 7% convertible debenture is ₦108.70.
Annual interest has just been paid.
The debenture will be convertible into equity shares in three years’ time, at a rate
of 40 shares per debenture.
The current ordinary share price is ₦3.20 and the rate of taxation on company
profits is 30%.
The post-tax cost of the bonds are calculated as follows.
Try 10% Try 9%
Yr.
Cash
flow
DCF
factor PV
DCF
factor PV
0 Market value (108.7) 1.000 (108.7) 1.000 (108.7)
1- 3 Interest less tax 4.9 2.487 12.19 2.531 12.40
3 Value of shares on
conversion (40 x
₦3.2) 128.0 0.751 96.13 0.772 98.82
NPV (0.38) + 2.52
Using interpolation, the after-tax cost of the debt is:
9% + [2.52/(2.52+ 0.38)] × (10 – 9)% = 9.9%.
The cost of the convertibles as a straight bond is obviously less than 9.9% (since
the market value is above par and the coupon is only 7%). The market therefore
expects the bonds to be converted into equity, and the after-tax cost is 9.9%.](https://image.slidesharecdn.com/strategicfinancialmanagement-230111084306-a2c2e0f5/75/Strategic-Financial-Management-pdf-334-2048.jpg)


![Strategic financial management
© Emile Woolf International 442 The Institute of Chartered Accountants of Nigeria
Answer
In the previous example, the Modigliani-Miller formulae were used to calculate a
cost of equity in a geared company, given the cost of equity in the company when
it is ungeared (all-equity). This example works the other way, from the cost of
equity in a geared company to a cost of equity in an ungeared company. The
same formulae can be used.
Using the known values for the geared company, we can calculate the cost of
equity in the ungeared company after the debt has been redeemed.
KEG = KEU + D/E [KEU - KD]
14.0 = KEU + 100/500 [KEU – 8.0]
1.2 KEU = 14.0 + 1.6
KEU = 13.0% (15.6/1.2).](https://image.slidesharecdn.com/strategicfinancialmanagement-230111084306-a2c2e0f5/75/Strategic-Financial-Management-pdf-454-2048.jpg)


![Chapter 21: Financing of projects
© Emile Woolf International 445 The Institute of Chartered Accountants of Nigeria
Example: M and M with tax
An all-equity company has a market value of ₦60 million and a cost of equity of
8%. It borrows ₦20 million of debt finance, costing 5%, and uses this to buy back
and cancel ₦20 million of equity. The rate of taxation on company profits is 25%.
According to Modigliani and Miller:
(a) Market value
The market value of the company after the increase in its gearing will be:
VG VU Dt
VG = ₦60 million + (₦20 million × 0.25) = ₦75 million.
The market value of the debt capital is ₦20 million; therefore the market
value of the equity in the geared company is ₦55 million (₦75 million –
₦20 million).
(b) WACC of the geared company
The WACC of the company after the increase in its gearing is calculated as
follows:
E
D
Dt
1
WACC
WACC U
G
7.38%
0.9231
8%
million
$65
25%
million
$20
1
8%
WACCG
(c) Cost of equity in the geared company
E
D
K
K
)
1
(
K
K D
EU
EU
EG
t
KEG = 8% + [(1 – 0.25) (8 – 5) 20/45] = 8% + 1% = 9%
Check: the WACC can now be calculated as follows:
Source of finance Market value Cost Market value x Cost
₦ million r MV x r
Equity 45.00 9.00 405
Debt (after-tax cost) 20.00 3.75 75
65.00 480
7.38%
65.00
480
WACC
](https://image.slidesharecdn.com/strategicfinancialmanagement-230111084306-a2c2e0f5/75/Strategic-Financial-Management-pdf-457-2048.jpg)


![Chapter 21: Financing of projects
© Emile Woolf International 449 The Institute of Chartered Accountants of Nigeria
Answer
(c) Cost of equity
(i) Step 1: Cost of equity of a similar all-equity company.
A similar approach is taken for calculating the cost of equity. We
start by calculating the cost of equity in a similar all-equity company,
using the MM formula for Proposition 2. We know the value of KEG
and we need to calculate a value for KEU.
In the original geared company, the value of equity is ₦80 million
and the value of debt capital is ₦20 million.
The cost of equity in a similar all-equity company is calculated as
follows:
E
D
K
K
)
1
(
K
K D
EU
EU
EG
t
10 = KEU + [(1 – 0.25) (KEU – 6) 20/80]
10 = KEU + 0.1875 KEU – 1.125
1.1875 KEU = 11.125
KEU = 9.3684.
(ii) Step 2: Cost of equity of the company at the new level of gearing.
Having calculated the cost of equity in a similar all-equity company,
we can now calculate the cost of equity in the company at its new
level of gearing. Debt capital is ₦40 million and equity is ₦65 million.
(The value of equity and debt capital at the new level of gearing were
calculated in (a).)
E
D
K
K
)
1
(
K
K D
EU
EU
EG
t
KEG = 9.3684 + (1 – 0.25) (9.3684 – 6) 40/65
KEG = 9.3684 + 1.5546 = 10.923, say 10.9%.](https://image.slidesharecdn.com/strategicfinancialmanagement-230111084306-a2c2e0f5/75/Strategic-Financial-Management-pdf-461-2048.jpg)


![Strategic financial management
© Emile Woolf International 452 The Institute of Chartered Accountants of Nigeria
Answer
We can calculate a weighted average pre-tax cost of the debt capital, as follows:
Market
value
AA - A +
₦bn Cost Cost × MV Cost Cost × MV
4 year 2 4.40 8.80 4.45 8.90
10 year 3 4.85 14.55 4.95 14.85
5 23.35 23.75
Weighted average before-tax cost of debt if credit rating is AA - = 23.35/5 =
4.67%.
Weighted average before-tax cost of debt if credit rating is A + = 23.75/5 =
4.75%.
Expected weighted average before tax cost of debt = (0.75 × 4.67) + (0.25 ×
4.75)% = 4.69%.
Expected weighted average after-tax cost of debt = 4.69% (1 – 0.30) = 3.283%.
Calculate the cost of equity in the company after the new bond issue
Step 1. Calculate the cost of equity in an ungeared company at the current level
of gearing. We know that the current cost of equity at the current level of gearing
is 7.198%.
E
D
K
K
)
1
(
K
K D
EU
EU
EG
t
7.198 = KEU + [(1 – 0.30) (KEU – 4.30) 2/10]
7.198 = KEU + 0.14 KEU – 0.602
1.14 KEU = 7.8
KEU = 6.842.
Step 2. Calculate the cost of equity in the company at the new level of gearing,
making the assumption about market value discussed above, but assuming no
change in the cost of debt. (Changing the cost of debt in this calculation would
produce an incorrect valuation for the cost of equity.)
E
D
K
K
)
1
(
K
K D
EU
EU
EG
t
KEG = 6.842 + 0.890 = 7.732.
Calculate the WACC at the new level of gearing
Source of finance
Market
value Cost
Market value
× Cost
₦ billion % MV × r
Equity 10.0 7.732 77.320
Debt (weighted average) 5.0 3.283 16.415
15.0 93.735
WACC = 93.735/15 = 6.249, say 6.25%.
A discount rate of 6.25% should be used to calculate the NPV of the proposed
new capital investment.](https://image.slidesharecdn.com/strategicfinancialmanagement-230111084306-a2c2e0f5/75/Strategic-Financial-Management-pdf-464-2048.jpg)


![Chapter 21: Financing of projects
© Emile Woolf International 461 The Institute of Chartered Accountants of Nigeria
Answer
The equity beta of the company at its current level of gearing is 0.925.
The asset beta of the company (the equity beta of a similar ungeared company)
will be:
t
1
D
E
E
EG
A
βA = 0.925 × 60/[60 + 20 (1 – 0.30)]
βA = 0.925 × 60/74
βA = 0.75
We can calculate the total value of the company if it is ungeared, using the data
for the company at its current gearing level.
Total value of an all-equity company:
VG = VU + Dt
₦80 million = VU + (₦20 million × 0.30)
VU = ₦74 million.
At the new level of gearing, the market value of the debt capital will be ₦10
million (₦20 million minus ₦10 million redeemed). We can calculate the total
value of the company at the new gearing level, using the value of the company if
it is ungeared.
VG = VU + Dt
VG = ₦74 million + (₦10 million × 0.30)
VG = ₦77 million.
Of this total value, ₦10 million is debt capital; therefore the value of the equity is
₦67 million.
We now have the information to calculate a beta factor for the equity at the new
level of gearing. The asset beta was calculated earlier, and is 0.75.
t
1
D
E
E
EG
A
0.30)
-
(1
10
+
67
67
=
0.75 EG
0.9054 βEG = 0.75
βEU = 0.828, say 0.83.
Using the CAPM, we can calculate the cost of equity at the new gearing level as:
7% + 0.83 (13.67 – 7.0) = 12.5361, say 12.5%.](https://image.slidesharecdn.com/strategicfinancialmanagement-230111084306-a2c2e0f5/75/Strategic-Financial-Management-pdf-473-2048.jpg)


![Chapter 21: Financing of projects
© Emile Woolf International 473 The Institute of Chartered Accountants of Nigeria
SOLUTIONS TO PRACTICE QUESTIONS
Solution 1
Using the asset beta formula and assuming a risk-free cost of debt.
(meaning that βD = 0):
0.30
1
80
160
160
05
.
1
A
βA = 1.05 × 0.74074 = 0.778
Solution 2
The appropriate discount rate should be one that applies to the industry in which the
investment will be made. We know that the geared beta in this industry is 1.25, with a
debt: equity ratio of 0.40. We can calculate the asset beta (ungeared equity beta) for
the industry as:
0.85
88
60
1.25
0.30
1
40
60
60
1.25
=
A
Since the company will be all-equity financed, the cost of equity to apply to the project
is therefore:
4% + 0.85 (7 – 4)% = 6.55%.
Note: If the company has proposed to finance the project with some debt, the asset
beta could be used to calculate a new geared beta for the appropriate level of gearing,
and a new cost of equity and new WACC could be calculated.
Solution 3
The asset beta of 1.35 allows for business risk only and assumes that the project will
be all-equity financed. The asset beta can be converted into a ‘geared beta’ for the
equity capital as follows:
0.30)
-
(1
1
+
2
2
=
1.35 EG
βEG = (1.35 2.70)/2 = 1.8225.
The beta factor for the equity finance can be used to obtain a cost of capital for the
equity, using the CAPM.
r = 3% + 1.8225 (8 – 3)% = 12.1125%, say 12%.
Since the debt capital is risk-free, its pre-tax cost is 3%. The cost of capital for the
project, financed two-thirds by equity and one-third by debt, is:
[2/3 12%] + [1/3 3% (1 – 0.30)] = 8.7%.](https://image.slidesharecdn.com/strategicfinancialmanagement-230111084306-a2c2e0f5/75/Strategic-Financial-Management-pdf-485-2048.jpg)
![Strategic financial management
© Emile Woolf International 474 The Institute of Chartered Accountants of Nigeria
Solutions 4
Asset betas can be calculated for each proxy company as follows:
Company 1
0.81
91
70
1.05
0.30
1
30
70
70
1.05
=
A
Company 2
0.73
85
50
1.24
0.30
1
50
50
50
1.24
=
A
Company 3
0.78
88
60
1.15
0.30
1
40
60
60
1.15
=
A
The average of these asset betas is (0.81 + 0.73 + 0.78)/3 = 0.77.
The asset beta for the capital project is 0.77. This should now be re-geared to obtain an
equity beta for the project.
0.30
1
20
80
80
=
77
.
0 EG
βEG = 0.77 [80 + 20(1 – 0.30)]/80
βEG = 0.77 94/80 = 0.90.
The project-specific cost of equity is now calculated using the CAPM:
KE = 5% + 0.90 (8 – 5)% = 7.7%
(a) If the project-specific discount rate is taken to be the project-specific cost of
equity, the discount rate for the project should be 7.7%.
(b) If the project-specific discount rate is taken to be a weighted average cost of
capital, this is calculated as follows:
Source of finance
Market
value
After-tax
cost
r MV × r
Equity 80% 0.077 0.0616
Debt capital: cost = (5% (1 – 0.30) 20% 0.035 0.0070
0.0686
The project-specific cost of capital would now be 6.86%, say 6.9%.](https://image.slidesharecdn.com/strategicfinancialmanagement-230111084306-a2c2e0f5/75/Strategic-Financial-Management-pdf-486-2048.jpg)
![Chapter 21: Financing of projects
© Emile Woolf International 475 The Institute of Chartered Accountants of Nigeria
Solutions 5
Workings: Capital allowances and tax relief
Year Written down
value
Capital allowance Tax relief
25% 30%
₦000 ₦000 ₦000
8,000
1 (2,000) 2,000 600
6,000
2 (1,500) 1,500 450
4,500
3 (1,125) 1,125 338
3,375
4 (844) 844 253
There is no balancing charge, because it is assumed that the disposal value at the end
of year 4, net of tax, includes the estimated tax effect of the disposal of the business.
Net present value
Cost of equity KE = 5% + 1.25 (9 – 5)% = 10%.
WACC = [80% × 10%] + [20% × 7% × (1 – 0.30)] = 8.98%, say 9%.
Year 0 1 2 3 4
₦000 ₦000 ₦000 ₦000 ₦000
Investment (9,000)
Sale value 3,600
Operating cash flow 1,800 2,100 2,400 2,700
Tax (30%) (540) (630) (720) (810)
Tax relief (workings) 600 450 338 253
Net cash flow (9,000) 1,860 1,920 2,018 5,743
Discount factor 9% 1.000 0.917 0.842 0.772 0.708
Present value (9,000) 1,706 1,617 1,558 4,066
NPV – ₦53](https://image.slidesharecdn.com/strategicfinancialmanagement-230111084306-a2c2e0f5/75/Strategic-Financial-Management-pdf-487-2048.jpg)
![Strategic financial management
© Emile Woolf International 476 The Institute of Chartered Accountants of Nigeria
Solutions 5
Adjusted present value
The project will be financed 50% with equity and 50% with debt capital.
Asset beta = 1.25 × 4,500/[4,500 + (4,500 × 0.70)] = 0.7353.
Cost of ungeared equity KEU = 5% + 0.7353(9 – 5)% = 7.94%, say 8%.
The cash flows for discounting are the same as for the NPV method, with the exception
that issue costs should be removed. These are ₦300,000 in Year 0.
Year 0 1 2 3 4
₦000 ₦000 ₦000 ₦000 ₦000
Net cash flow (8,700) 1,860 1,920 2,018 5,743
Discount factor 8% 1.000 0.926 0.857 0.794 0.735
Present value (8,700) 1,722 1,645 1,602 4,221
Base case NPV ₦490
Other costs
There is no tax relief on the issue costs, so the PV of issue costs (all in Year 0) is
₦300,000.
PV of the tax shield
It is assumed that interest costs each year will be ₦4,500,000 × 7% = ₦315,000.
Tax relief on these interest costs at 30% will be ₦94,500 per year for 4 years.
This tax relief should be discounted at 7%.
PV of tax relief on interest = ₦94,500 × 3.387 = ₦320,000.
Summary
₦000
Base case NPV 490
- PV of other costs (300)
+ PV of tax relief on interest 320
= APV + 510
The APV is + ₦510,000, indicating that the project should be undertaken, whereas the
NPV is negative, indicating that it should not be undertaken.
In this particular example, the APV and NPV methods give conflicting
recommendations.](https://image.slidesharecdn.com/strategicfinancialmanagement-230111084306-a2c2e0f5/75/Strategic-Financial-Management-pdf-488-2048.jpg)


![Chapter 23: Value based management and modern business valuation techniques
© Emile Woolf International 509 The Institute of Chartered Accountants of Nigeria
1 VALUE BASED MANAGEMENT
Section overview
Value-based management (VBM)
Shareholder value analysis
1.1 Value-based management (VBM)
VBM is a management approach based on the concept that the ultimate measure
of a company's success is the extent to which it increases the wealth of
shareholders.
Value is created when companies invest capital at returns that exceed the cost of
that capital.
VBM adopts approaches that focus on how value creation is linked to
management actions. The aim is to guide decision making at all levels in an
organisation in a way that leads to value creation.
Value drivers
A value driver is any variable that affects the value of the company. They should
be ranked in terms of their impact on value and responsibility assigned to
individuals who can help the organisation meet its targets. Value drivers can be
difficult to identify as it requires an organisation to think about its processes in a
different way and existing reporting systems are often not equipped to supply the
necessary information. It has been suggested that a good way of relating a
range of value drivers is to use scenario analysis. It is a way of assessing the
impact of different sets of mutually consistent assumptions on the value of a
company or its business units.
No single manager can directly influence shareholder value. However, managers
do have influence over aspects of the business that drive value.
Value drivers are variables that affect the value of the company or business unit.
A widely used model comprises 7 drivers of shareholder value,[19] giving some
guidance to managers:
Revenue;
Operating margin;
Cash tax rate;
Incremental capital expenditure;
Investment in working capital;
Cost of capital;
Competitive advantage period.
Performance measures can be established directed at guiding management
behaviour towards value enhancement, for example by controlling costs to
improve margin.
The main advantage of SVA is that it encourages focus on value creating
activities rather than on short term profit-related activities which may not create
value](https://image.slidesharecdn.com/strategicfinancialmanagement-230111084306-a2c2e0f5/75/Strategic-Financial-Management-pdf-521-2048.jpg)