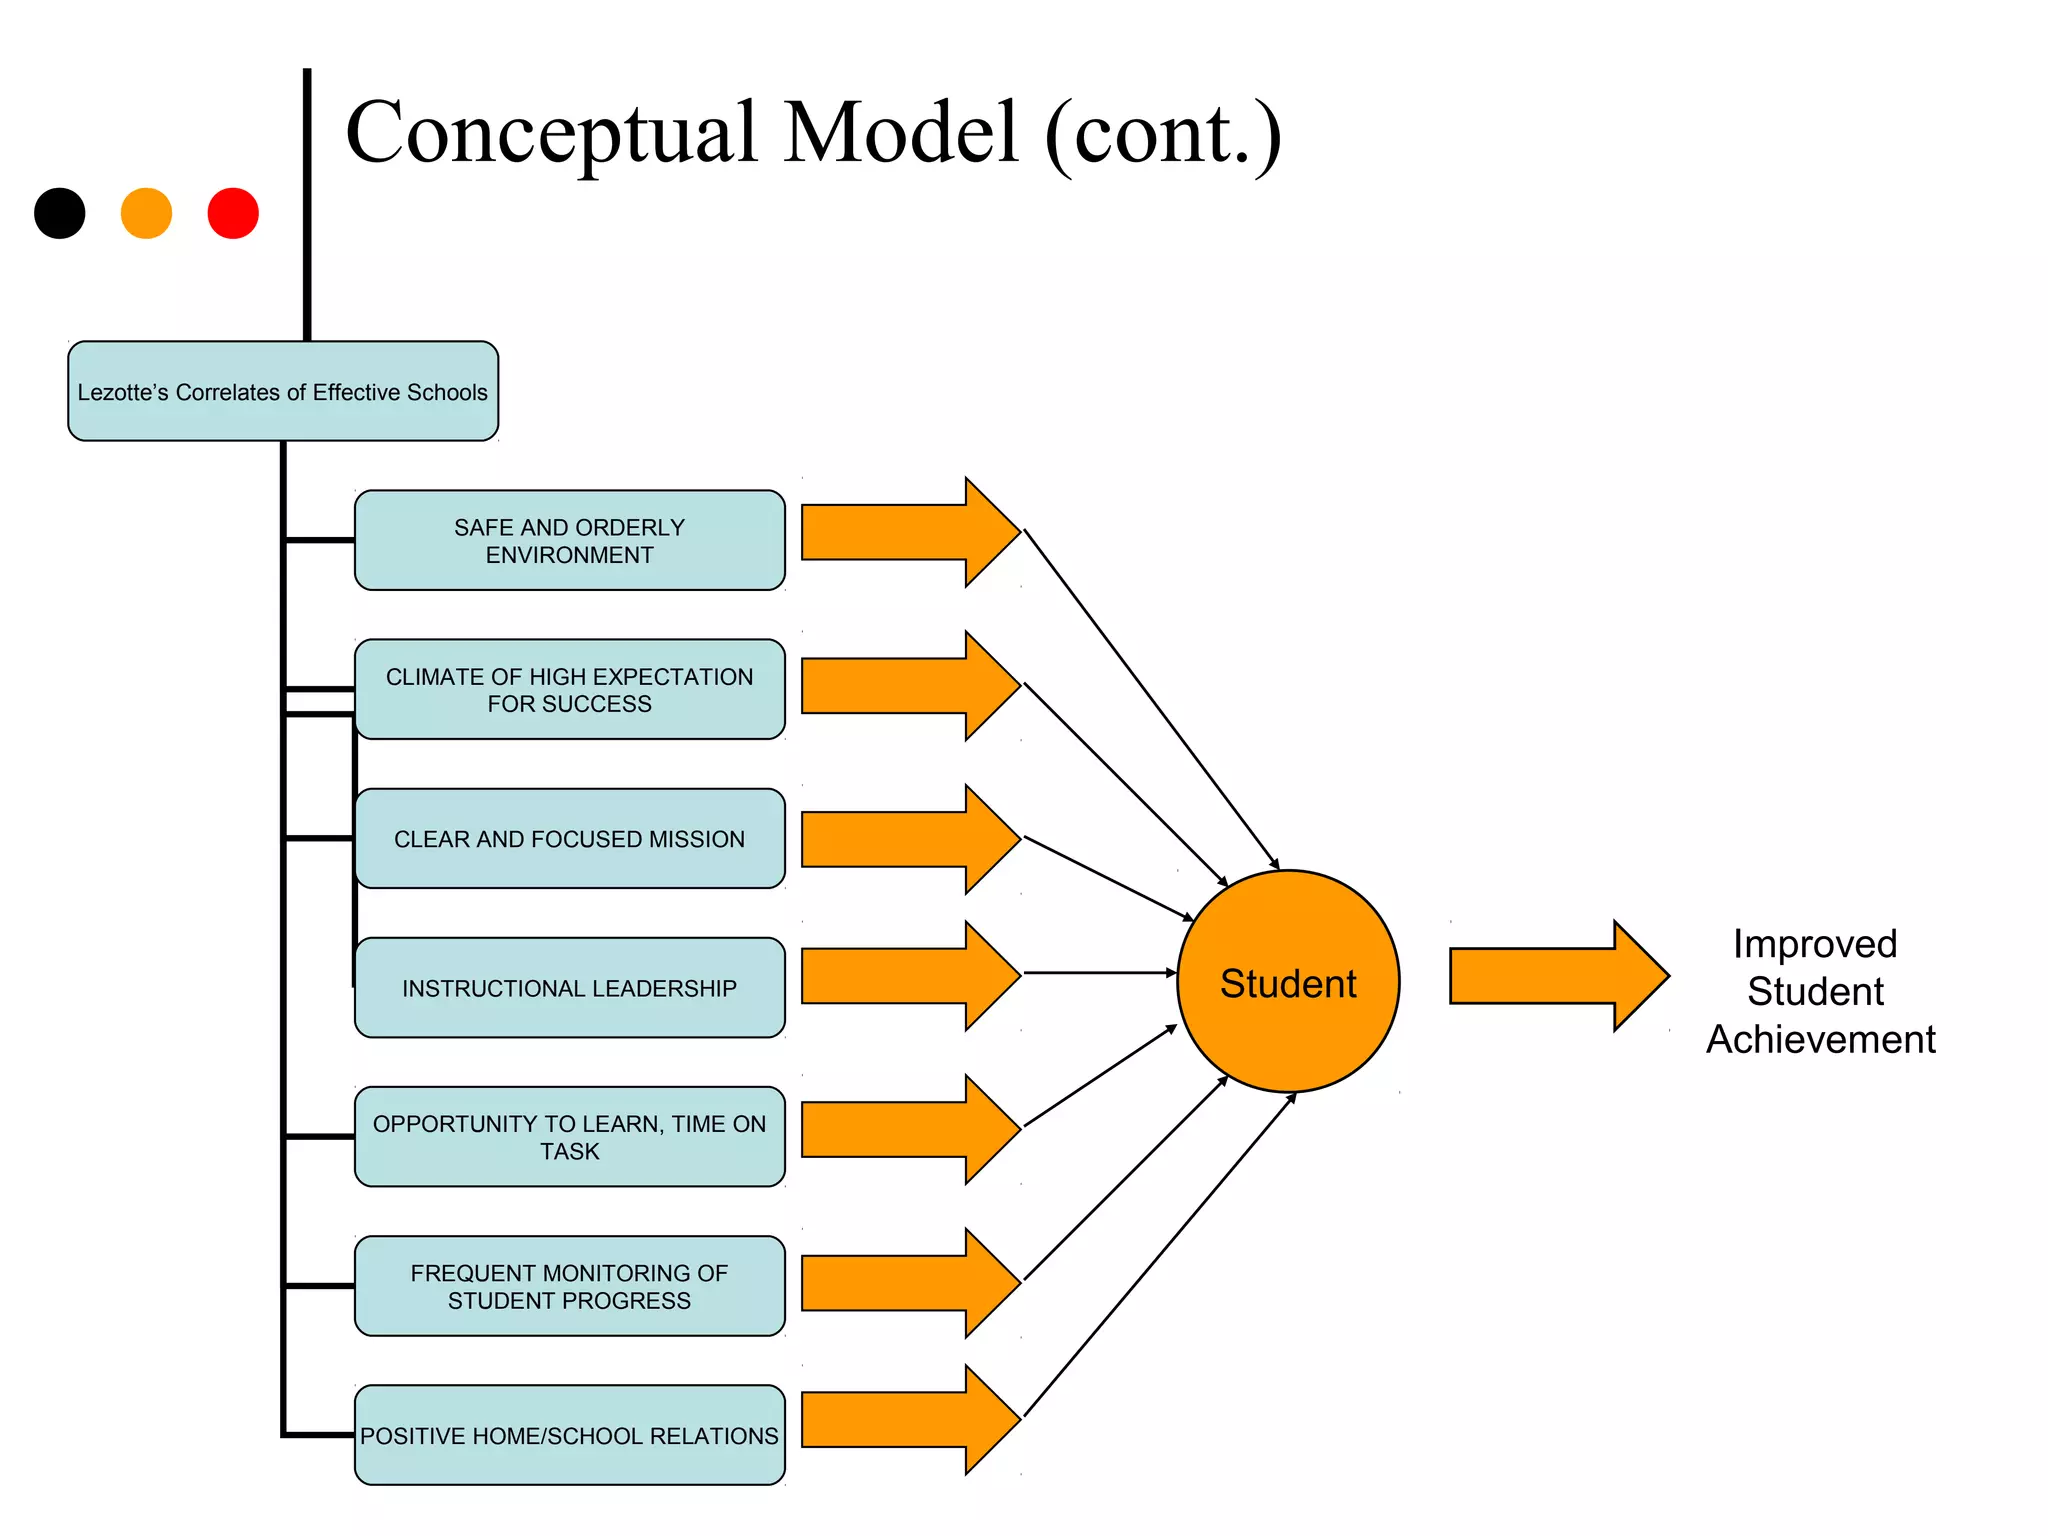
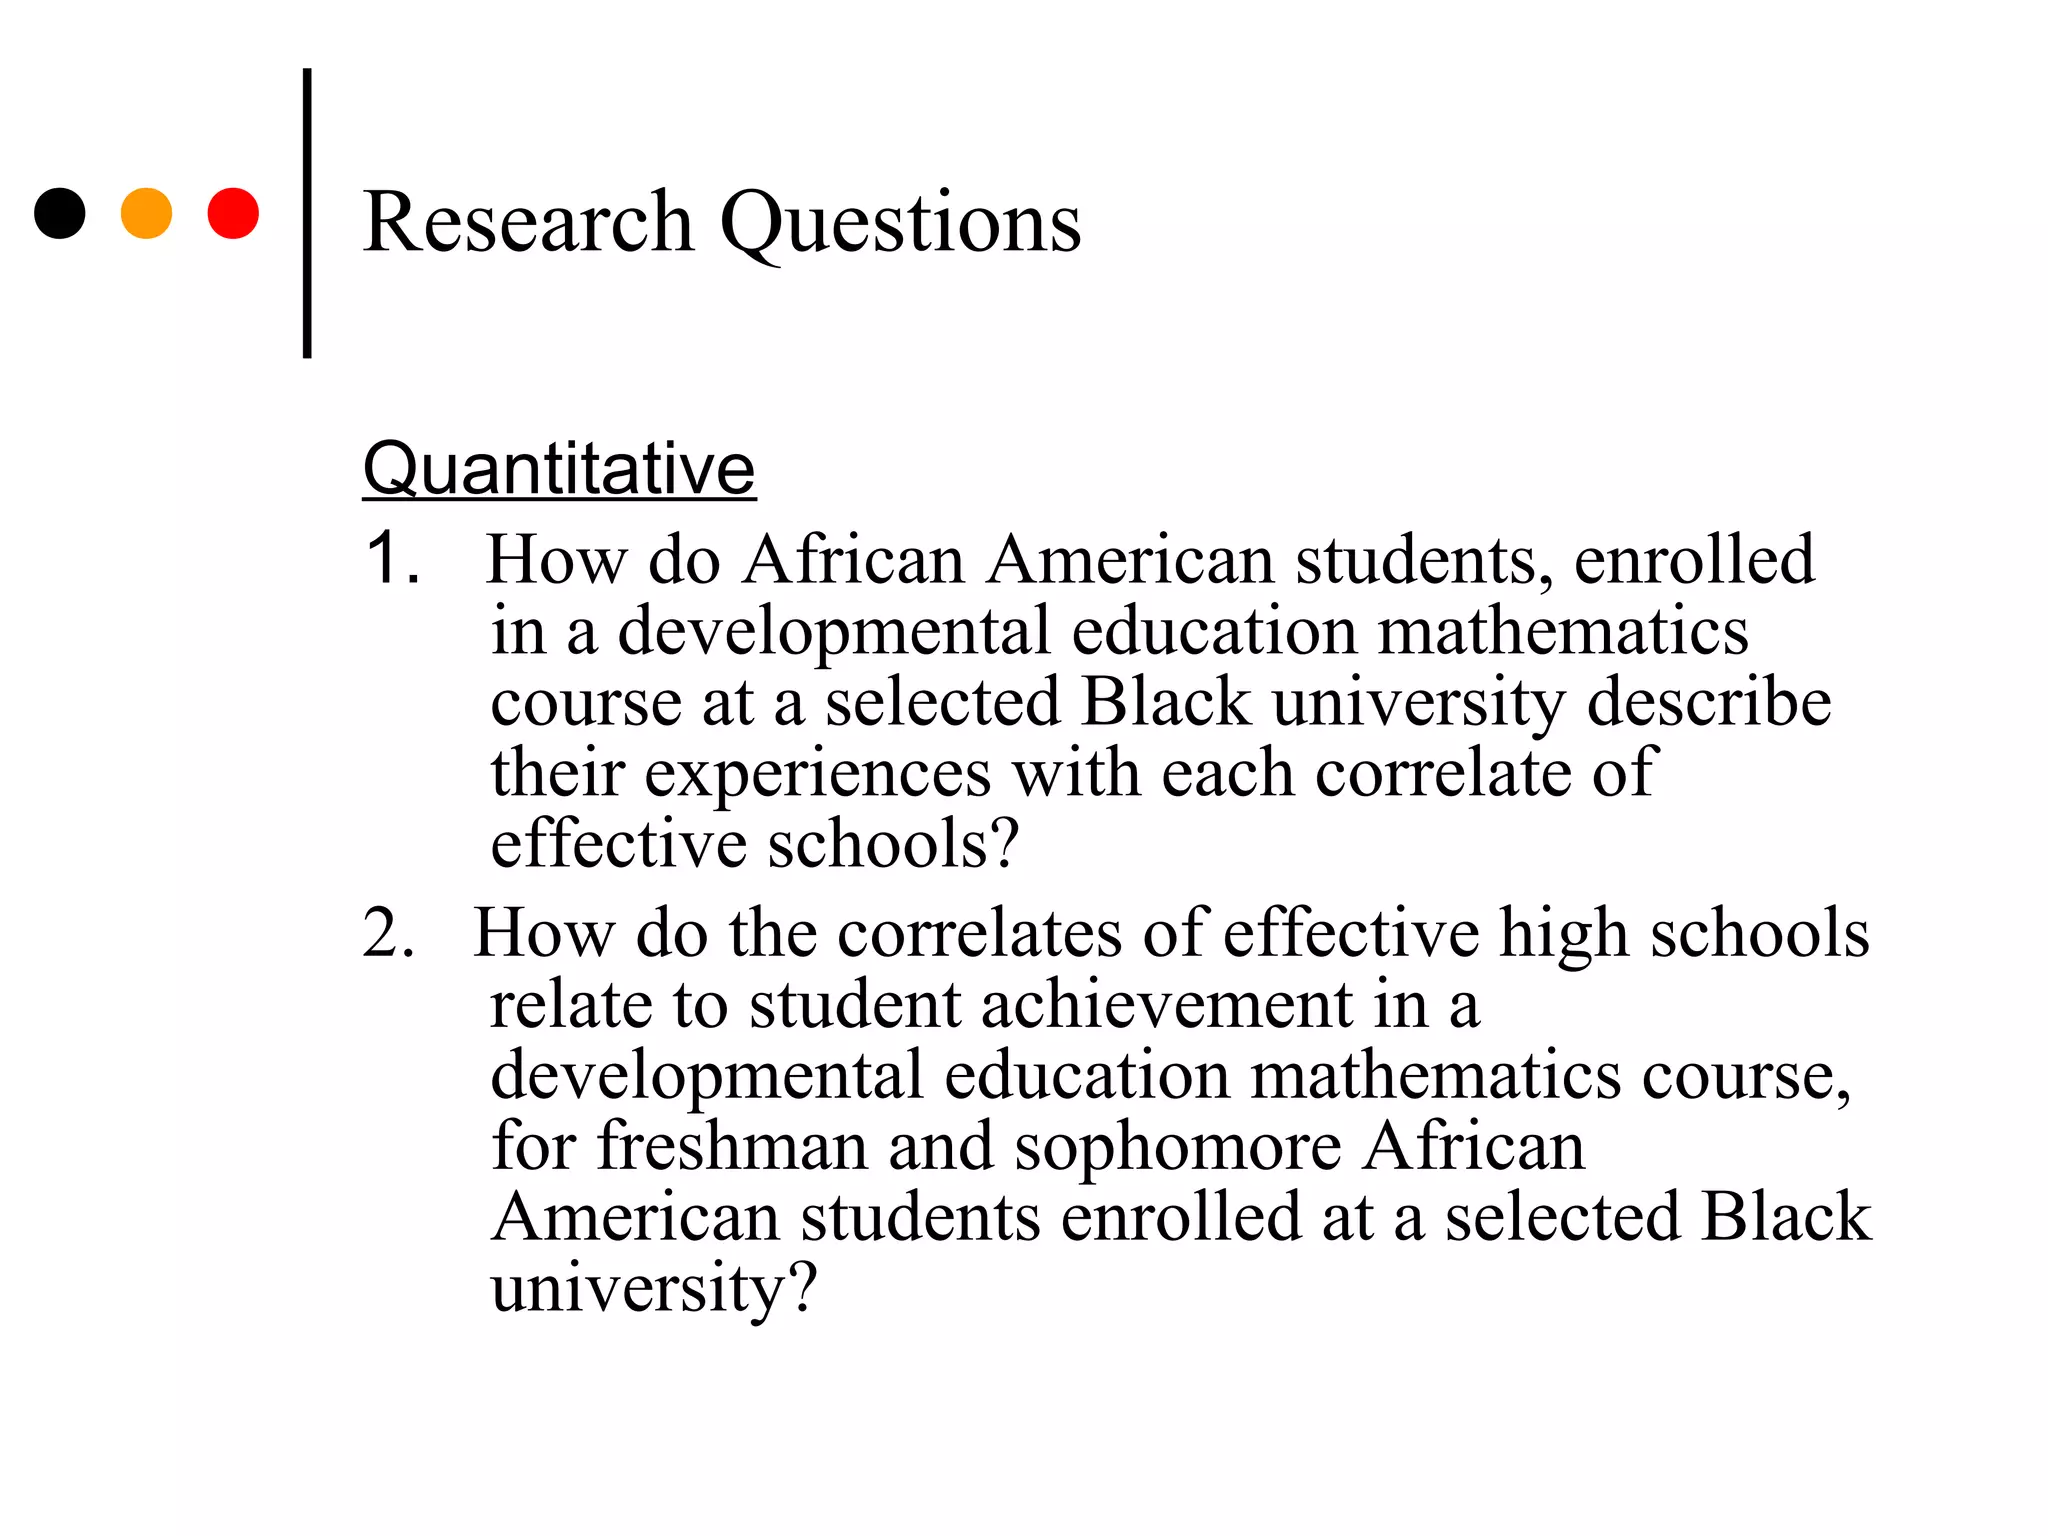
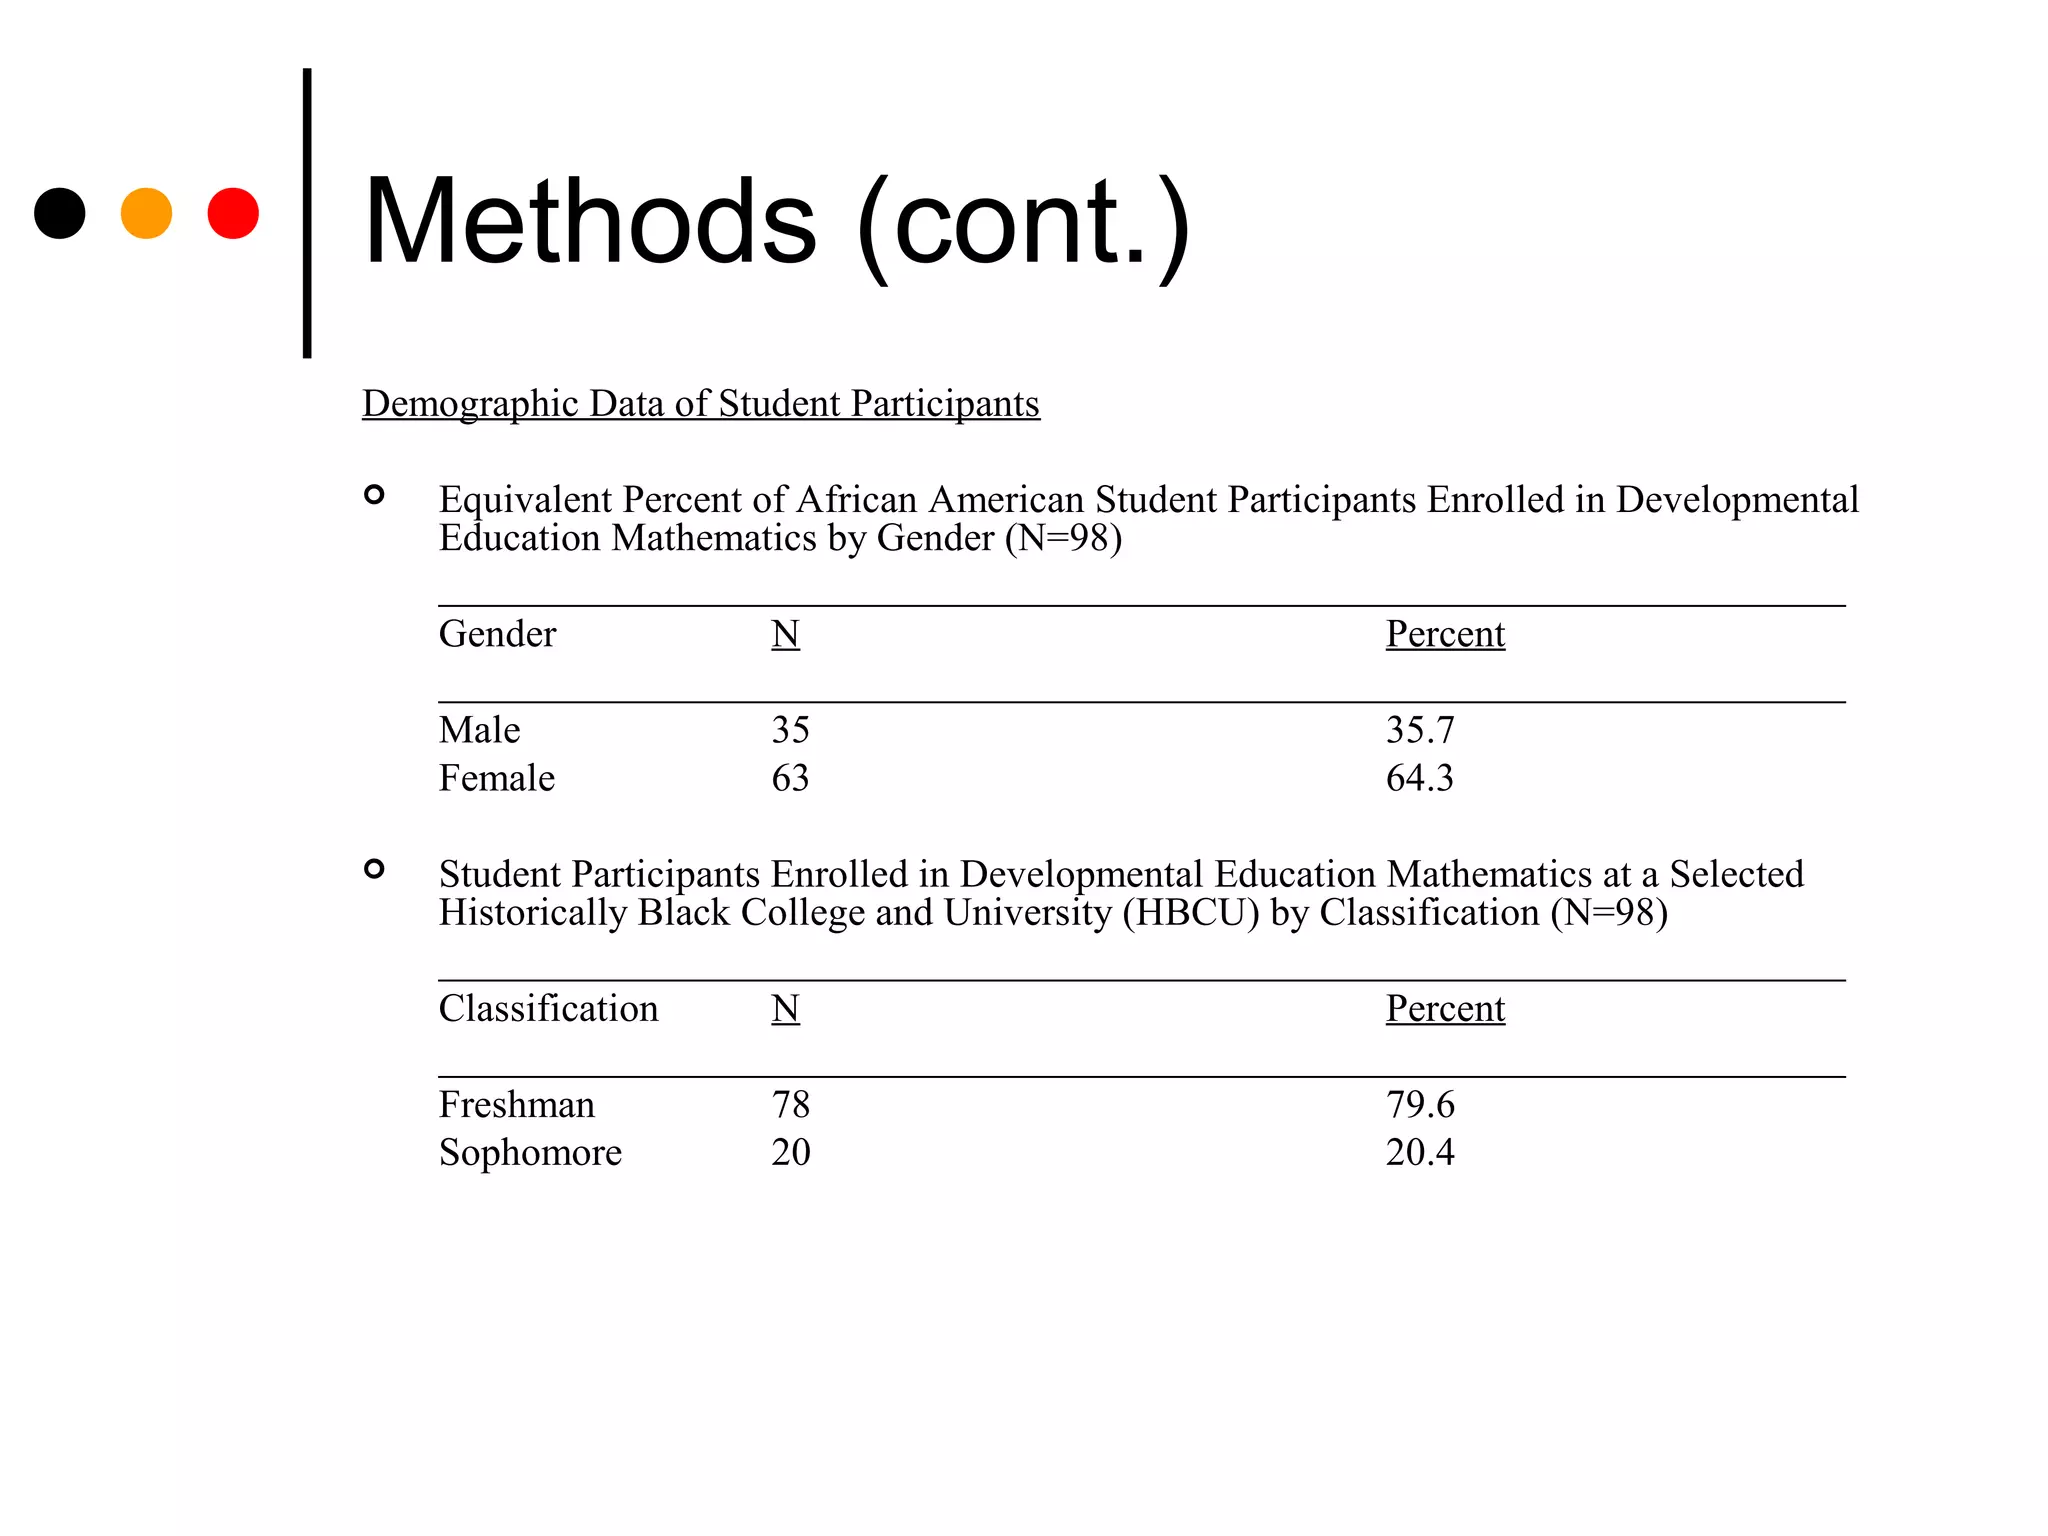
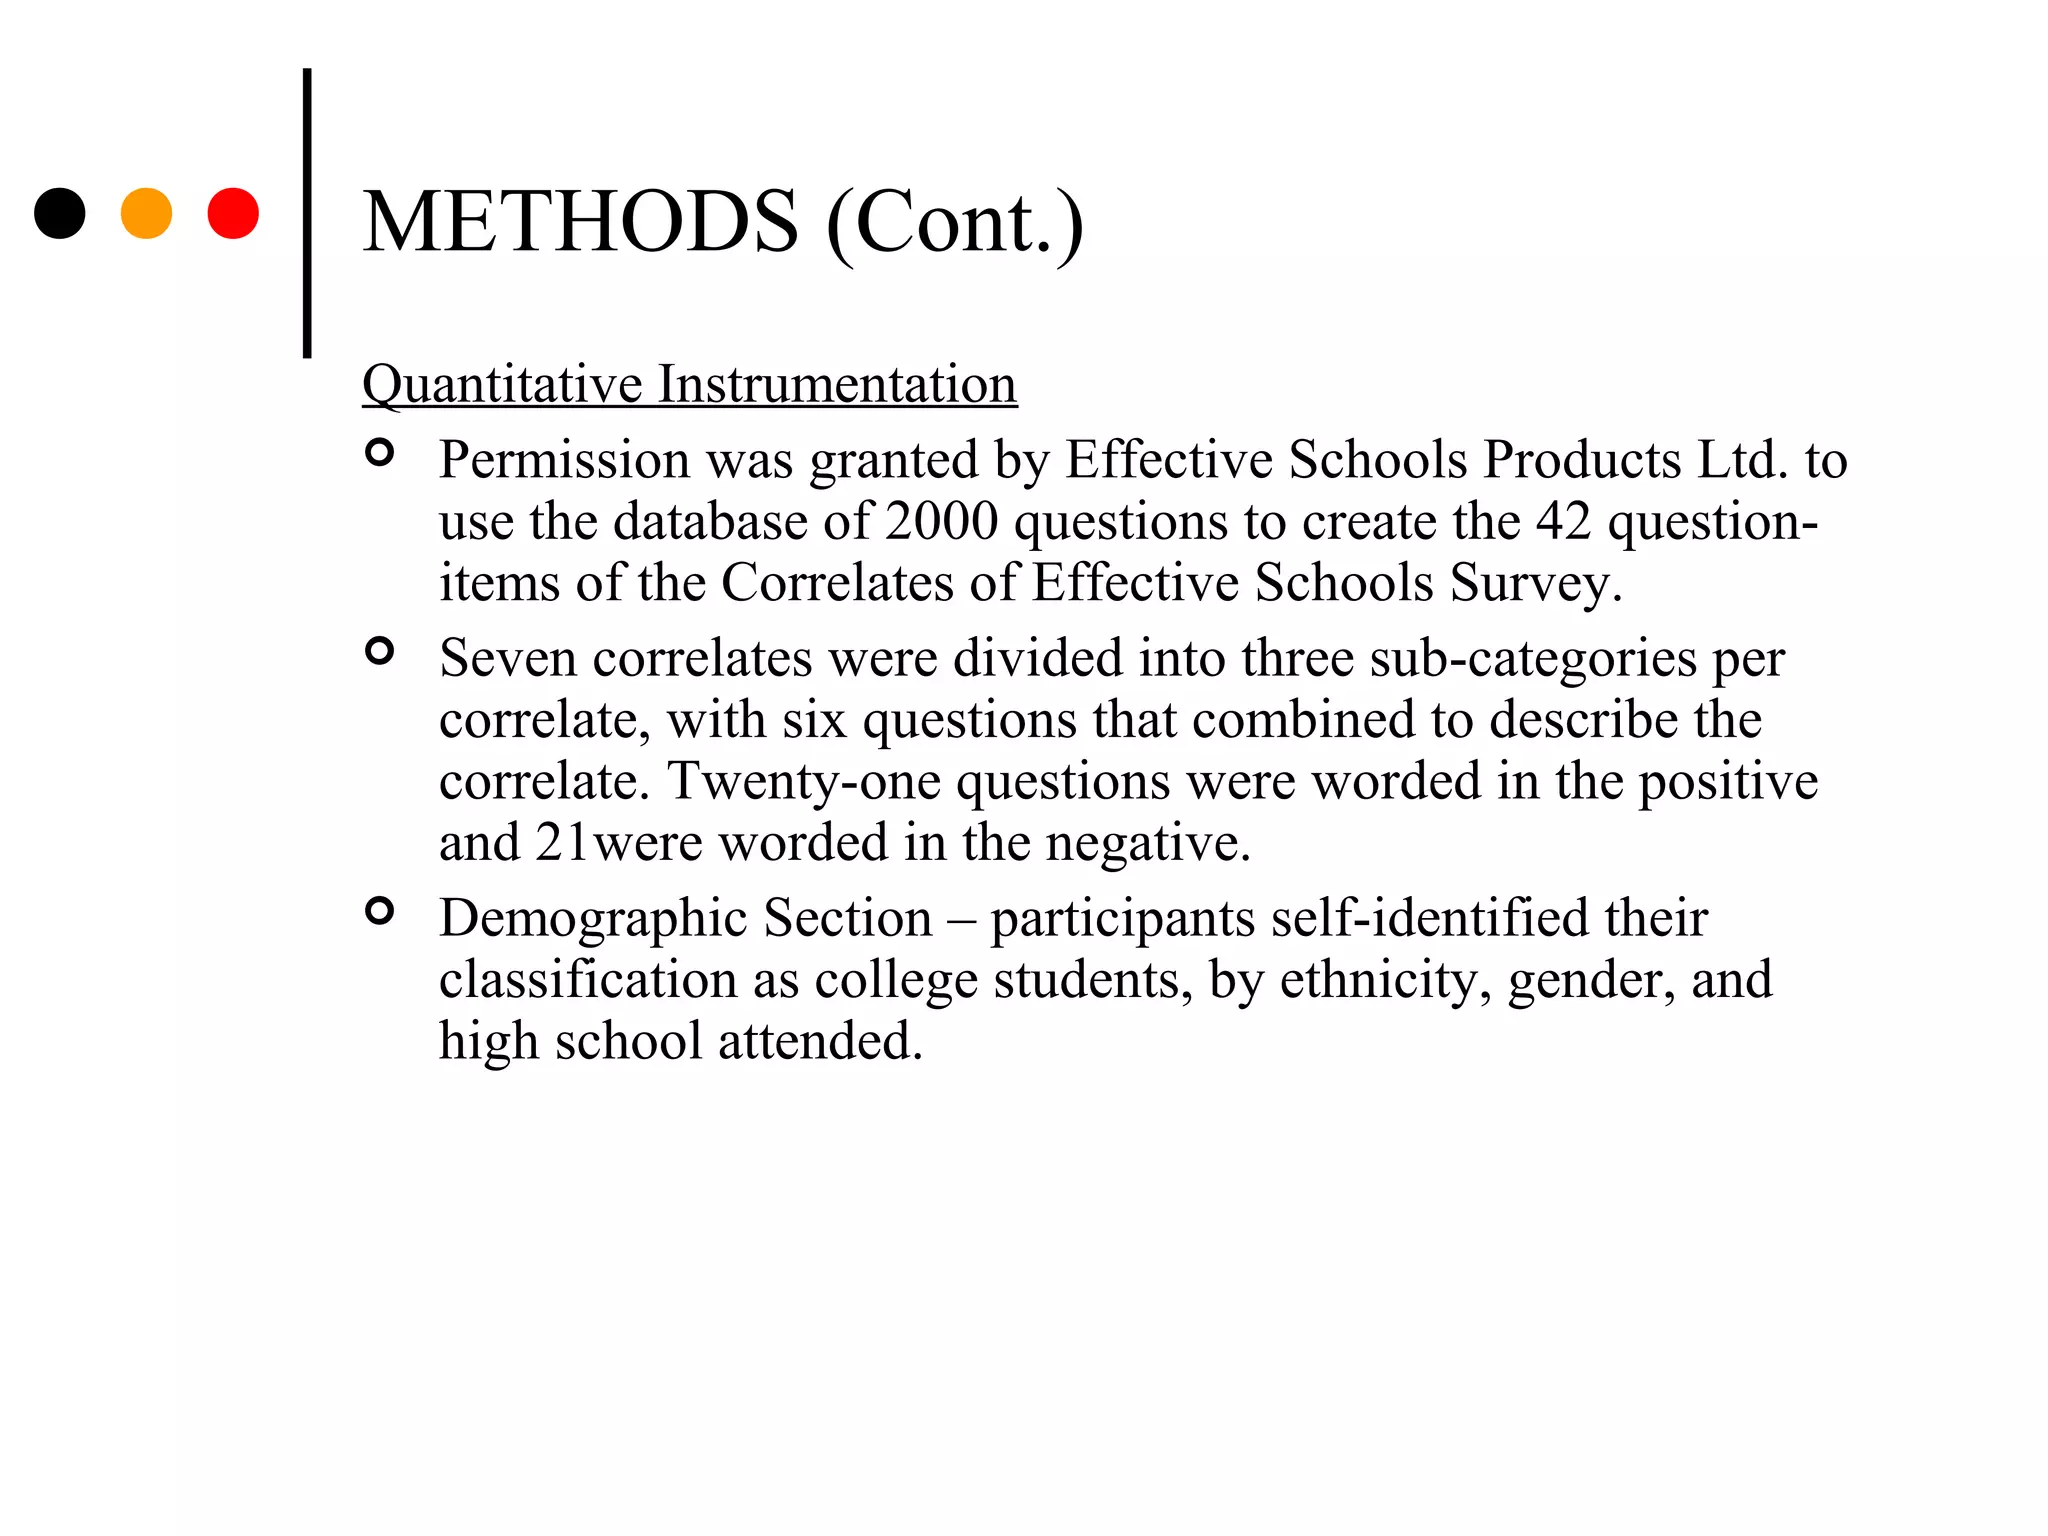
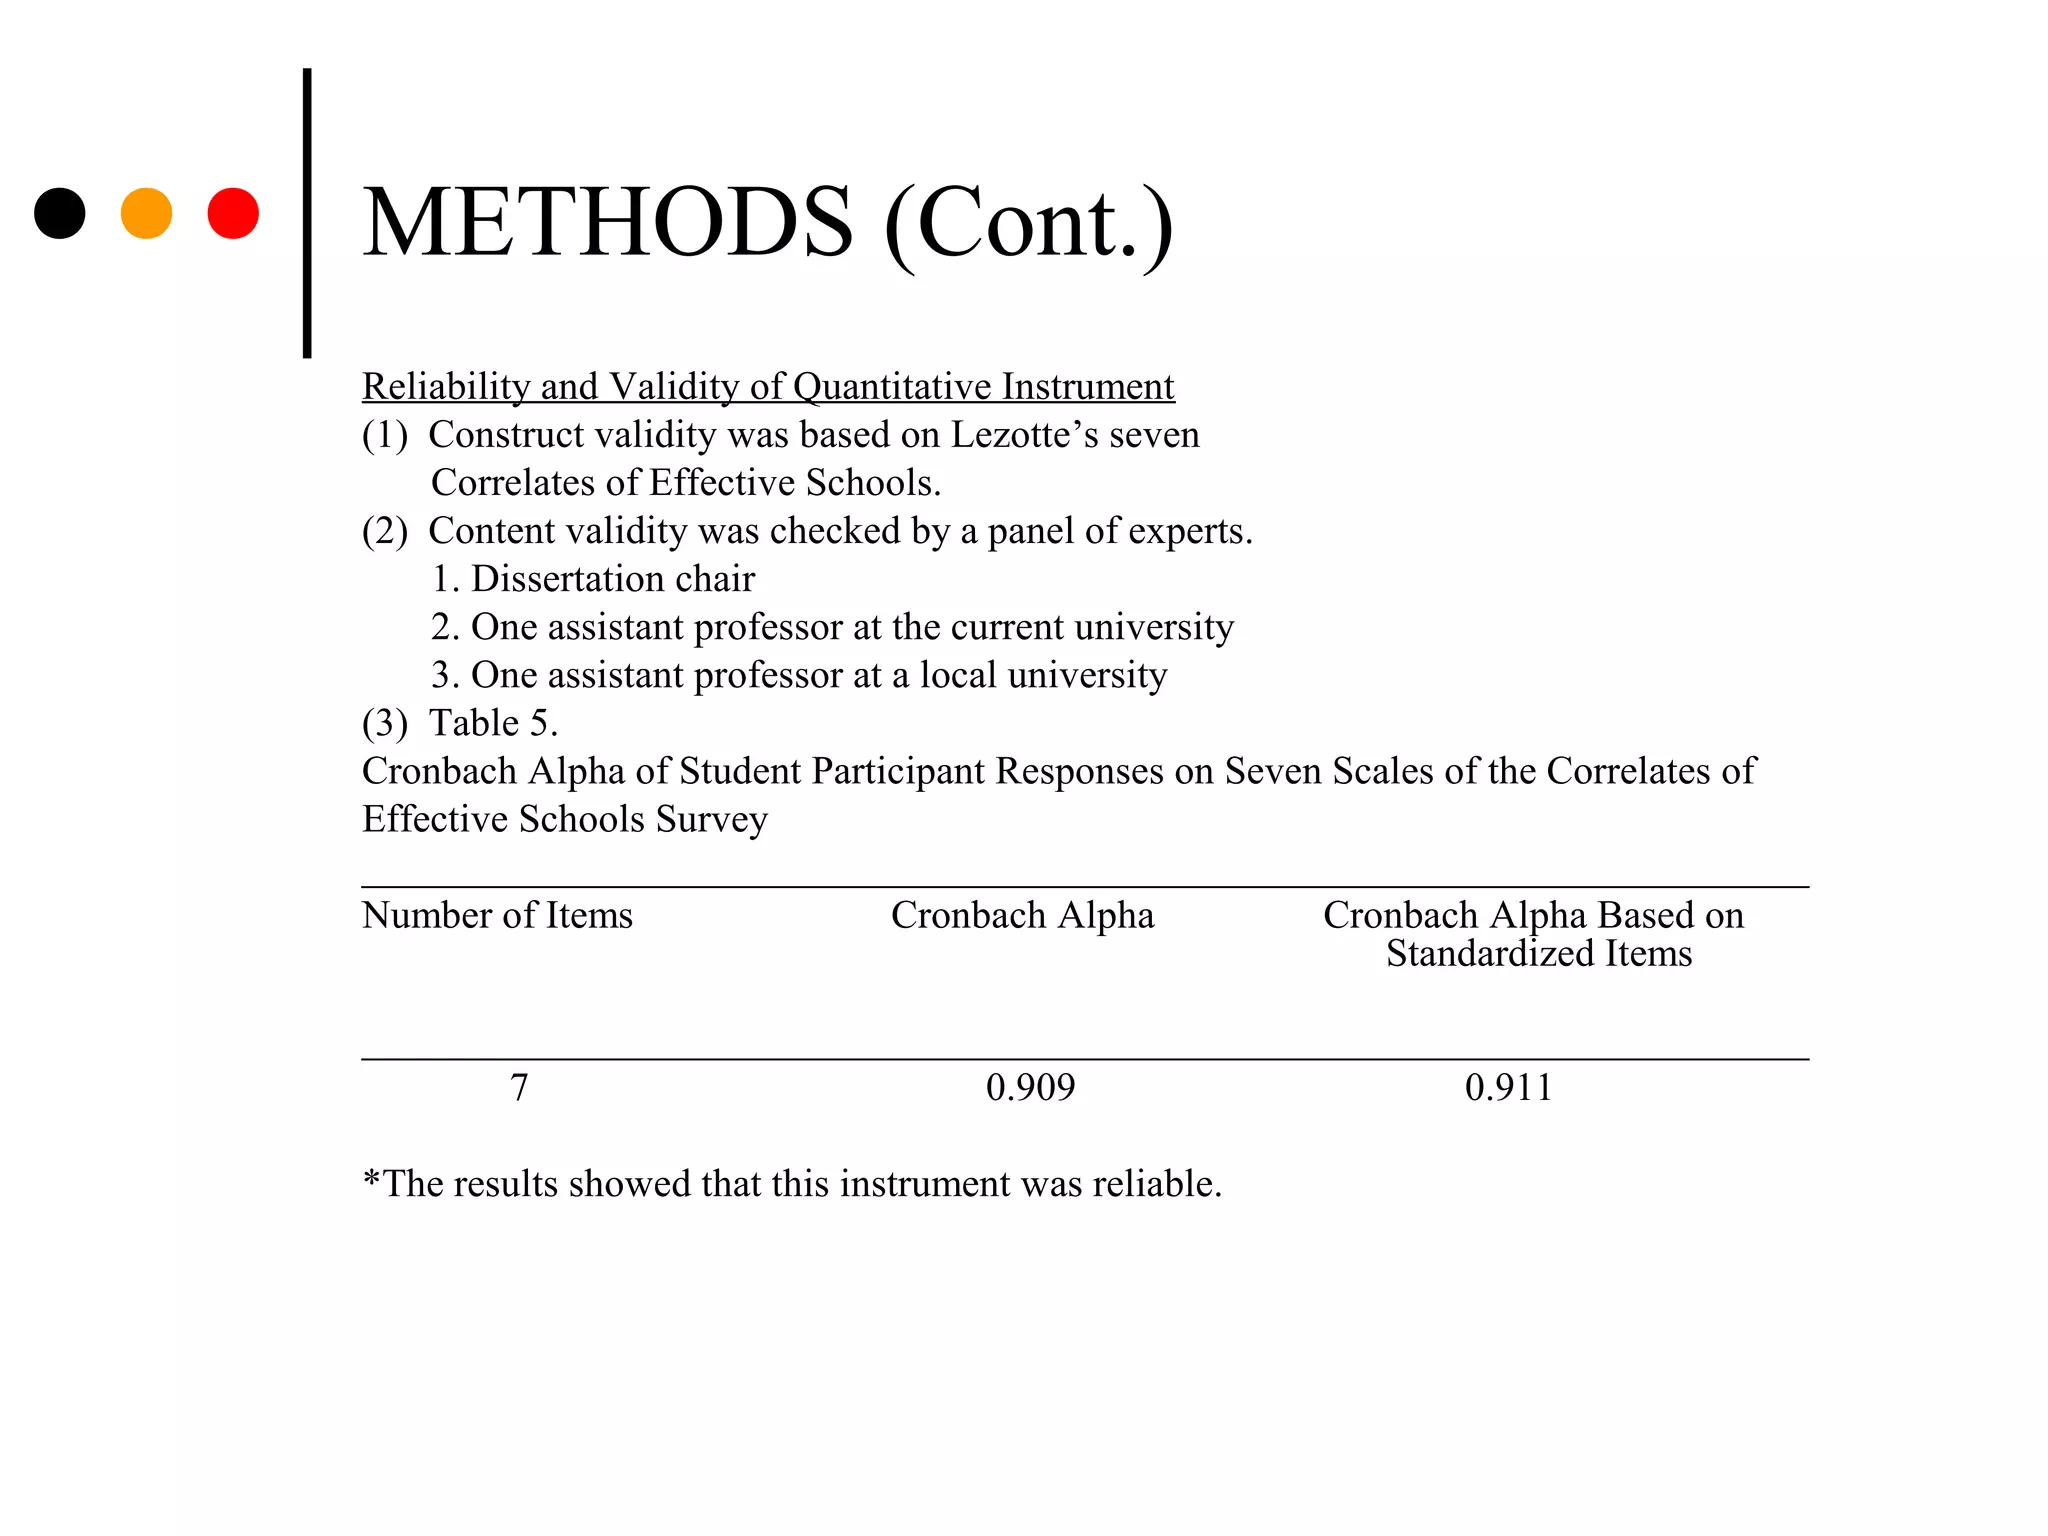
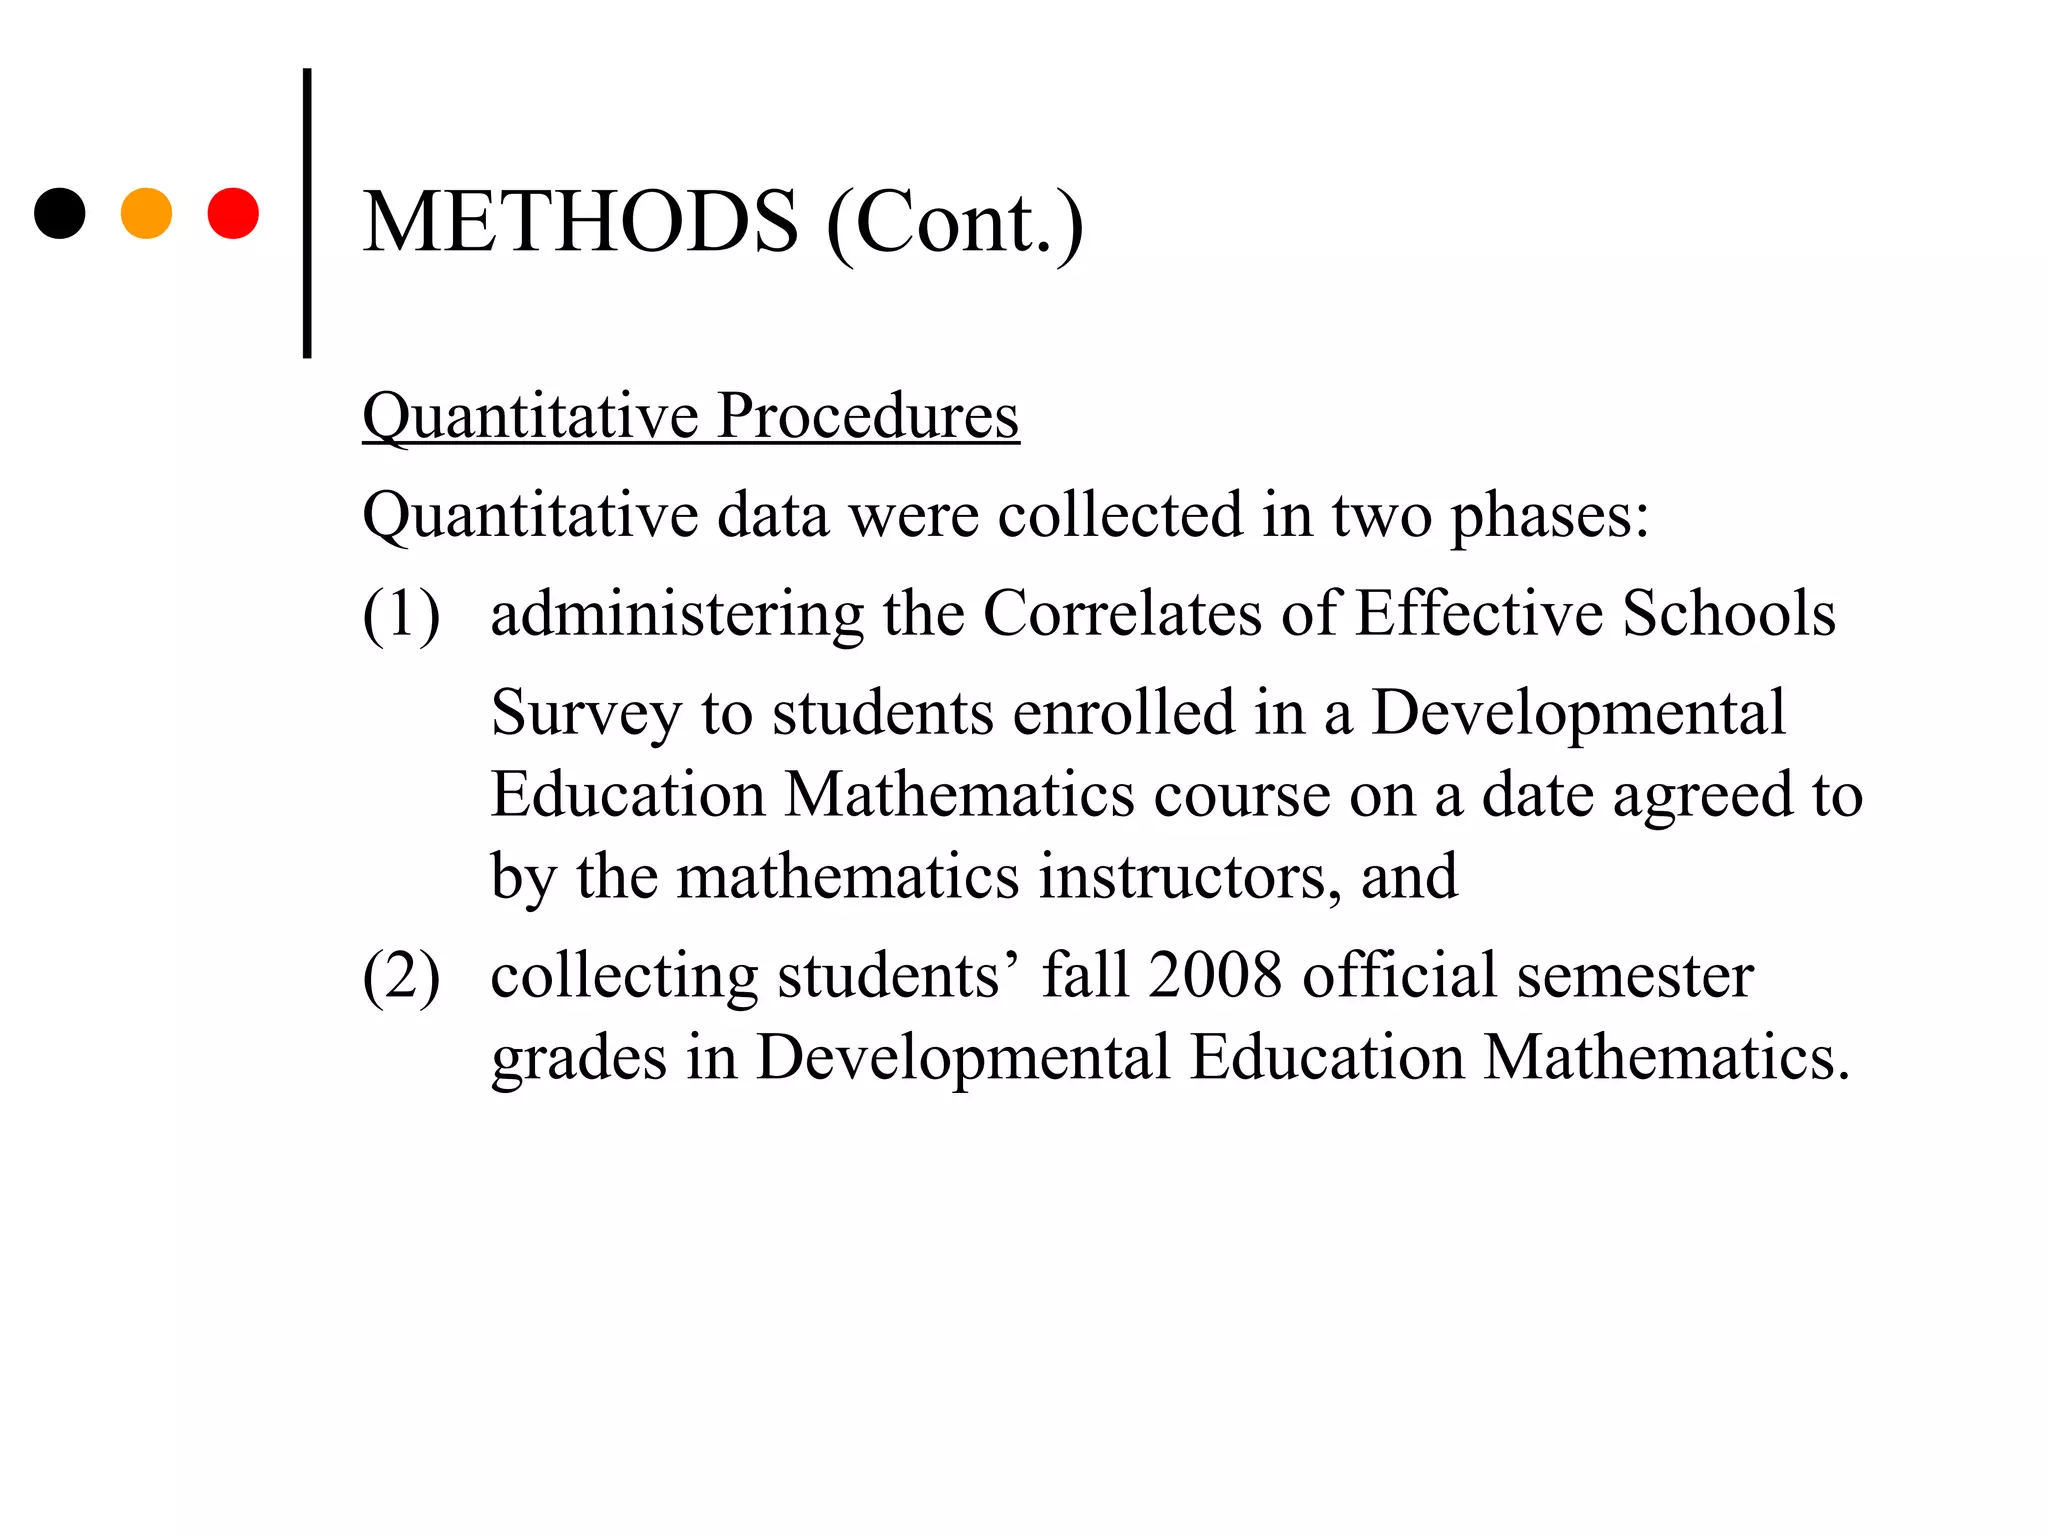
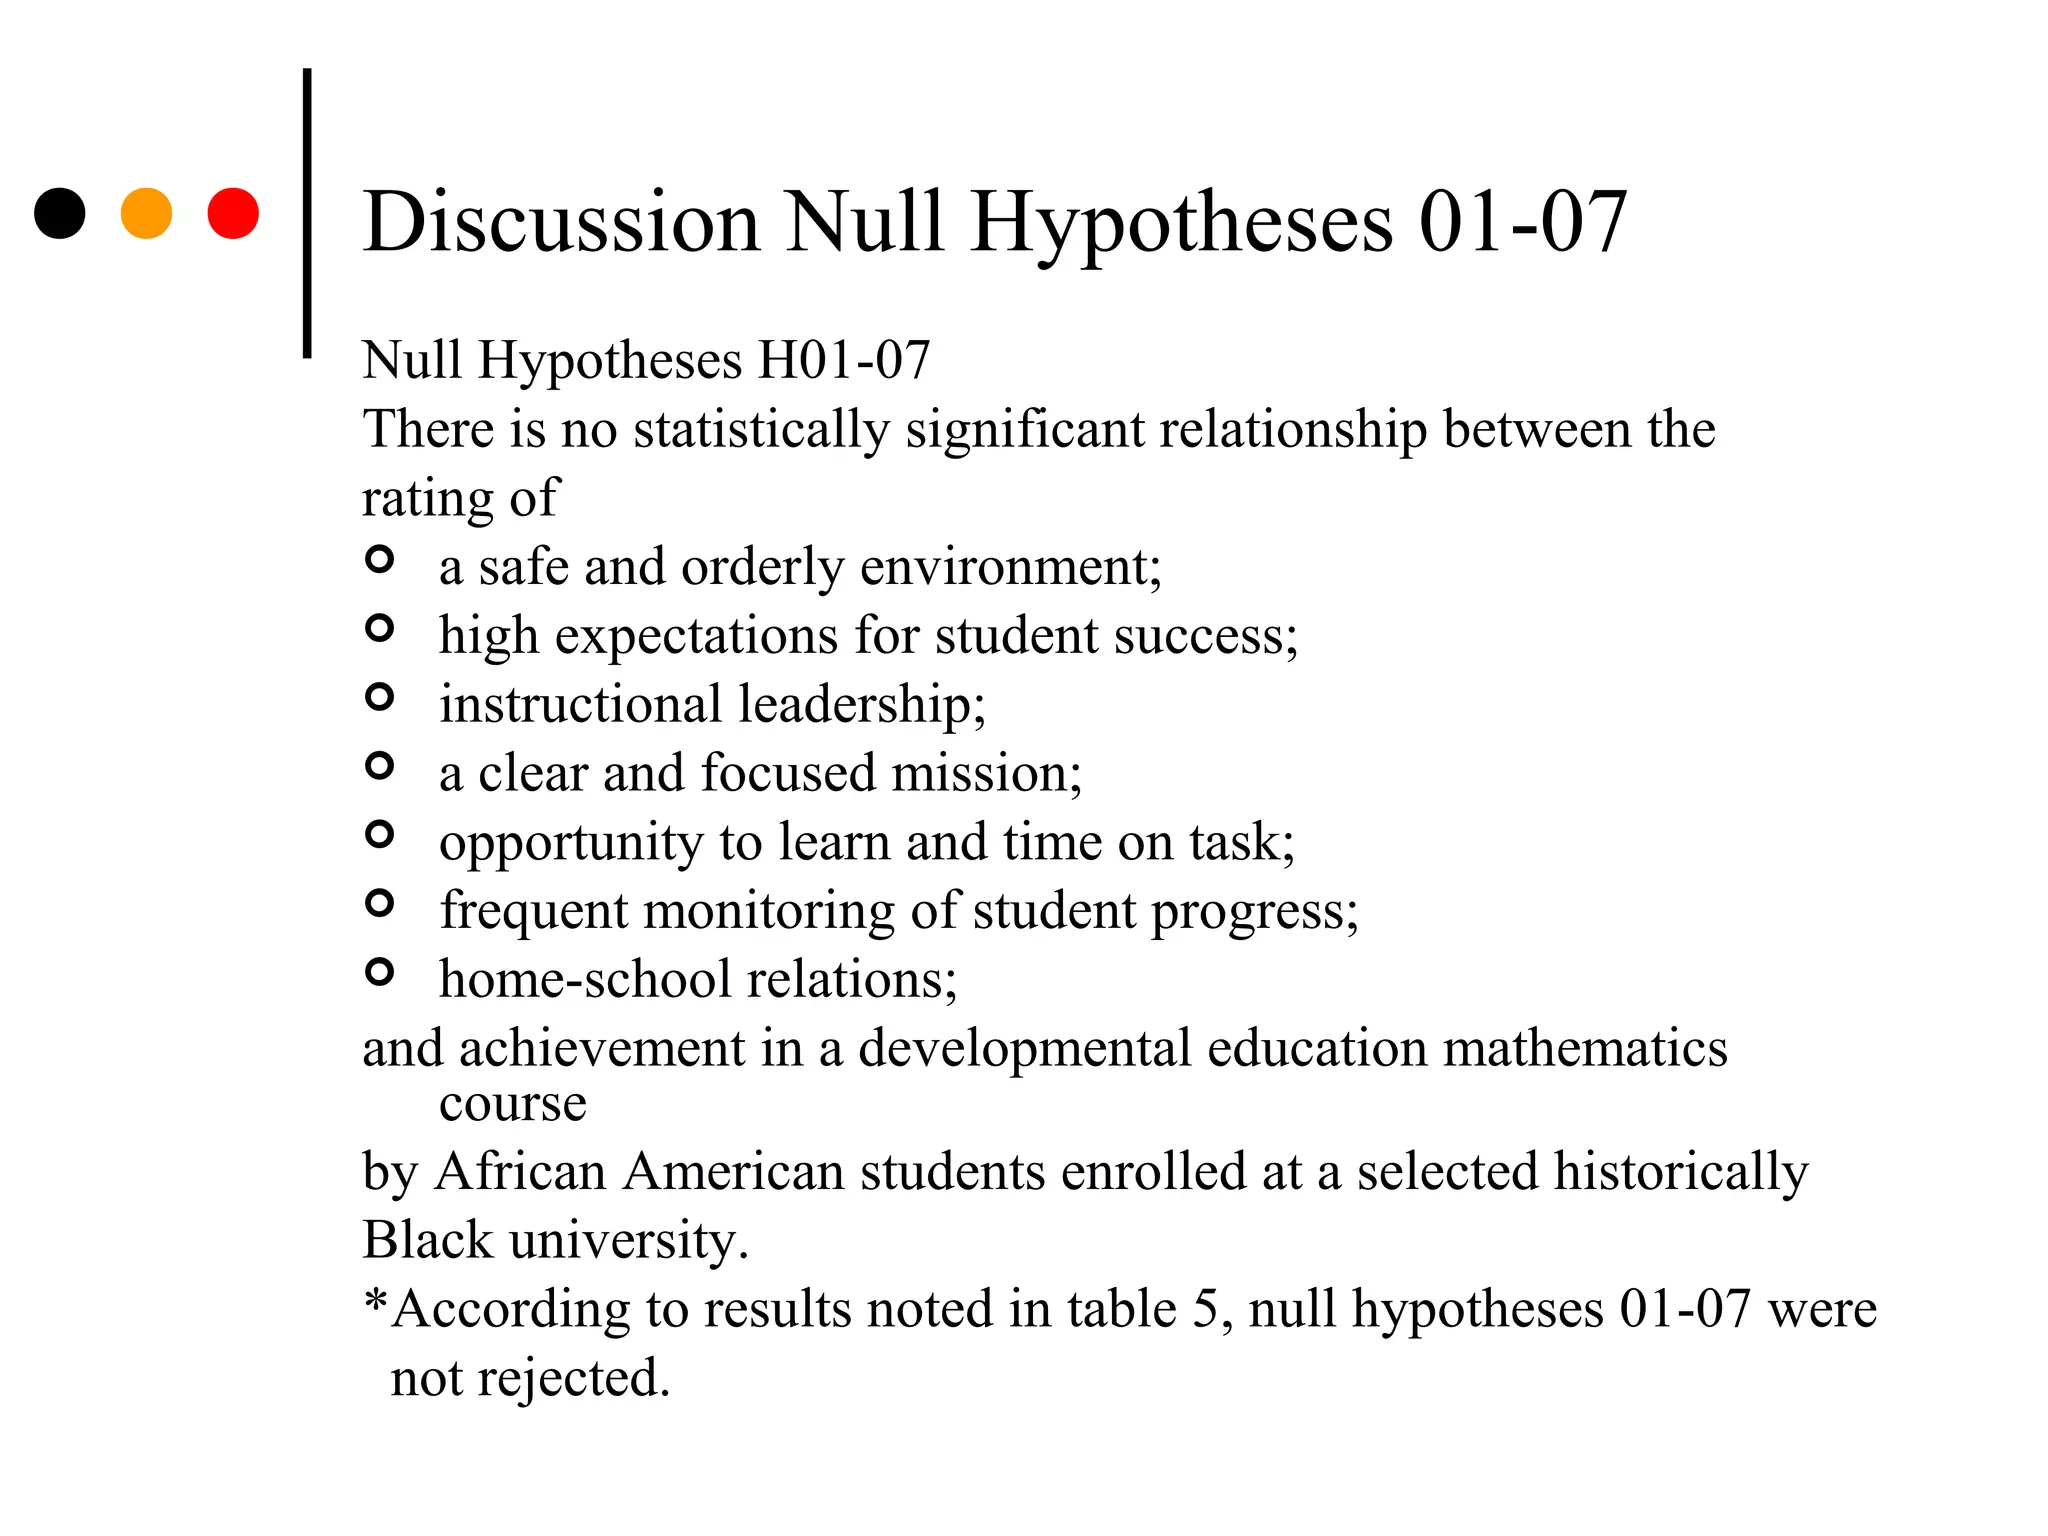
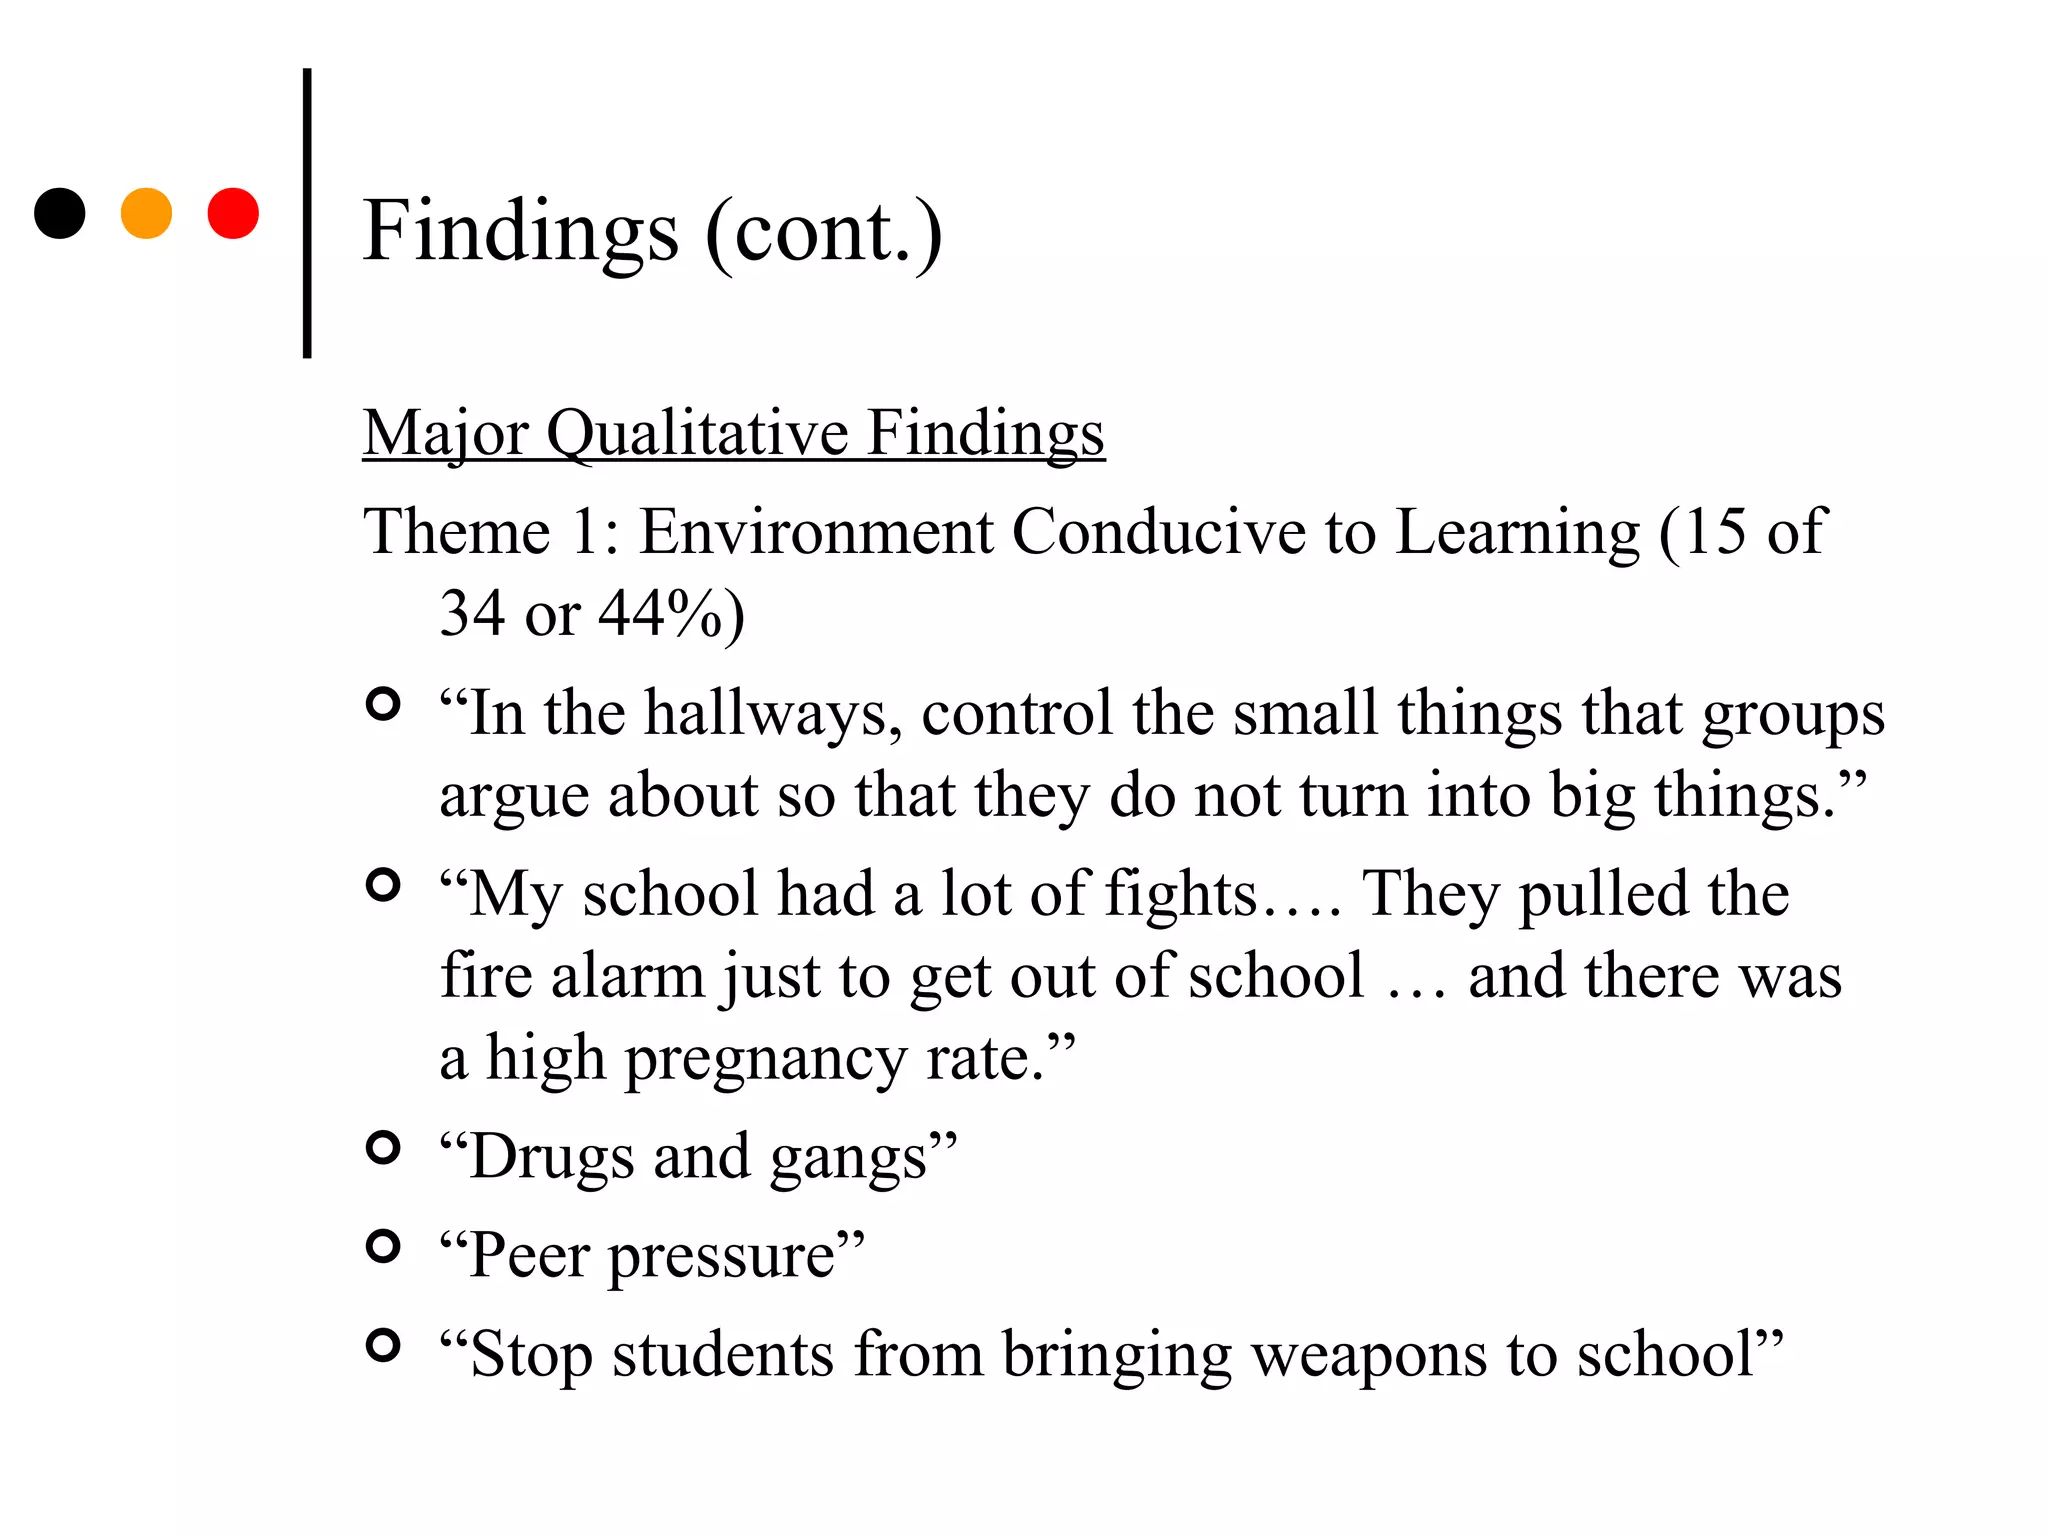
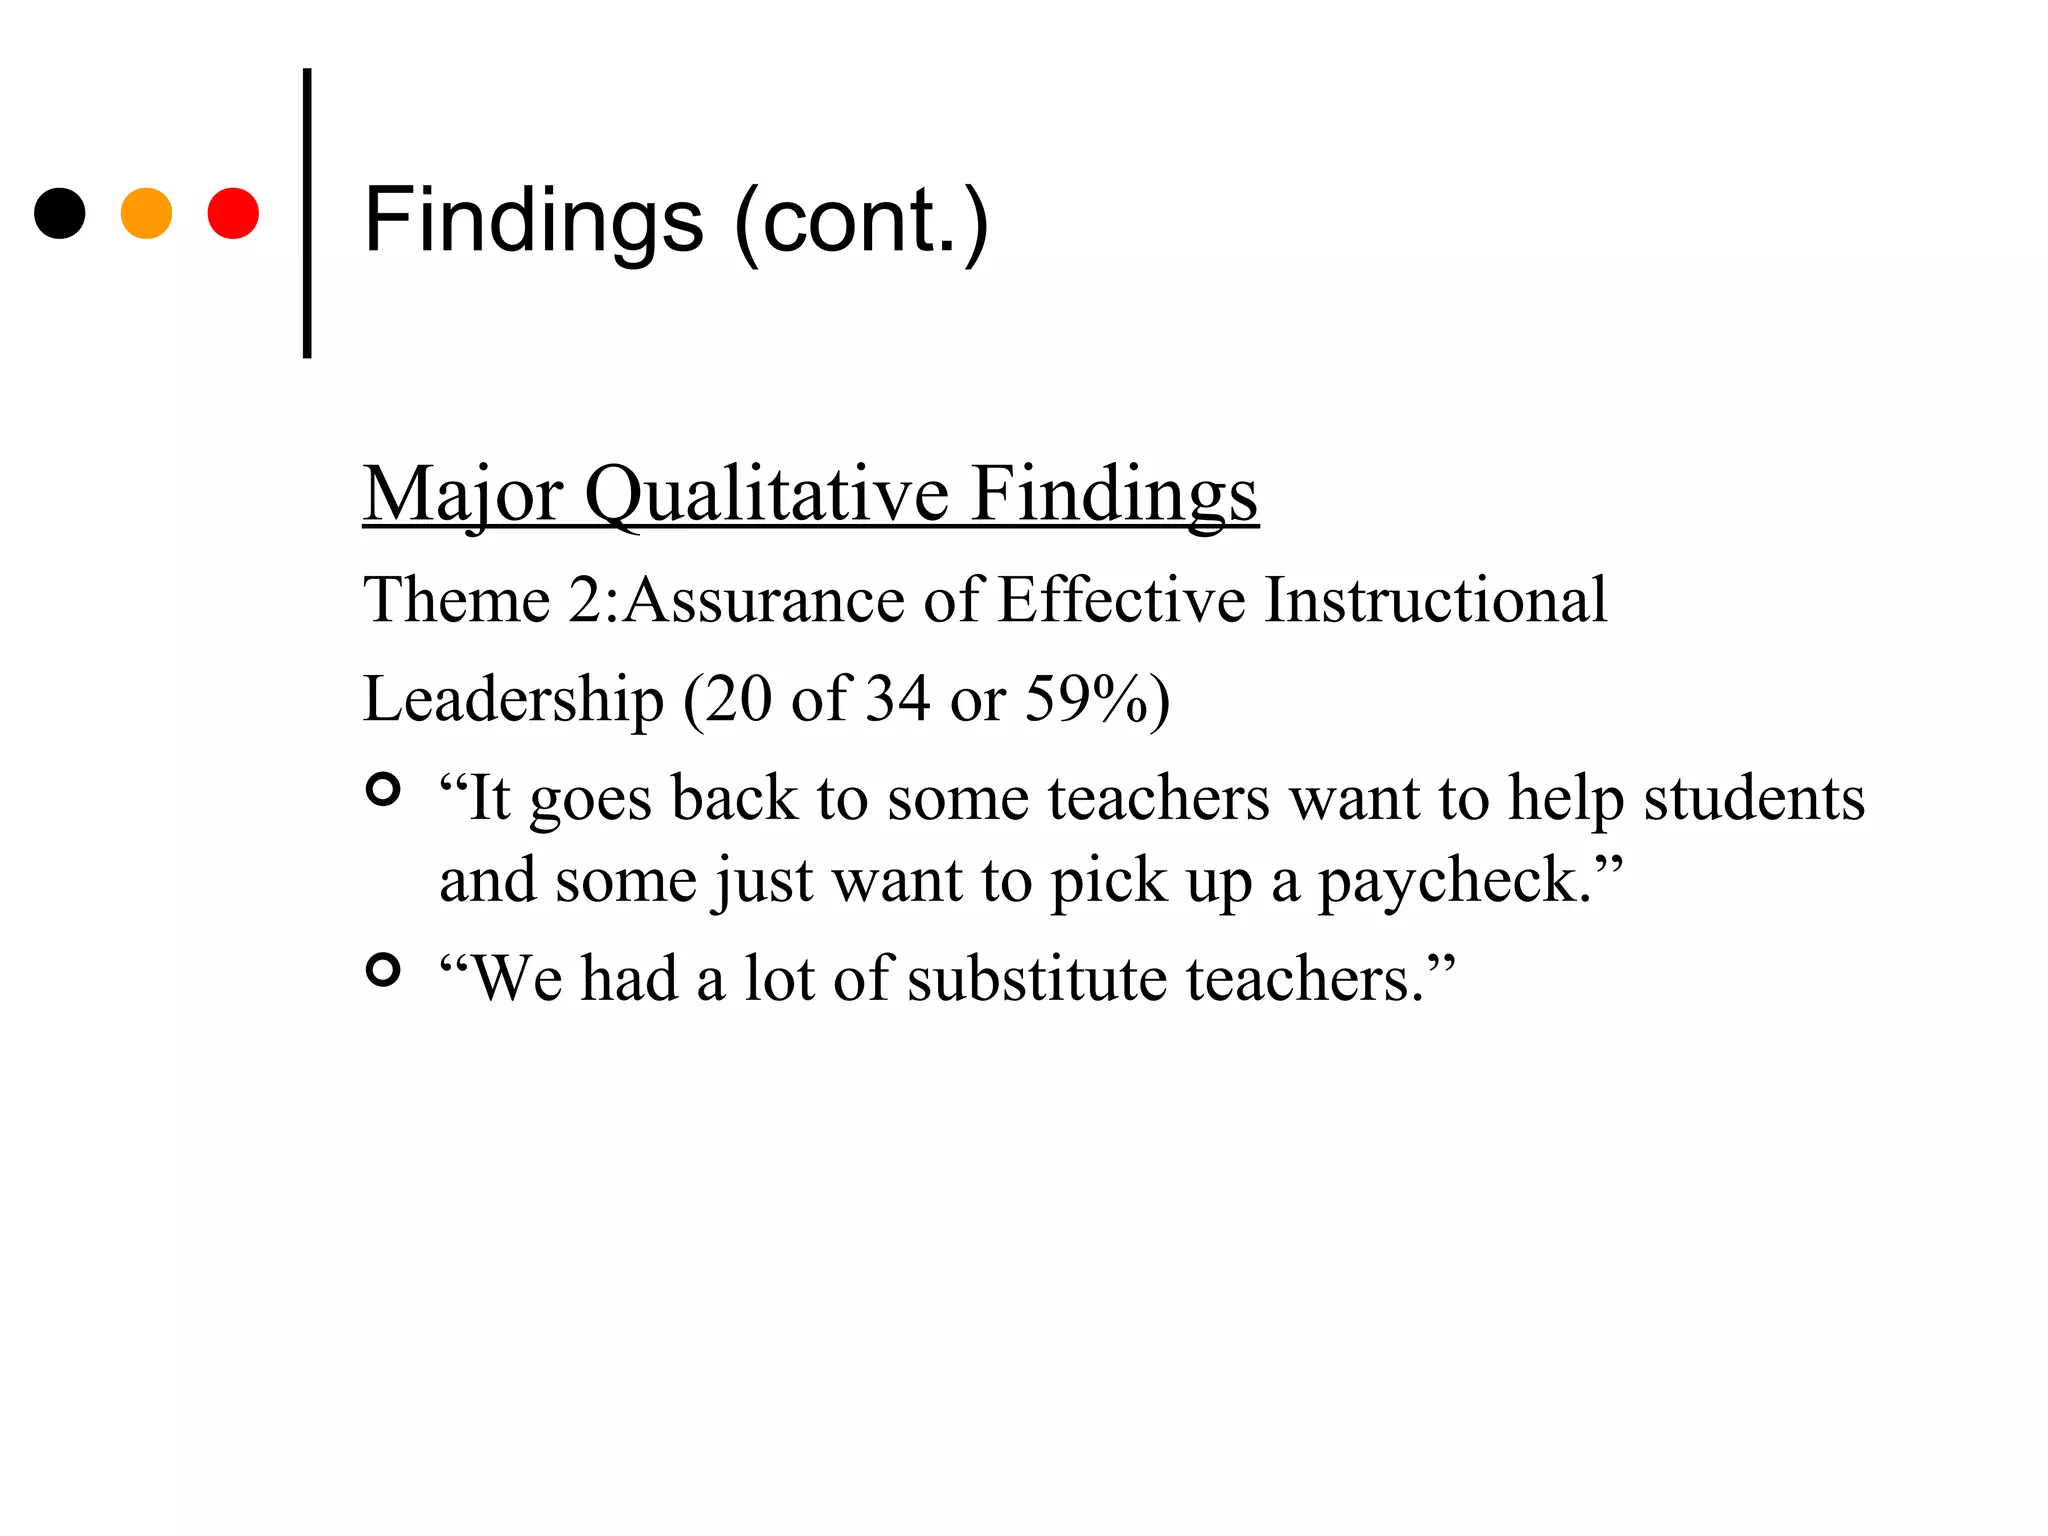
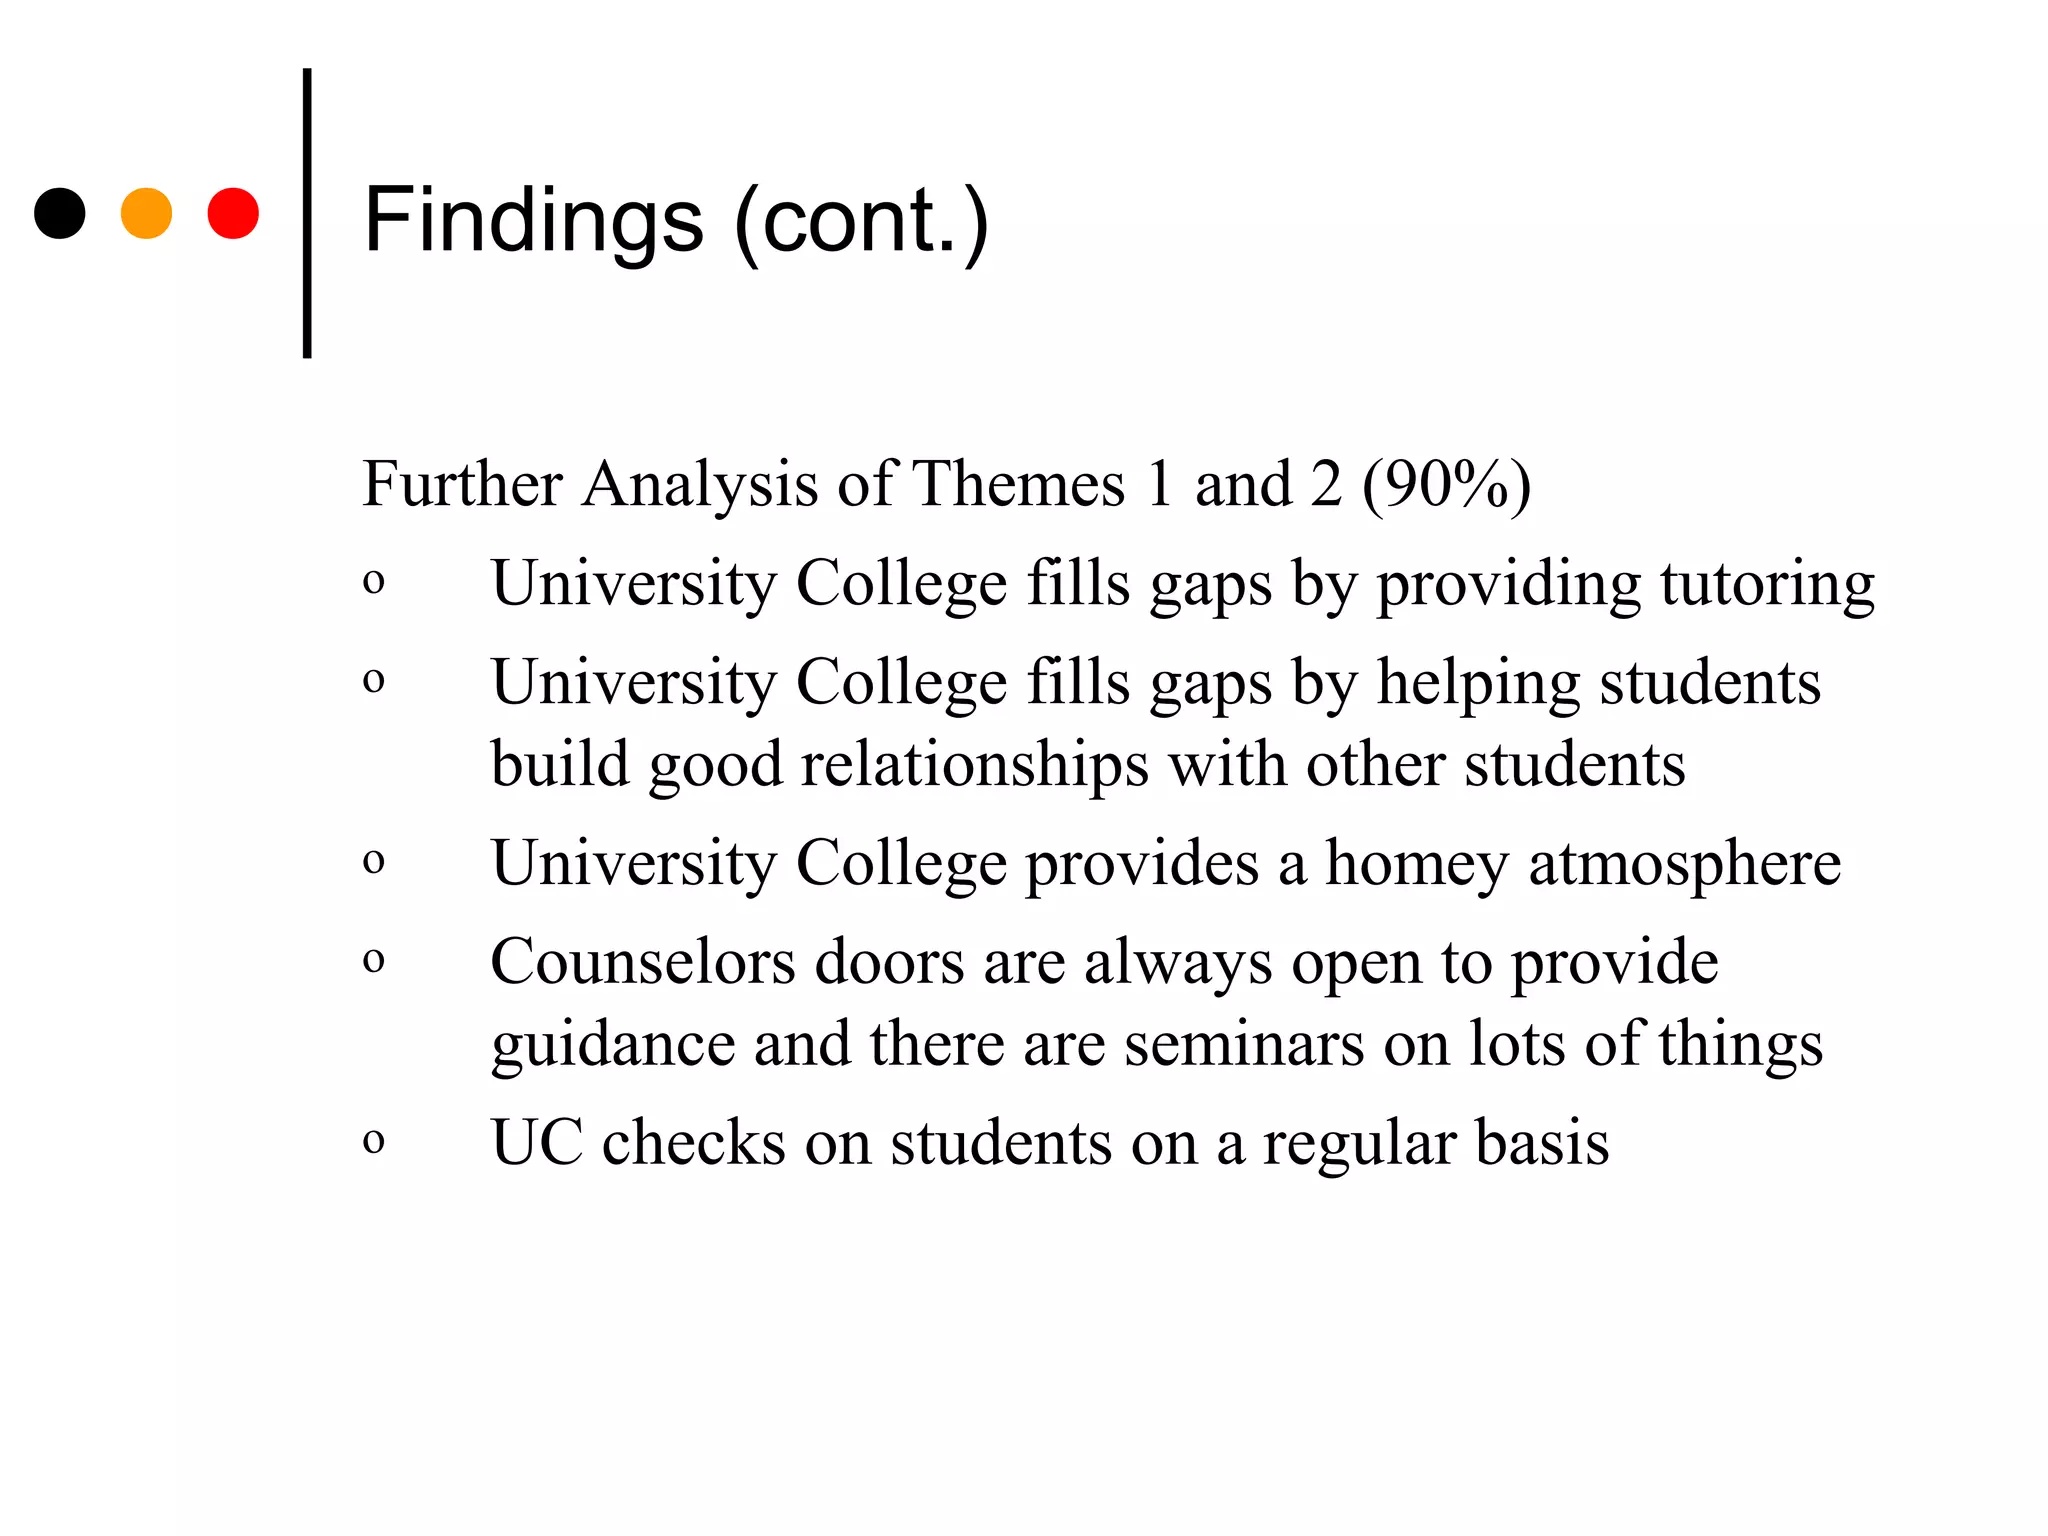
NO1 Top Black Magic Specialist In Lahore Black magic In Pakistan Kala Ilam Ex...
Dr. William Allan Kritsonis, Dissertation Chair for Steven Norfleet, Dissertation Defense PPT.
1. A MIXED METHODS STUDY OF STUDENT
EXPERENCES WITH SCHOOL PRACTICES DEEMED
IMPORTANT TO AFRICAN AMERICAN STUDENT
ACHIEVEMENT
A Dissertation Defense
by
Steven Norfleet
April 9, 2010
William Allan Kritsonis, Dissertation Chair
Major Subject: Educational Leadership
2. Dissertation Committee Members
William Allan Kritsonis, Ph.D.
(Dissertation Chair)
Camille Gibson, Ph.D. Lisa Hobson, Ph.D.
(Member) (Member)
Ronald Howard, Ph.D. Wanda Johnson, Ph.D.
(Member) (Member)
3. Dissertation Defense Format
1. Background of the Problem
2. Purpose of the Study
3. Statement of the Problem
4. Significance of the Study
5. Conceptual Model
6. Research Questions
7. Literature Review
8. Method
9. Findings
10. Discussion of Null Hypotheses
11. Conclusions
12. Recommendations
4. Background of the Problem
Public schools in the United States continue to
struggle with the issue of closing the achievement gap
between the African American student and their White
counterparts.
For some 40 years, educators and researchers alike
have attempted to implement solutions to the
achievement gap problem. Using primarily top-down
approaches, solutions have ranged from improving
teacher and administrator qualities, to improving the
curriculum, to placing more emphasis on student
outcome data, to increasing the rigor in core subject
areas, to more tutoring, to less tutoring, and on and
on.
5. Background of the Problem (cont.)
Since the first NAEP report card was issued, African
American achievement scores in reading, mathematics,
and science among 9, 13, and 17 year olds have
averaged some 30 points below their White peers.
6. Trend in Black-White Achievement Gap
in Reading 1971-2008
Source: Rampey, B.D., Dion, G.S., & Donahue, P.L. (2009). National Assessment of
Educational Progress (NAEP)
7. Trend in Black-White Achievement Gap
in Mathematics 1971-2008
Source: Rampey, B.D., Dion, G.S., & Donahue, P.L. (2009). National Assessment of Educational Progress
(NAEP)
8. Trend in Black-White Achievement Gap
in Mathematics 1971-2008
Source: Rampey, B.D., Dion, G.S., & Donahue, P.L. (2009). National Assessment of Educational Progress
(NAEP)
9. Trend in Grade Twelve Science
Achievement Gap by Race/Ethnicity
1996-2005
Source: Grigg, W., Lauko, M., and Brockway, D. (2006). The Nation’s Report Card: Science 2005 (NCES 2006-
466). Washington, DC: Department of Education, National Center for Education Statistics, U.S. Government
Printing Office.
10. Texas Assessment of Knowledge and Skills
(Met Standard, Sum of All Grades Tested 2005-
2008)
Source: Texas Education Agency, 2009
62%
67%
70% 72%
76%
80% 82% 84%
45%
52%
55%
58%
0%
10%
20%
30%
40%
50%
60%
70%
80%
90%
2005 2006 2007 2008
Year
All
White
African
American
Percent
Passing
11. Texas College Readiness Scores
Texas Scholastic Aptitude Test (SAT)
Results
0
200
400
600
800
1000
1200
Year
MeanScore
State 987 992 991 992
White 1047 1059 1059 1056
African American 843 855 860 867
2004 2005 2006 2007
Texas American College Test (ACT) Results
0
5
10
15
20
25
Year
MeanScore
State 20.1 20 20.1 20.2
White 21.8 21.8 22 22
African American 17.1 17 17.1 16.9
2004 2005 2006 2007
Source: Texas Education Agency, 2009
12. Background of the Problem (cont.)
Rovai, Gallien Jr. and Stiff-Williams (2007) present
the added complexity that closing the achievement
gap in elementary and secondary schools has now
carried over to higher education.
13. Background of the Problem (cont.)
Thompson (2002) remarked that because of the
increase in pressure on K-12 school administrators
to meet higher federal and state accountability
standards including all of the other responsibilities
placed on school administrators, California school
leaders are asking, what can we do to improve the
academic performance of African American
children?
14. Background of the Problem (cont.)
Lingard, Ladwig and Luke (2004) point out that the
black box of schooling needs to be opened with
more in depth, qualitative analyses of processes that
actually occur in schools.
Cooper (2000) - If reform-minded educators are
serious about closing the achievement gap before
several decades pass in the new millennium, we
must continue to identify alterable factors in the
schooling process that help to promote academic
success among all students and particularly students
of color.
15. Background of the Problem (cont.)
Marzano (2003) - If a school can simply
identify those variables on which it is not
performing well, it can pinpoint and receive
the information it needs to improve student
achievement.
16. Purpose of the Study
The purpose of the mixed methods study was to
describe African American students’ perceptions of
effective leadership practices at their high schools.
17. Statement of the Problem
The 2001 No Child Left Behind Act is arguably the most
sweeping
federal education reform effort to force schools to close the
achievement gap for minorities since the Civil Rights Act of 1964
and the Elementary and Secondary Education Act of 1965.
Although the NCLB legislation has now been in effect for nine
years, recent National Assessment of Educational Progress
(NAEP), ACT, SAT, and in Texas the Texas Assessment of
Knowledge and Skills (TAKS) scores, have not shown a
significant decrease in the academic achievement gap between
African American students and their White counterparts.
18. Significance of the Study
Understanding that raising student achievement directly leads to
growth in the national economy and the provision of a smarter work
force, the 2001 NCLB ACT provided additional federal funds to states
to improve achievement. With a specific focus on sub-populations, the
ACT mandates higher teaching standards, more accountability, and
increased student performance.
Barber (2008) points out in the 1960s the U.S. led the world in high
school qualifications and Korea was 27th. Now Korea leads the world
and the U.S. is 13th and falling. As recently as 1995 the U.S. was
second in the world on college-level graduation rates; just a decade
later it has slipped to 14th
.
Trends in International Mathematics and Science Study or TIMSS
(2007) indicate that eighth grade United States students are ninth in
the world in mathematics and tenth in science out of 47 countries
tested.
19. Significance of the Study (cont.)
This study sought to improve the practices of the
education team. Results of the study may:
o generate new strategies and approaches to employ
by the education team that could lead to improved
academic achievement in all students;
o provide quantitative and qualitative data to school leaders
on the influence of an effective high school on the
achievement of African American students that are
considered at risk as college students;
20. Significance of the Study (cont.)
o provide college and university teacher education programs
with information on schooling leadership practices that
resonate with African American learners;
and
o for policy makers, results may shed light on funding support
and program interventions that African American students
say are needed with future generations of African American
students from similar backgrounds as themselves.
21. Conceptual Model
o According to the Aspen Institute (2008), given the stakes of
closing the achievement gap, it is imperative to improve the
performance of the education team to achieve greater success in
schools.
o Chubb and Moe (1990) stated
All things being equal, a student in an effectively
organized school achieves at least a half-year more
than a student in an ineffectively organized school
over the last two years of high school. If this difference can
be extrapolated to the normal four-year high school
experience, an effectively organized school may
increase the achievement of its students by more
than one full year.
22. Conceptual Model (cont.)
Lezotte’s Correlates of Effective Schools
SAFE AND ORDERLY
ENVIRONMENT
CLIMATE OF HIGH EXPECTATION
FOR SUCCESS
CLEAR AND FOCUSED MISSION
POSITIVE HOME/SCHOOL RELATIONS
FREQUENT MONITORING OF
STUDENT PROGRESS
OPPORTUNITY TO LEARN, TIME ON
TASK
INSTRUCTIONAL LEADERSHIP Student
Improved
Student
Achievement
23. Research Questions
Quantitative
1. How do African American students, enrolled
in a developmental education mathematics
course at a selected Black university describe
their experiences with each correlate of
effective schools?
2. How do the correlates of effective high schools
relate to student achievement in a
developmental education mathematics course,
for freshman and sophomore African
American students enrolled at a selected Black
university?
24. Research Questions (cont.)
Qualitative
1. How do African American students enrolled in a
developmental education mathematics course at a selected
historically Black university report that their former high
school campus strove to improve academic achievement for
all by:
providing a safe and orderly environment for learning;
encouraging high expectations for success for all students;
demonstrating effective instructional leadership;
implementing a clear and focused mission;
maintaining an opportunity to learn and quality time on
tasks for all students;
frequently monitoring student progress; and
developing and sustaining strong home-school relations?
25. Review of Literature
Collyn Bray Swanson (2004) examined safe and orderly
environment in a study to determine if there was a difference in
the performance of military dependent African American
students attending a public school and military dependent
African American students attending Department of Defense
schools. Results indicated students in the Department of
Defense schools scored higher on college entrance exams than
did the African American students in the public school system.
26. Review of Literature (cont.)
Bamburg and Andrews (1990) conducted an investigation
specifically looking at the relationships of a clear and focused
mission and the role of the principal as the campus
instructional leader to the academic achievement of students.
Results indicated that the school goal “To insure academic
excellence” showed a significant difference between high
achieving and low achieving schools.
27. Review of Literature (cont.)
Gentulucci and Muto (2007) conducted a study investigating
students’ perceptions of what principals as instructional
leaders do to influence their academic achievement.
1. One finding was when principals visited classrooms and
interacted with students the effect on achievement was more
influential than the instructional leader whose visits were few,
short, and passive.
2. Students also indicated that principals that walked around the
classroom, checked on their work, and provided gentle advice
had more powerful influence on their learning than those
sitting in the back of the classroom and observing passively.
28. Review of Literature
Boscardin (2005) conducted a study to determine how
Opportunity To Learn (OTL) variables impact student
outcomes and if the effects were consistent across the subjects
of English and algebra assessments. One finding of the study
was content coverage was extended when student time was not
interrupted. This result was found to be consistently associated
with student performance.
29. Review of Literature
Zuelke (1982) attempted to customize a model that school
districts could use to reallocate human and material resources
to enhance reading and mathematics achievement. The study
summarized that evidence existed to suggest certain school
related variables such as student time-on-task do make a
difference in mathematics and reading achievement.
30. Review of Literature
Zavadsky (2006) research focused on frequent monitoring of
school progress in five urban school districts that were
awarded the Broad Prize for the most improved school districts
in the United States. One consistent finding was a commitment
to share and use data and assessments to inform instructional
decisions that affect the student, classes, the school, and the
district.
31. Review of Literature
Stewart’s (2007) study looked at 546 high schools that
included 1,238 African American students. Students were
asked on the survey to indicate the degree to which parents
engaged in a variety of school activities ranging from parent
organization meetings to volunteering. Results indicated the
importance of the role of educational leaders in building strong
relationships between parents and the school, for improved
achievement of the African American learner.
32. Review of Literature (cont.)
Scheerens and Bosker (1997) identified eight
characteristics of successful schools
including a focus on achievement and
monitoring of student progress.
Marzano (2003) identified five
characteristics of highly successful schools,
and stresses challenging goals and effective
feedback as major components to achieving
high expectations.
33. METHODS
A mixed-methods approach with explanatory design and
sequential procedures was employed to address the research
problem.
o An assumption in using mixed methods was that the
combination of the quantitative and qualitative methods would
provide a better overall view of the research problem than
either method by itself.
o To meet the requirements of the explanatory design and
sequential procedures, quantitative data were collected first.
This was followed by collection of the qualitative data.
34. METHODS (cont.)
Null Hypotheses
H01 – There is no statistically significant relationship between
the rating of a safe and orderly environment and achievement
in a developmental education mathematics course by African
American students enrolled at a selected historically Black
university.
H02 – There is no statistically significant relationship between
the rating of high expectations for success and achievement in
a developmental education mathematics course by African
American students enrolled at a selected historically Black
university.
H03 – There is no statistically significant relationship between
the rating of instructional leadership and achievement in a
developmental education mathematics course by African
American students enrolled at a selected historically Black
university.
35. METHODS (cont.)
H04 – There is no statistically significant relationship between the
rating of a clear and focused mission and achievement in a
developmental education mathematics course by African American
students enrolled at a selected historically Black university.
H05 – There is no statistically significant relationship between the
rating of opportunity to learn and time on task and achievement in a
developmental education mathematics course by African American
students enrolled at a selected historically Black university.
H06 – There is no statistically significant relationship between the
rating of frequent monitoring of student progress and achievement in
a developmental education mathematics course by African American
students enrolled at a selected historically Black university.
H07 – There is no statistically significant relationship between the
rating of home-school relations and achievement in a developmental
education mathematics course by African American students enrolled
at a selected historically Black university.
36. Methods (cont.)
Subjects of the Study
The target population was 378 African American
freshman and sophomore college students enrolled in
both the fall 2008 and spring 2009 semesters of a
developmental education mathematics course at a
selected historically black university (HBU).
Quantitative Sample
o Quantitative - Ninety-eight (N=98) students were
conveniently selected and gave their consent to
participate as a member of the sample group.
37. Methods (cont.)
Demographic Data of Student Participants
Equivalent Percent of African American Student Participants Enrolled in Developmental
Education Mathematics by Gender (N=98)
______________________________________________________________________
Gender N Percent
______________________________________________________________________
Male 35 35.7
Female 63 64.3
Student Participants Enrolled in Developmental Education Mathematics at a Selected
Historically Black College and University (HBCU) by Classification (N=98)
______________________________________________________________________
Classification N Percent
______________________________________________________________________
Freshman 78 79.6
Sophomore 20 20.4
38. METHODS (Cont.)
Quantitative Instrumentation
Permission was granted by Effective Schools Products Ltd. to
use the database of 2000 questions to create the 42 question-
items of the Correlates of Effective Schools Survey.
Seven correlates were divided into three sub-categories per
correlate, with six questions that combined to describe the
correlate. Twenty-one questions were worded in the positive
and 21were worded in the negative.
Demographic Section – participants self-identified their
classification as college students, by ethnicity, gender, and
high school attended.
39. METHODS (Cont.)
Reliability and Validity of Quantitative Instrument
(1) Construct validity was based on Lezotte’s seven
Correlates of Effective Schools.
(2) Content validity was checked by a panel of experts.
1. Dissertation chair
2. One assistant professor at the current university
3. One assistant professor at a local university
(3) Table 5.
Cronbach Alpha of Student Participant Responses on Seven Scales of the Correlates of
Effective Schools Survey
________________________________________________________________________
Number of Items Cronbach Alpha Cronbach Alpha Based on
Standardized Items
________________________________________________________________________
7 0.909 0.911
*The results showed that this instrument was reliable.
40. METHODS (Cont.)
Quantitative Procedures
Quantitative data were collected in two phases:
(1) administering the Correlates of Effective Schools
Survey to students enrolled in a Developmental
Education Mathematics course on a date agreed to
by the mathematics instructors, and
(2) collecting students’ fall 2008 official semester
grades in Developmental Education Mathematics.
41. METHODS (Cont.)
Subjects of the Study
The target population was 378 African American freshman and
sophomore college students enrolled in both the fall 2008 and
spring 2009 semesters of a developmental education mathematics
course at a historically Black university.
Qualitative Sample
o Qualitative - Ninety-eight African American college students
agreed to participate in the interview phase of the study. Of this
number, 34 were purposely drawn as the sample group to
participate in focus group interviews.
43. METHODS (Cont.)
Qualitative Procedures
Qualitative data were collected on two interview days:
o Qualitative data were collected in semi-structured
interviews with student participants.
o There were 34 students that participated in the two
interview phases of the study.
o Assignment to focus groups was determined by
mathematics instructors giving the researcher the
permission to conduct student interviews in the
classroom and at the regular class time on agreed
upon dates. Two students were interviewed
individually.
44. Findings
Research Question #1 Statistical Measurement
How do African American
students, enrolled in a
developmental education
mathematics course at a selected
historically Black university
describe their experiences with
each correlate of effective
schools?
Descriptive statistics
measures including central
tendencies, frequency
distribution, and percentages
were used to summarize the
results of the survey.
Quantitative Analysis and Findings (SPSS 13.0)
45. Table 3.
Descriptive Statistics of Correlates of Effective Schools Survey Results
by Subscale (N=98)
__________________________________________________________
Correlate Range Min Max Sum M SD
__________________________________________________________
Safe and orderly
environment (1-6) 15 6 21 1208 12.33 3.089
High expectations
for success (7-12) 14 6 20 1159 11.83 3.050
Instructional leader-
ship (13-18) 19 5 24 1226 12.51 3.975
Clear and focused
mission (19-24) 17 6 23 1179 12.0 3.288
Opportunity to learn,
time on task (25-30) 15 7 22 1262 12.88 2.923
Frequent monitoring of
student progress (31-36) 16 6 22 1192 12.16 2.824
Home-school relations
(37-42) 16 7 23 1406 14.35 2.981
46. Findings (cont.)
RESEARCH
QUESTION #2
HYPOTHESES INDEPENDENT
VARIABLES
DEPENDENT
VARIABLE
STATISTICAL
TEST
How does the
correlates of
effective high
schools relate to
student achievement
in a developmental
education
mathematics course,
for freshman and
sophomore African
American students
enrolled at a
selected historically
Black university?
H01-07 There is no statistically
significant relationship between
the rating of
o a safe and orderly environment
o high expectations for success
o instructional leadership
o clear and focused mission
o opportunity to learn and time on
tasks
o frequently monitoring student
progress
o home-school relations
and achievement in a
developmental education
mathematics course by African
American students enrolled at a
selected historically Black
university
Correlates
of
Effective Schools
Semester Grade in
Developmental
Education
Mathematics
(1) Correlation
using Pearson r
and Multiple
Regression Analysis
R²
(2) Two-Tailed Test
of Significance
Quantitative Findings and Analysis (SPSS 13.0)
48. Findings (cont.)Table 4.
Pearson Correlation and Two-Tailed Test of Significance as a Function of Mathematics Grade (N=98)
________________________________________________________________________
Correlate Function of Mathematics Grade
Pearson Correlation (r) Significant (Two-Tailed)
________________________________________________________________________
Safe and orderly environment
(items 1-6) 0.080 0.431
High expectations for success
(7-12) -0.042 0.684
Instructional leadership
(13-18) 0.107 0.294
Clear and focused mission
(19-24) 0.058 0.571
Opportunity to learn, time on task
(25-30) -0.076 0.455
Frequent monitoring of student
progress (31-36) 0.180 0.076
Home-school relations
(37-42) 0.021 0.835
*p < 0.05, two-tailed.
49. Discussion Null Hypotheses 01-07
Null Hypotheses H01-07
There is no statistically significant relationship between the
rating of
a safe and orderly environment;
high expectations for student success;
instructional leadership;
a clear and focused mission;
opportunity to learn and time on task;
frequent monitoring of student progress;
home-school relations;
and achievement in a developmental education mathematics
course
by African American students enrolled at a selected historically
Black university.
*According to results noted in table 5, null hypotheses 01-07 were
not rejected.
50. Findings (cont.)
Major Qualitative Findings
Theme 1: Environment Conducive to Learning (15 of
34 or 44%)
“In the hallways, control the small things that groups
argue about so that they do not turn into big things.”
“My school had a lot of fights…. They pulled the
fire alarm just to get out of school … and there was
a high pregnancy rate.”
“Drugs and gangs”
“Peer pressure”
“Stop students from bringing weapons to school”
51. Findings (cont.)
Major Qualitative Findings
Theme 2:Assurance of Effective Instructional
Leadership (20 of 34 or 59%)
“It goes back to some teachers want to help students
and some just want to pick up a paycheck.”
“We had a lot of substitute teachers.”
52. Findings (cont.)
Further Analysis of Themes 1 and 2 (90%)
o University College fills gaps by providing tutoring
o University College fills gaps by helping students
build good relationships with other students
o University College provides a homey atmosphere
o Counselors doors are always open to provide
guidance and there are seminars on lots of things
o UC checks on students on a regular basis
53. Conclusions
The present study focused on the voice left out in the research
on improving African American achievement, the student as a
member of the problem solving team.
What works best in schools for improving student achievement
—and in this study, specifically for African American
achievement—will be unique to the population the school
serves.
The quantitative findings indicated 68.3% of study respondents
thought that their high school was running effectively.
The qualitative findings revealed that a safe learning
environment, strong instructional leadership, and good teachers
were what student participants said really matters in improving
achievement of future students from similar backgrounds as
themselves.
54. Conclusions (cont.)
For school leaders, it is important to continue to
believe that schools can make a difference and
overcome obstacles to learning and success on the
part of all students.
Student participants disclosed in interviews that they
were thankful for the opportunity to pursue a college
degree. They also thought it was good that there
were programs in place at their current university to
help them overcome their deficiencies to achieving.
In closing, it is important that in moving forward the
learner is consulted from time to time on how his or
her educators are doing.
55. Recommendations
To address the obstacles to achieving at the highest levels from the
perspective of study participants, the following recommendations are
presented.
Recommendations for Teachers, Counselors, Principals, and Other
Educational Leaders:
Student participants indicated that good teachers and a good
learning environment were very important.
School leaders should maintain an aligned curriculum in which
high school and first year of college curricula in core subjects are
fluid.
There should be more direct conversations between high school
teachers and college instructors.
African American students in grades 9-14 should receive more
guidance and counseling in terms of building self-confidence,
solidifying future plans, developing strong time-management skills,
and developing strong goal setting skills.
56. Recommendations (cont.)
Recommendations for Policy Makers
Policy makers should provide information and
continue funding programs on college campuses that
help students with known deficiencies to catch up in
core subjects.
Policy makers should fund guidance counseling
services on a variety of issues for students in grades
9-14.
57. Recommendations (cont.)
Recommendations for Further Study
A study could be conducted with first-year of
college mathematics and science instructors to
learn more about the challenges they face and the
relationship of their pedagogical training to
African American student achievement.
A study could be conducted with a similar
population at other predominantly Black
institutions of higher education to understand if a
trend can be established.
A similar study could be conducted with Hispanic
and Asian student populations to determine their
needs in the transition from high school to college.
58. REFERENCES
Bamburg, J. D., & Andrews, R. L. (1990, April). Instructional
leadership, school goals, and student achievement: Exploring the
relationship between means and ends. Paper presented at the Annual
Meeting of the American Educational Research Association, Boston,
MA.
Barber, Sir M. (2008). Neither rest nor tranquility: Education and the
American dream in the 21st century. Washington, DC: Aspen
Institute.
Chubb, J., & Moe, T. (1990). Politics, markets, and America’s
schools. Washington, DC: The Brookings Institute.
Cooper, R. (2000). Urban school reform from a student-of-color
perspective. Urban Education, 34(5), 597-622.
Gentulucci, J. (2004). Improving school learning: The student
perspective. Educational Forum, 68(2), 133-141.
59. REFERENCES
Gentulucci, J., & Muto, C. (2007). Principal’s influence on academic
achievement: The student perspective. NASSP Bulletin, 91(3), 219-236.
Lezotte, L. (2007). Surveys and survey sampling. Retrieved November 20,
2007, from http://esrealitycheck.com/rc/gettingStarted.htm
Marzano, R. (2003). What works in schools: Translating research into action.
Alexandria, VA: Association for Supervision and Curriculum Development
Publishers.
Rovai, A., Gallien Jr., L., & Stiff-Williams, H. (2007). Closing the African
American achievement gap in higher education. New York, NY: Teachers
College Press, Columbia University.
Thompson, G. (2002). African American teens discuss their schooling
experiences. Westport, CT: Gergin and Garvey Publishers.
Thompson, G. (2008). Beneath the apathy: Black and Latino students in a low--
performing high school identify the school factors that keep them from
engaging in learning. Educational Leadership, 65(6), 53-54.
60. Thank you for attending my presentation.
STEVEN NORFLEET