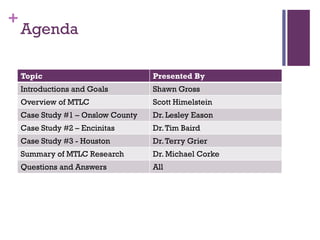
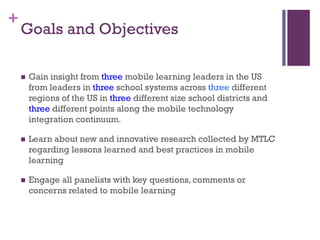
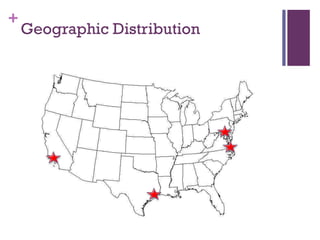
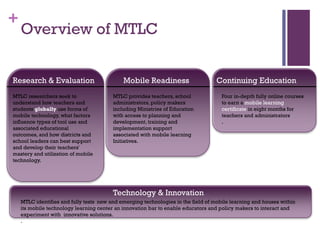
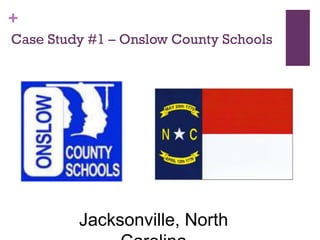
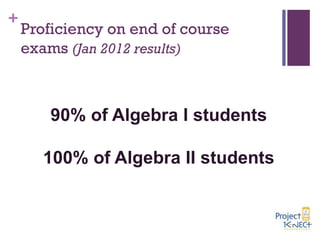
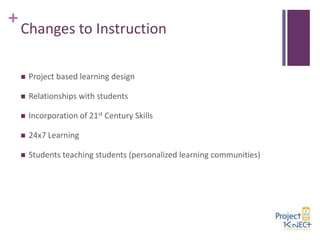
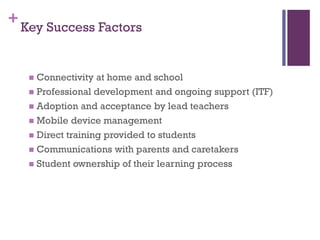
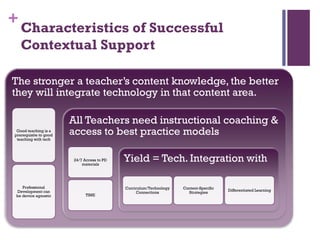
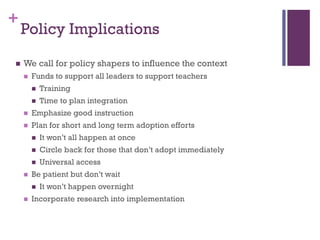
MLW14 UNESCO - US Panel on Best Practices and Lessons Learned
1. +
Best Practices & Lesson
Learned in Mobile Learning
A perspective from school leaders in the US
2. +
Agenda
Topic
Presented By
Introductions and Goals
Shawn Gross
Overview of MTLC
Scott Himelstein
Case Study #1 – Onslow County
Dr. Lesley Eason
Case Study #2 – Encinitas
Dr. Tim Baird
Case Study #3 - Houston
Dr. Terry Grier
Summary of MTLC Research
Dr. Michael Corke
Questions and Answers
All
3. +
Goals and Objectives
Gain insight from three mobile learning leaders in the US
from leaders in three school systems across three different
regions of the US in three different size school districts and
three different points along the mobile technology
integration continuum.
Learn about new and innovative research collected by MTLC
regarding lessons learned and best practices in mobile
learning
Engage all panelists with key questions, comments or
concerns related to mobile learning
7. +
Overview of MTLC
Research & Evaluation
MTLC researchers seek to
understand how teachers and
students globally use forms of
mobile technology, what factors
influence types of tool use and
associated educational
outcomes, and how districts and
school leaders can best support
and develop their teachers'
mastery and utilization of mobile
technology.
Mobile Readiness
MTLC provides teachers, school
administrators, policy makers
including Ministries of Education
with access to planning and
development, training and
implementation support
associated with mobile learning
Initiatives.
Continuing Education
Four in-depth fully online courses
to earn a mobile learning
certificate in eight months for
teachers and administrators
.
Technology & Innovation
MTLC identifies and fully tests new and emerging technologies in the field of mobile learning and houses within
its mobile technology learning center an innovation bar to enable educators and policy makers to interact and
experiment with innovative solutions.
.
9. +
District Profile – Onslow County
Schools
Total enrollment— 26,377
Grades served—Pre-kindergarten through grade 12
Number of schools--37
District demographics—73% White; 18% African-American;
5% Hispanic; 4%
Other—Forty-eight percent of our students qualify for
free/reduced meals.
Located in a semi-rural section of North Carolina and home
to Camp Lejeune.
11. + Overview of Mobile Learning Initiative(s)
Why
When
Math & Science Skills Deficit
21st Century Skills (Globally Competitive)
Digital Divide
Student Assessment of Needs
January 2008 – Current
Target student populations
Expanded to target 10th, 11th and 12th grade students
Initial target was 9th grade students from schools with poor math scores and high percentages of their populations were socio-economically
disadvantaged.
Expanded to all 9th grade students across county.
Target subject areas (if applicable)
Initial target was algebra 1
Expanded to geometry,, algebra 2, pre-calculus, calculus and statistics
Devices
HTC 6800 Smartphone (Windows Mobile), Dell Netbooks, HTC EVO View Tablets (Android), Dell Laptops, Samsung Galaxy Note 2 (Android)
Instructional tools and content used
Project K-Nect, Andie Graph, BrainPop, Futures Channel and student and teacher developed curriculum,
12. +
Outcomes - Methodology
Pre and post surveys of students
Assessments of students’ prior skills
Focus groups with students and teachers
Interviews with administrators
Classroom observations
Benchmark with Speak Up data findings
Analysis of standardized test results
13. +
Outcomes - Findings
“The smart phone is like a teacher
in my pocket.”
Project K-Nect Student
“I can’t go back to the way I taught before
Project K-Nect.”
Project K-Nect Teacher
14. +
Outcomes - Findings
Mobile devices and 24/7 wireless access empower students to take
responsibility for their learning.
Students feel more comfortable with math and demonstrate higher
levels of math proficiency.
Students express increased interest in college and math related
degrees and careers.
Mobile devices have the power to change the way teachers think
about their teaching.
15. + Outcomes - Empower students to take responsibility for
learning
“I’ve become more patient and gained confidence getting to know other
people. It helped me with public speaking. I’ve learned its okay to be
wrong.”
“I’ve helped people when they had trouble and know they see me as an
expert. I thought I only knew the basics but I just picked up more as I help
people.”
“I’ve learned how to make a presentation – it feels good to know that your
classmates depend on you.”
“I’ve learned to be more trusting with others. There is a lot of teamwork in
the project – I’ve learned to trust and be more dependable.”
“I learn better when working with peers.”
“Be brave enough to ask questions.”
16. +
Increased comfort and success with
math
Figure 3: Algebra I students report increased
confidence in their math abilities
89%
76%
Motivated to learn math
83%
71%
Comfortable learning
math
72%
59%
Feel successful
61%
Math is easy
0%
29%
20%
40%
Beginning of semester
60%
80%
End of semester
100%
17. +
Increased comfort and success with
math
Student Achievement Onslow School District
2008-2009 School Year
0%
20%
40%
60%
80%
Al gebra I
Geometry
Al gebra II
Al gebra II
Geometry
Al gebra I
K-Nect Students
(SouthWest)
83%
90%
91%
K-Nect Students (Di xon)
81%
65%
93%
non K-Nect Students
70%
76%
66%
Di stri ct
75%
78%
70%
State
73%
73%
68%
K-Ne ct Stude nts (SouthWe s t)
K-Ne ct Stude nts (Di xon)
non K-Ne ct Stude nts
Di s tri ct
Sta te
100%
18. +
Proficiency on end of course
exams (Jan 2012 results)
90% of Algebra I students
100% of Algebra II students
19. +
Changes to Instruction
Project based learning design
Relationships with students
Incorporation of 21st Century Skills
24x7 Learning
Students teaching students (personalized learning communities)
20. + Key Success Factors
Connectivity at home and school
Professional development and ongoing support (ITF)
Adoption and acceptance by lead teachers
Mobile device management
Direct training provided to students
Communications with parents and caretakers
Student ownership of their learning process
21. +
Case Study #2 – Encinitas Union School
District
San Diego, California
22. +
District Profile – Encinitas
Total enrollment – 5,448
Grades served K – 6th Grade
Number of schools – 9 Schools
District demographics – 30% minority (primarily Latino),
12% English Learners.
3 Title 1 Schools, Community is middle to upper middle class
professional with pockets of poverty on west side of district.
All schools have been recognized as California
Distinguished Schools. District has been recognized at state
and national level for health and wellness programs and
environmental programs.
23. + Overview of Mobile Learning Initiative(s)
Why – 1) To engage learners; 2) To differentiate learning for all
students; 3) To incorporate global competencies and higher levels of
learning into curriculum.
When – Infrastructure (2009), All staff and student pilot programs
(2010), 4th-6th grade (2011), 3rd-6th grade (2012), K-6th grade (2013)
Target student populations – All (including EL and Special Education)
Target subject areas (if applicable) Creative tools, ELA, Math, Science
Devices – iPads (students), iPads and MacBook Pros (staff)
Instructional tools and content used – iWorks Suite, ST Math, Ten Marks,
Imagine Learning, MyOn Reader, Defined Stem, and other programs.
24. + Outcomes (Quantitative and Qualitative)
Academic Performance Indicator (API) at highest levels in
district history
7 of 9 schools currently nominated for CA Distinguished
School Award
Student, staff, and parent survey show high engagement in
learning and strong support of iPads and digital curriculum
Locally designed assessments show strong student learning
indicators
Digital curriculum new this year but will have data tracking
and progress monitors embedded
25. + Key Success Factors
Improved student engagement.
Ability to differentiate teaching and learning to each
individual learner.
Student ability to use collaboration, critical thinking, creative
thinking, and communication.
Parent access to individual student information and work
progress.
Staff engagement and willingness to try new tools and
instructional methodologies and pedagogies.
26. +
Case Study #3 – Houston Independent
School District
Houston, Texas
27. +
District Profile -- HISD
Total enrollment—210,000 students
Grades served—Pre-kindergarten through grade 12
Number of schools--282
District demographics—62% Hispanic; 26% AfricanAmerican; 8% White; 4% Other
Houston is the most diverse city in America.
Eighty-three percent of our students qualify for free/reduced
meals.
28. + Overview of Mobile Learning Initiative(s)
Why
When
All subject areas
Devices
All high school students
Target subject areas
We started this initiative in August of 2013 and be 1:1 at every high school in three years.
Target student populations
Improve student engagement by changing the instructional delivery model. PowerUp is not about giving students a
device. HISD is changing instructional delivery in such a way devices become enables in the learning process.
HP 9470m Elitebook
Instructional tools and content used
Discovery ED, ABC-CLIO, NearPod, Office 365, Edmodo, Learning Gizmos, VoiceThread, Animotoa, Movie Maker,
Voki, GoAnimate, Weebly, Wikispace, Padlet, Screen-O-Matic
29. + Outcomes (Quantitative and Qualitative)
Achievement
Attendance
Discipline
Teacher, Parent
and Student Survey
Professional Development Effectiveness
HISD has entered into a three year
agreement with a mobile learning research
institution to conduct an independent
evaluation of the PowerUP program.
30. + Key Success Factors
Our critical success factors will change with each subsequent
year of implementation. For year one here are our top 5 critical
success factors:
Digital Curriculum Readiness
Teacher Readiness (PD)
Campus Leadership Readiness (PD)
Technical and Instructional Support for Pilot Campuses
Technical Infrastructure / Configuration
32. +
MTLC’s Scope of Synthesis
Regional
Scope
National
Scope
Work in
progress
Encinitas
Federal
Communications
Commission
Countywide
technology audit
Solana Beach
Contextual
Review
Cajon Valley
Coronado
Digital
Promise
Literature Reviews
HISD
Implementation
33. +
What does Mobile Technology
Integrated Instruction look like?
Increased access to learning resources
Enhanced communication and feedback
Restructured teacher time
Extended purpose & audience for student work
Shifting teacher and student roles
34. +
Transformational Technology-infused
Instruction is out there.
High Quality
Instruction
• Not Universal
Technology
Integration
• 21st Century Skills
WHY
?
Transformative • EXISTS but it is
difficult to find
Instruction
35. +
Why so hard to find?
Context isn’t contained
The process is not linear
37. +
When Context Becomes a Barrier
Teacher practice is substantive, rather than transformational
Devices are used for behavior management rather than for
the development of the 4Cs
Learning opportunities are fragmented
38. +
Characteristics of Successful
Contextual Support
The stronger a teacher’s content knowledge, the better
they will integrate technology in that content area.
Good teaching is a
prerequisite to good
teaching with tech
All Teachers need instructional coaching &
access to best practice models
24/7 Access to PD
materials
Professional
Development can
be device agnostic
TIME
Yield = Tech. Integration with
Curriculum/Technology
Connections
Content-Specific
Strategies
Differentiated Learning
39. +
Policy Implications
We call for policy shapers to influence the context
Funds to support all leaders to support teachers
Training
Time to plan integration
Emphasize good instruction
Plan for short and long term adoption efforts
Circle back for those that don’t adopt immediately
It won’t all happen at once
Universal access
Be patient but don’t wait
It won’t happen overnight
Incorporate research into implementation