Downloaded 222 times


![ Batting average (Avg.):
The total number of runs divided by the total number of
innings in which the batsman was out.
Avg. = Runs/[I – NO]
Strike rate (SR):
The average number of runs scored per 100 balls faced.
SR = [100 * Runs]/BF)
Run rate (RR):
The average number of runs a batsman (or the batting
side) scores in an over of 6 balls.
Net run rate (NRR):
A method of ranking teams with equal points in limited
overs league competitions.](https://image.slidesharecdn.com/mathsstatistics-141217060411-conversion-gate02/85/Statistics-used-in-Cricket-15-320.jpg)


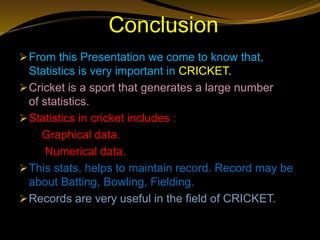


The document discusses statistics in cricket. It provides an overview of key statistical concepts like batting, bowling, and fielding statistics. It also summarizes important cricket statistics from the 2011 Cricket World Cup, including highest team totals, leading run scorers, top wicket-takers, and best bowling figures. Graphs are commonly used to present cricket statistics visually. The Association of Cricket Statisticians and Historians maintains historical statistics.