Recommended
PPTX
Introduction to statistics-lecture1AhmedSaadElsaeidy
PPTX
PDF
Unit-2-Lesson-4-Data-Management-2023.pdf
PPTX
STATISTICAL PROCEDURES (Discriptive Statistics).pptx
PPT
Introduction to Biostatistics_20_4_17.ppt
PPT
data_management_review_descriptive_statistics.ppt
PPTX
Introduction to Medical statistics_UG.pptx
DOCX
Slide Copyright © 2007 Pearson Education, Inc Publishi.docx
PPTX
Descriptive Statistics.pptx
PPTX
mathematics to the modern world PPTX presentation
PPTX
PPT
PPTX
PPT
PPT
PPT
Level 3 in engineering Basic Statistics.ppt
PPTX
STATkgchgfhghvv hgchchc hghgf 4 DSA.pptx
PDF
LESSON 4_UNGROUPED.pptx.pdf
PDF
PPTX
analytical representation of data
PPTX
Lecture 3 - Descriptive statistics Spring 2023.pptx
PPTX
PPTX
MMW (Data Management)-Part 1 for ULO 2 (1).pptx
PPTX
Statistics " Measurements of central location chapter 2"
PPTX
PPT
Basics of statistics by Arup Nama Das
PPTX
KASSAN KASELEMA. Lesson IV-D. Analysis2.pptx
PDF
OVERVIEW-OF-ASSESSMENT-OF-LEARNING-Copy.pdf
PPT
Multiplying & Dividing Monomials in algebraic expressions.ppt
PPTX
Importance of Water in our daily lives PP.pptx
More Related Content
PPTX
Introduction to statistics-lecture1AhmedSaadElsaeidy
PPTX
PDF
Unit-2-Lesson-4-Data-Management-2023.pdf
PPTX
STATISTICAL PROCEDURES (Discriptive Statistics).pptx
PPT
Introduction to Biostatistics_20_4_17.ppt
PPT
data_management_review_descriptive_statistics.ppt
PPTX
Introduction to Medical statistics_UG.pptx
DOCX
Slide Copyright © 2007 Pearson Education, Inc Publishi.docx
Similar to Statistics, quantitative and qualitative data
PPTX
Descriptive Statistics.pptx
PPTX
mathematics to the modern world PPTX presentation
PPTX
PPT
PPTX
PPT
PPT
PPT
Level 3 in engineering Basic Statistics.ppt
PPTX
STATkgchgfhghvv hgchchc hghgf 4 DSA.pptx
PDF
LESSON 4_UNGROUPED.pptx.pdf
PDF
PPTX
analytical representation of data
PPTX
Lecture 3 - Descriptive statistics Spring 2023.pptx
PPTX
PPTX
MMW (Data Management)-Part 1 for ULO 2 (1).pptx
PPTX
Statistics " Measurements of central location chapter 2"
PPTX
PPT
Basics of statistics by Arup Nama Das
PPTX
KASSAN KASELEMA. Lesson IV-D. Analysis2.pptx
PDF
OVERVIEW-OF-ASSESSMENT-OF-LEARNING-Copy.pdf
More from JoseTorres185927
PPT
Multiplying & Dividing Monomials in algebraic expressions.ppt
PPTX
Importance of Water in our daily lives PP.pptx
PPTX
Constructing pie chart manually using geometry set.pptx
PPT
Finding the Factors of Algebraic Terms.ppt
PPT
Rules on laws_of_indices with examples and solutions
PPT
Finding the Angle of Elevation and Depression
PPT
Multi-Step equations with fractions and decimals _1_ (1).ppt
PPTX
WJEC+Maths_Target+B_Algebra_Equations+and+Fractions+(Linear+equations+involvi...
PPT
Ordering and comparing fractions with like and unlike denominators
PPT
Factoring Polynomials using the difference of two squares2.ppt
PPT
Computer_Generations_lecture (1).ppt
Recently uploaded
PDF
APPSC APPSC Forest Draughtsman GS Question paper.pdf
PPTX
Reimagining Academic Library Services through Artificial Intelligence: A Case...
PDF
Unit Plan and Unit Test-pdf-Dr. Rajashekhar Shirvalkar, Principal, SMRS B.Ed ...
PDF
West Hatch High School - GCSE French Specification
PPTX
A brief introduction to Minor vegetable crops.pptx
PDF
APPSC APPSC AEE-AE GENERAL STUDIES QUESTION PAPER.pdf
PPT
West Hatch High School - GCSE History Option
PPTX
How to Track Team Performance Analysis in Odoo 18 Recruitment
PDF
Tetracycline Class of Antibiotics: SAR, MOA and Uses
PPTX
West Hatch High School - GCSE Media Studies
PPTX
West Hatch High School - GCSE Spanish Presentation
PPTX
A detailed notes on Conjugate Vaccine and its mechanism.
PDF
Radio Ceylon Prelims (An Indian Subcontinent Quiz).pdf
PDF
Darwinism: Theory of Natural Selection and Origin of Species
PPTX
Master of Punjabi Short Story "kartar singh duggal
PDF
RAIN, BMP, CURRENT, ESP 32, GAS, LINE, IR, JOYSTICK, LCD, LM35, SD, MOTION, P...
PDF
Types of Foot & Foot Modifications in Birds
PPTX
Guidelines for reporting social networks and personal networks data
PDF
Why Projects Fail – The Need to “Do the Right Project” and “Do the Project Ri...
PDF
Chapter 05 Drug Acting on CNS General Anasthetics.pdf
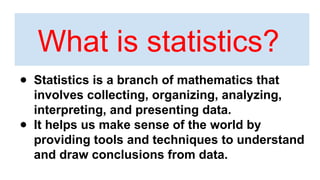
Statistics, quantitative and qualitative data 1. 2. 3. 4. What is statistics?
● Statistics is a branch of mathematics that
involves collecting, organizing, analyzing,
interpreting, and presenting data.
● It helps us make sense of the world by
providing tools and techniques to understand
and draw conclusions from data.
5. What is data?
Data is the collection of facts, such as numbers,
words, measurements, observations, or just
descriptions of things.
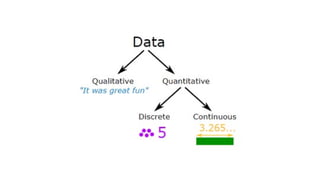
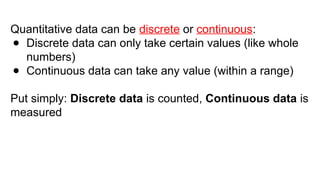
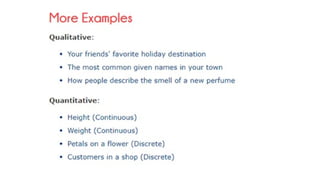
7. Quantitative data can be discrete or continuous:
● Discrete data can only take certain values (like whole
numbers)
● Continuous data can take any value (within a range)
Put simply: Discrete data is counted, Continuous data is
measured
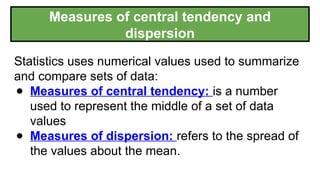
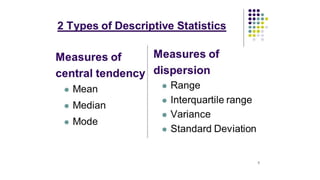
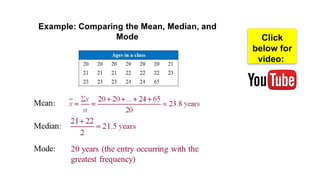
10. Measures of central tendency and
dispersion
Statistics uses numerical values used to summarize
and compare sets of data:
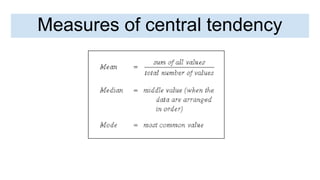
● Measures of central tendency: is a number
used to represent the middle of a set of data
values
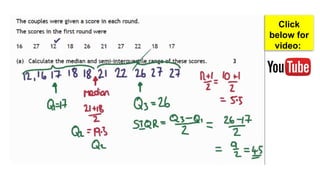
● Measures of dispersion: refers to the spread of
the values about the mean.
12. 13. 14.