This document appears to be a student project report submitted to a professor. It includes an executive summary, introduction, objectives, research methodology, sample details, questionnaire responses, data analysis, and conclusions. The analysis focuses on comparing smart phone and non-smart phone users. It finds that communicating with friends on social networks does not depend on other smart phone activities based on regression analysis. It also finds no significant differences in reading emails or searching for information based on education level using ANOVA tests.
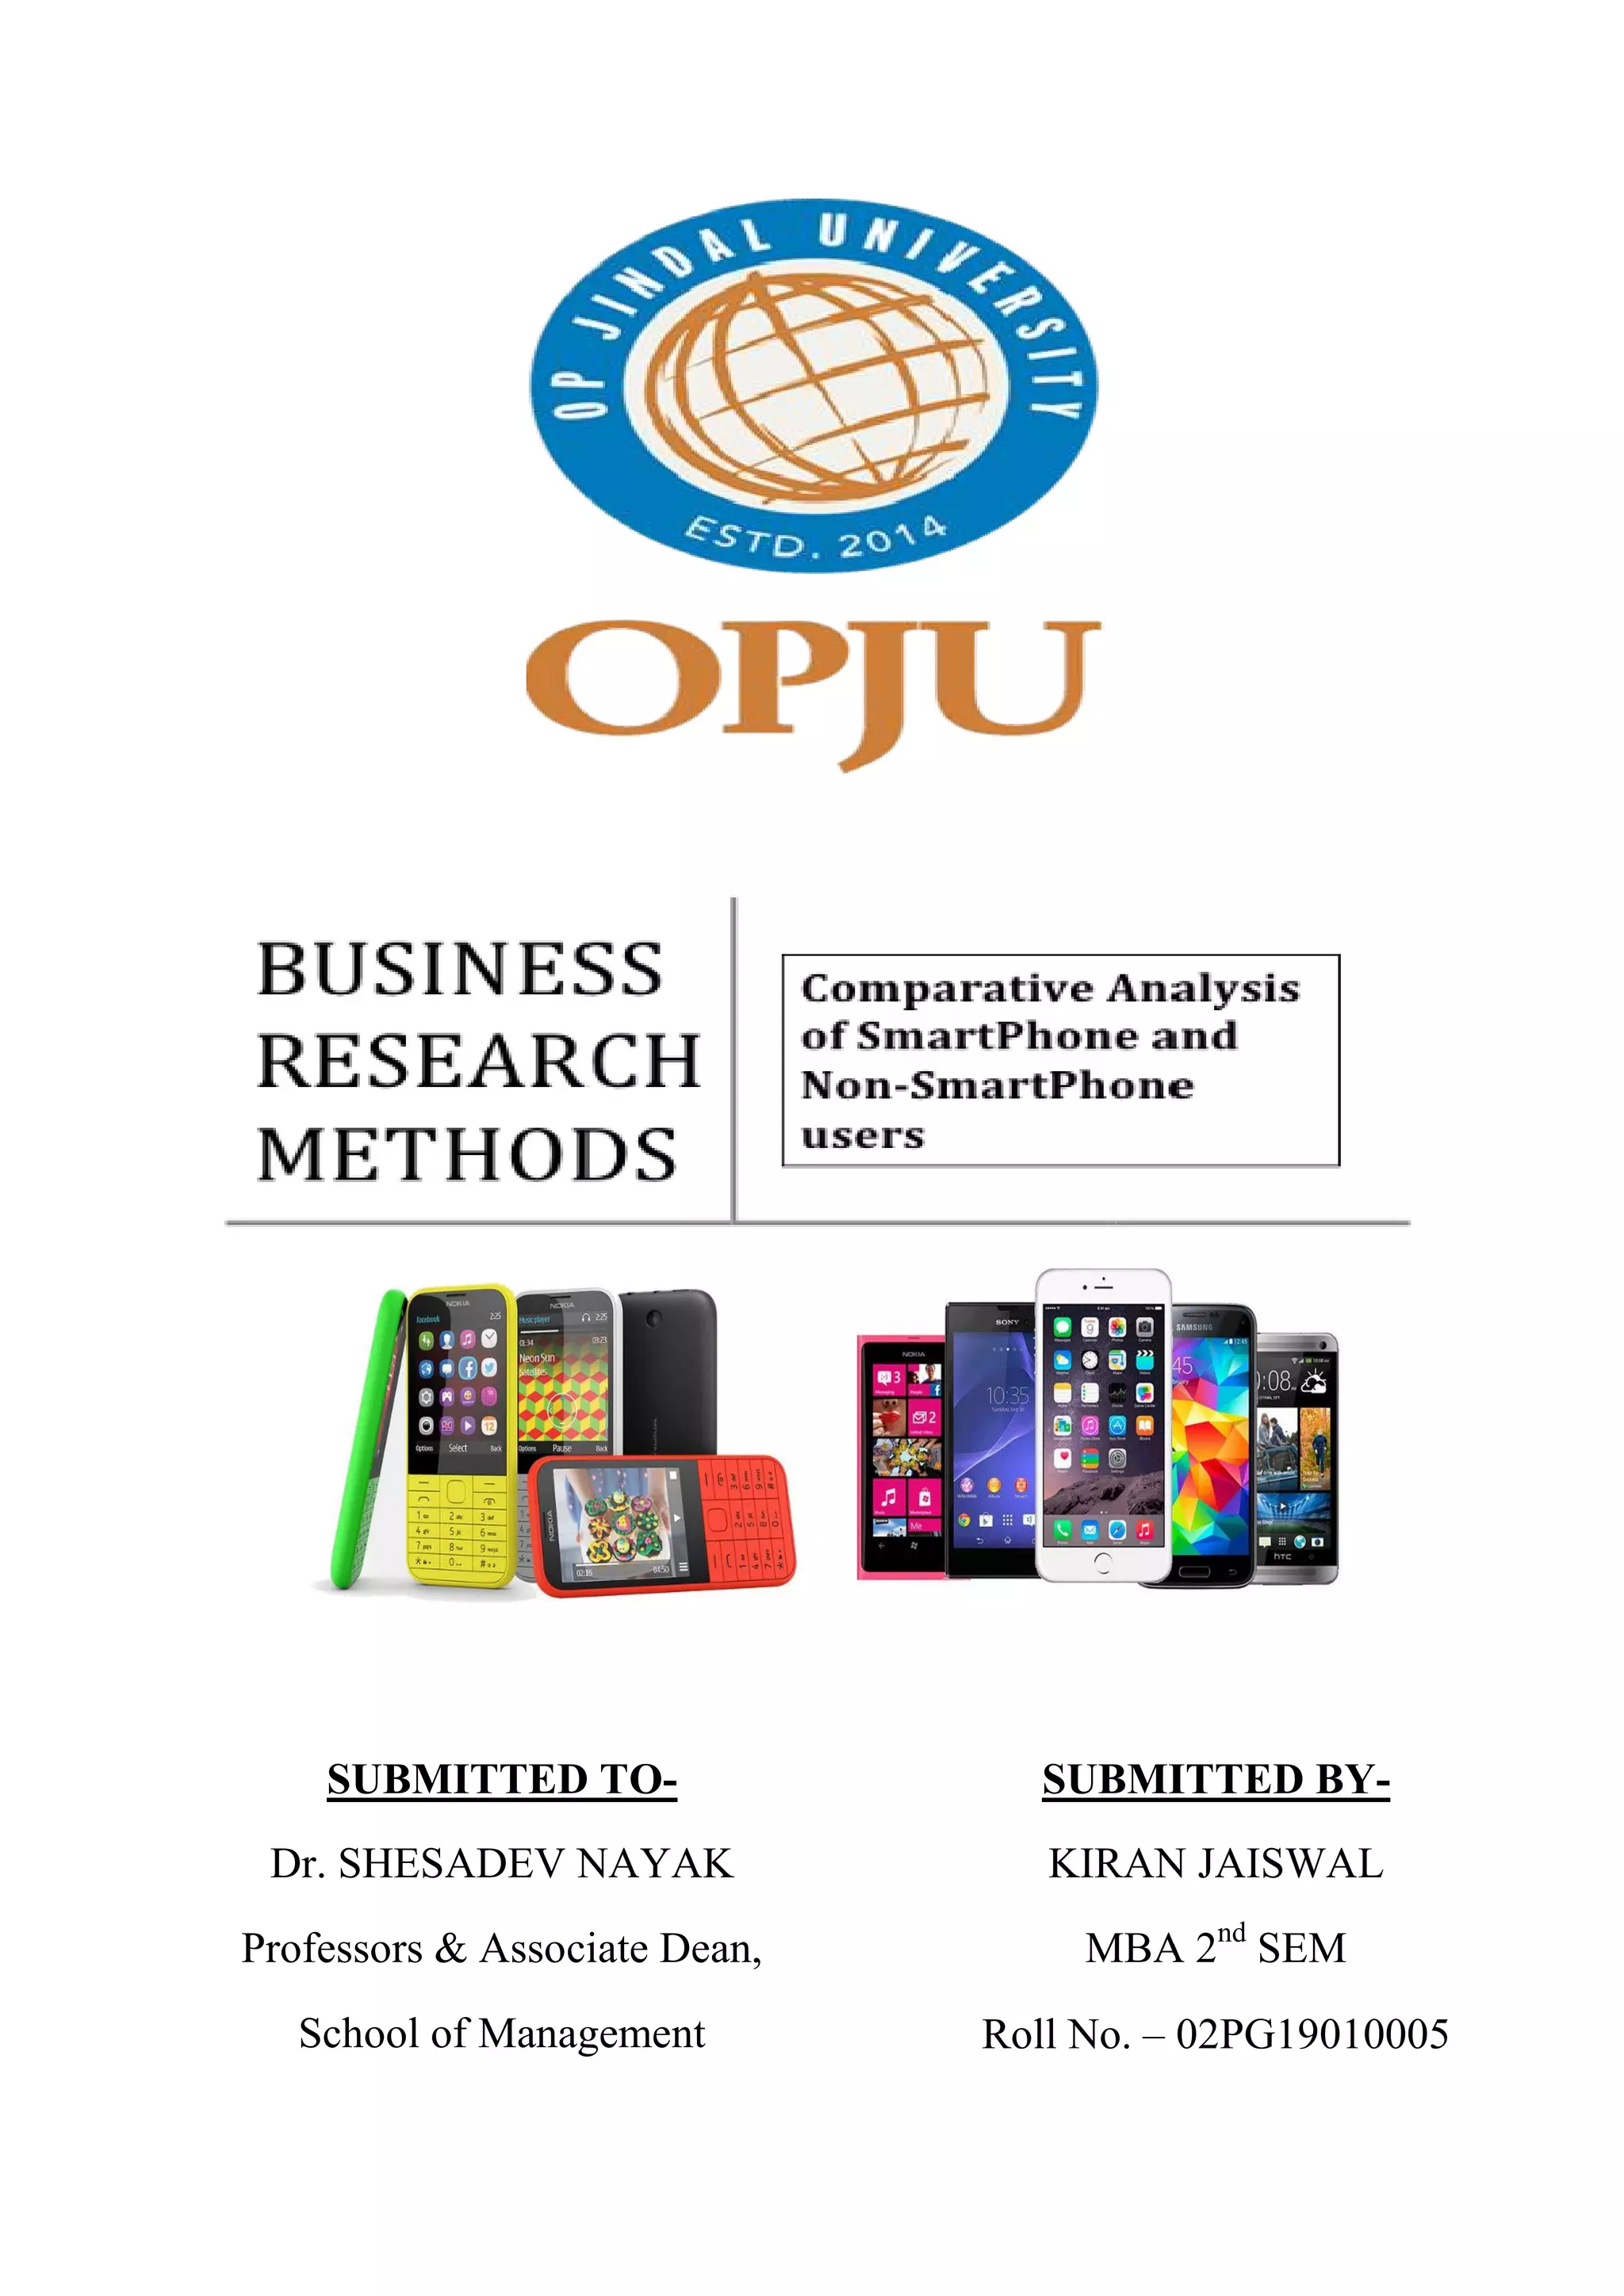


![DATA ANALYSIS AND HYPOTHESIS
Data Cleaning:
The observations who don’t use smart phones have been removed from the
Data.
Ordinal Scale data has been re-coded as given below:
Never=1, Seldom=2, Sometimes=3, Often=4
Multiple Regression Analysis:
Dependent Variable: Communication with friends on Social Network
Independent Variable: Playing Games, Viewing content on social network,
Listening to music, Reading e-mail, News, Weather forecasts, Watching Video
(Youtube), Searching for specific information, Talking on the phone
Ho [Null Hypothesis]: Communicating with friends on Social Network does not
depend on Playing Games, Viewing content on social network, Listening to music,
Reading e-mail, News, Weather forecasts, Watching Video (Youtube), Searching for
specific information, Talking on the phone
H1 [Alternate Hypothesis]: Communicating with friends on Social Network depends
on Playing Games, Viewing content on social network, Listening to music, Reading e-
mail, News, Weather forecasts, Watching Video (Youtube), Searching for specific
information, Talking on the phone
Output:
Model Summaryb
Model R R Square
Adjusted R
Square
Std. Error of the
Estimate
1 .779a
.606 .370 .451
a. Predictors: (Constant), Games, Viewing content on social network,
Listening to music, Reading e-mail, News, Weather forecasts, Watching Video
(Youtube), Searching for specific information, Talking on the phone
b. Dependent Variable: Communicating with friends on social networks
The R-Square of .606 indicates that 60.6% of the independent variables are explained
by the dependent variable.](https://image.slidesharecdn.com/brkiranjaiswal-200704120352/75/Business-research-kiran-jaiswal-10-2048.jpg)

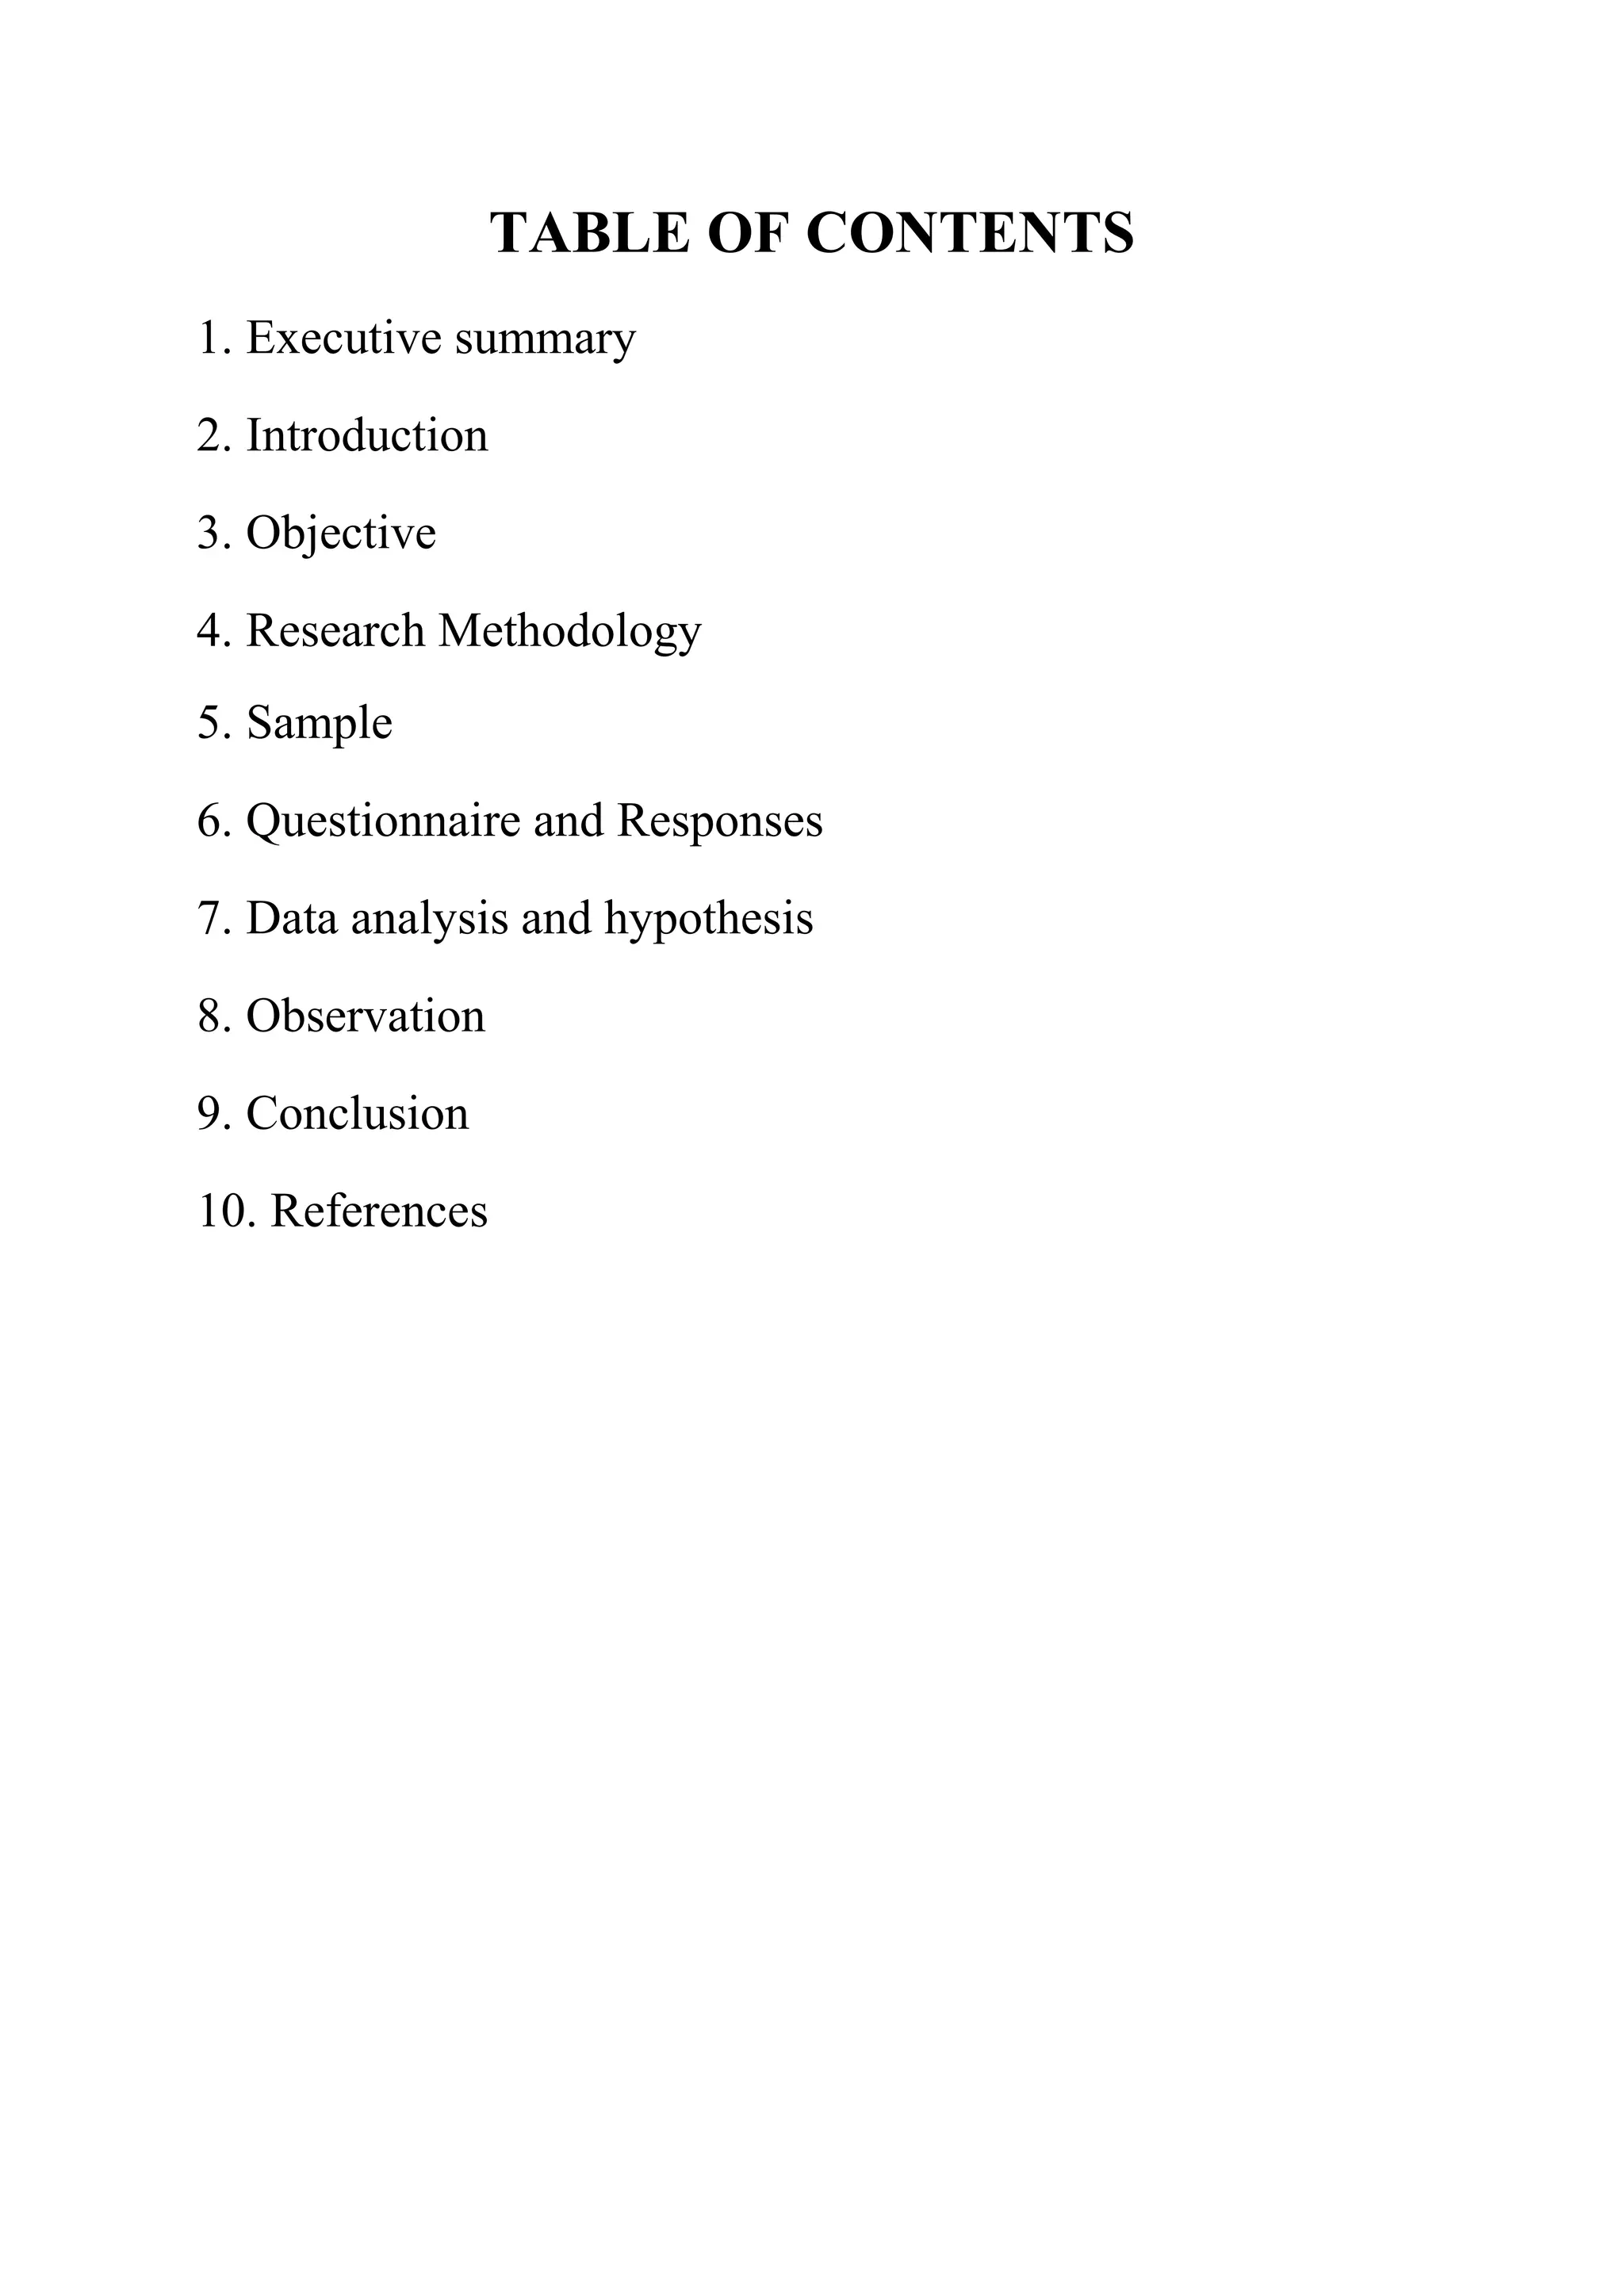
![ANOVA:
Dependent Variable: “ Reading Emails on Smart Phone” & “Searching for
Specific Information on smart phone”
Independent Variable: Different Education groups
Ho [Null Hypothesis]: There is no significant difference of Reading Emails on
Smart Phone among the different Education Groups.
Ha [Alternate Hypothesis]: There is a significant difference of Reading Emails on
Smart Phone among the different Education Groups.
Ho [Null Hypothesis]: There is no significant difference of Searching for specific
information on Smart Phone among the different Education Groups.
Ha [Alternate Hypothesis]: There is a significant difference of Searching for
specific information on Smart Phone among the different Education Groups.
Output:
ANOVA
Sum of Squares df Mean Square F Sig.
Reading e-mail Between Groups .266 3 .089 .188 .903
Within Groups 9.894 21 .471
Total 10.160 24
Searching for specific
information
Between Groups 1.399 3 .466 .777 .520
Within Groups 12.601 21 .600
Total 14.000 24
Conclusion:
The p-value of Reading Email .903 > 0.5 & Searching for specific information .520
>0.5 indicates that we have to accept the Null Hypothesis. Hence there is no
significant difference of Reading Emails & Searching for specific information on
Smart Phone among the different Education Groups.](https://image.slidesharecdn.com/brkiranjaiswal-200704120352/75/Business-research-kiran-jaiswal-12-2048.jpg)
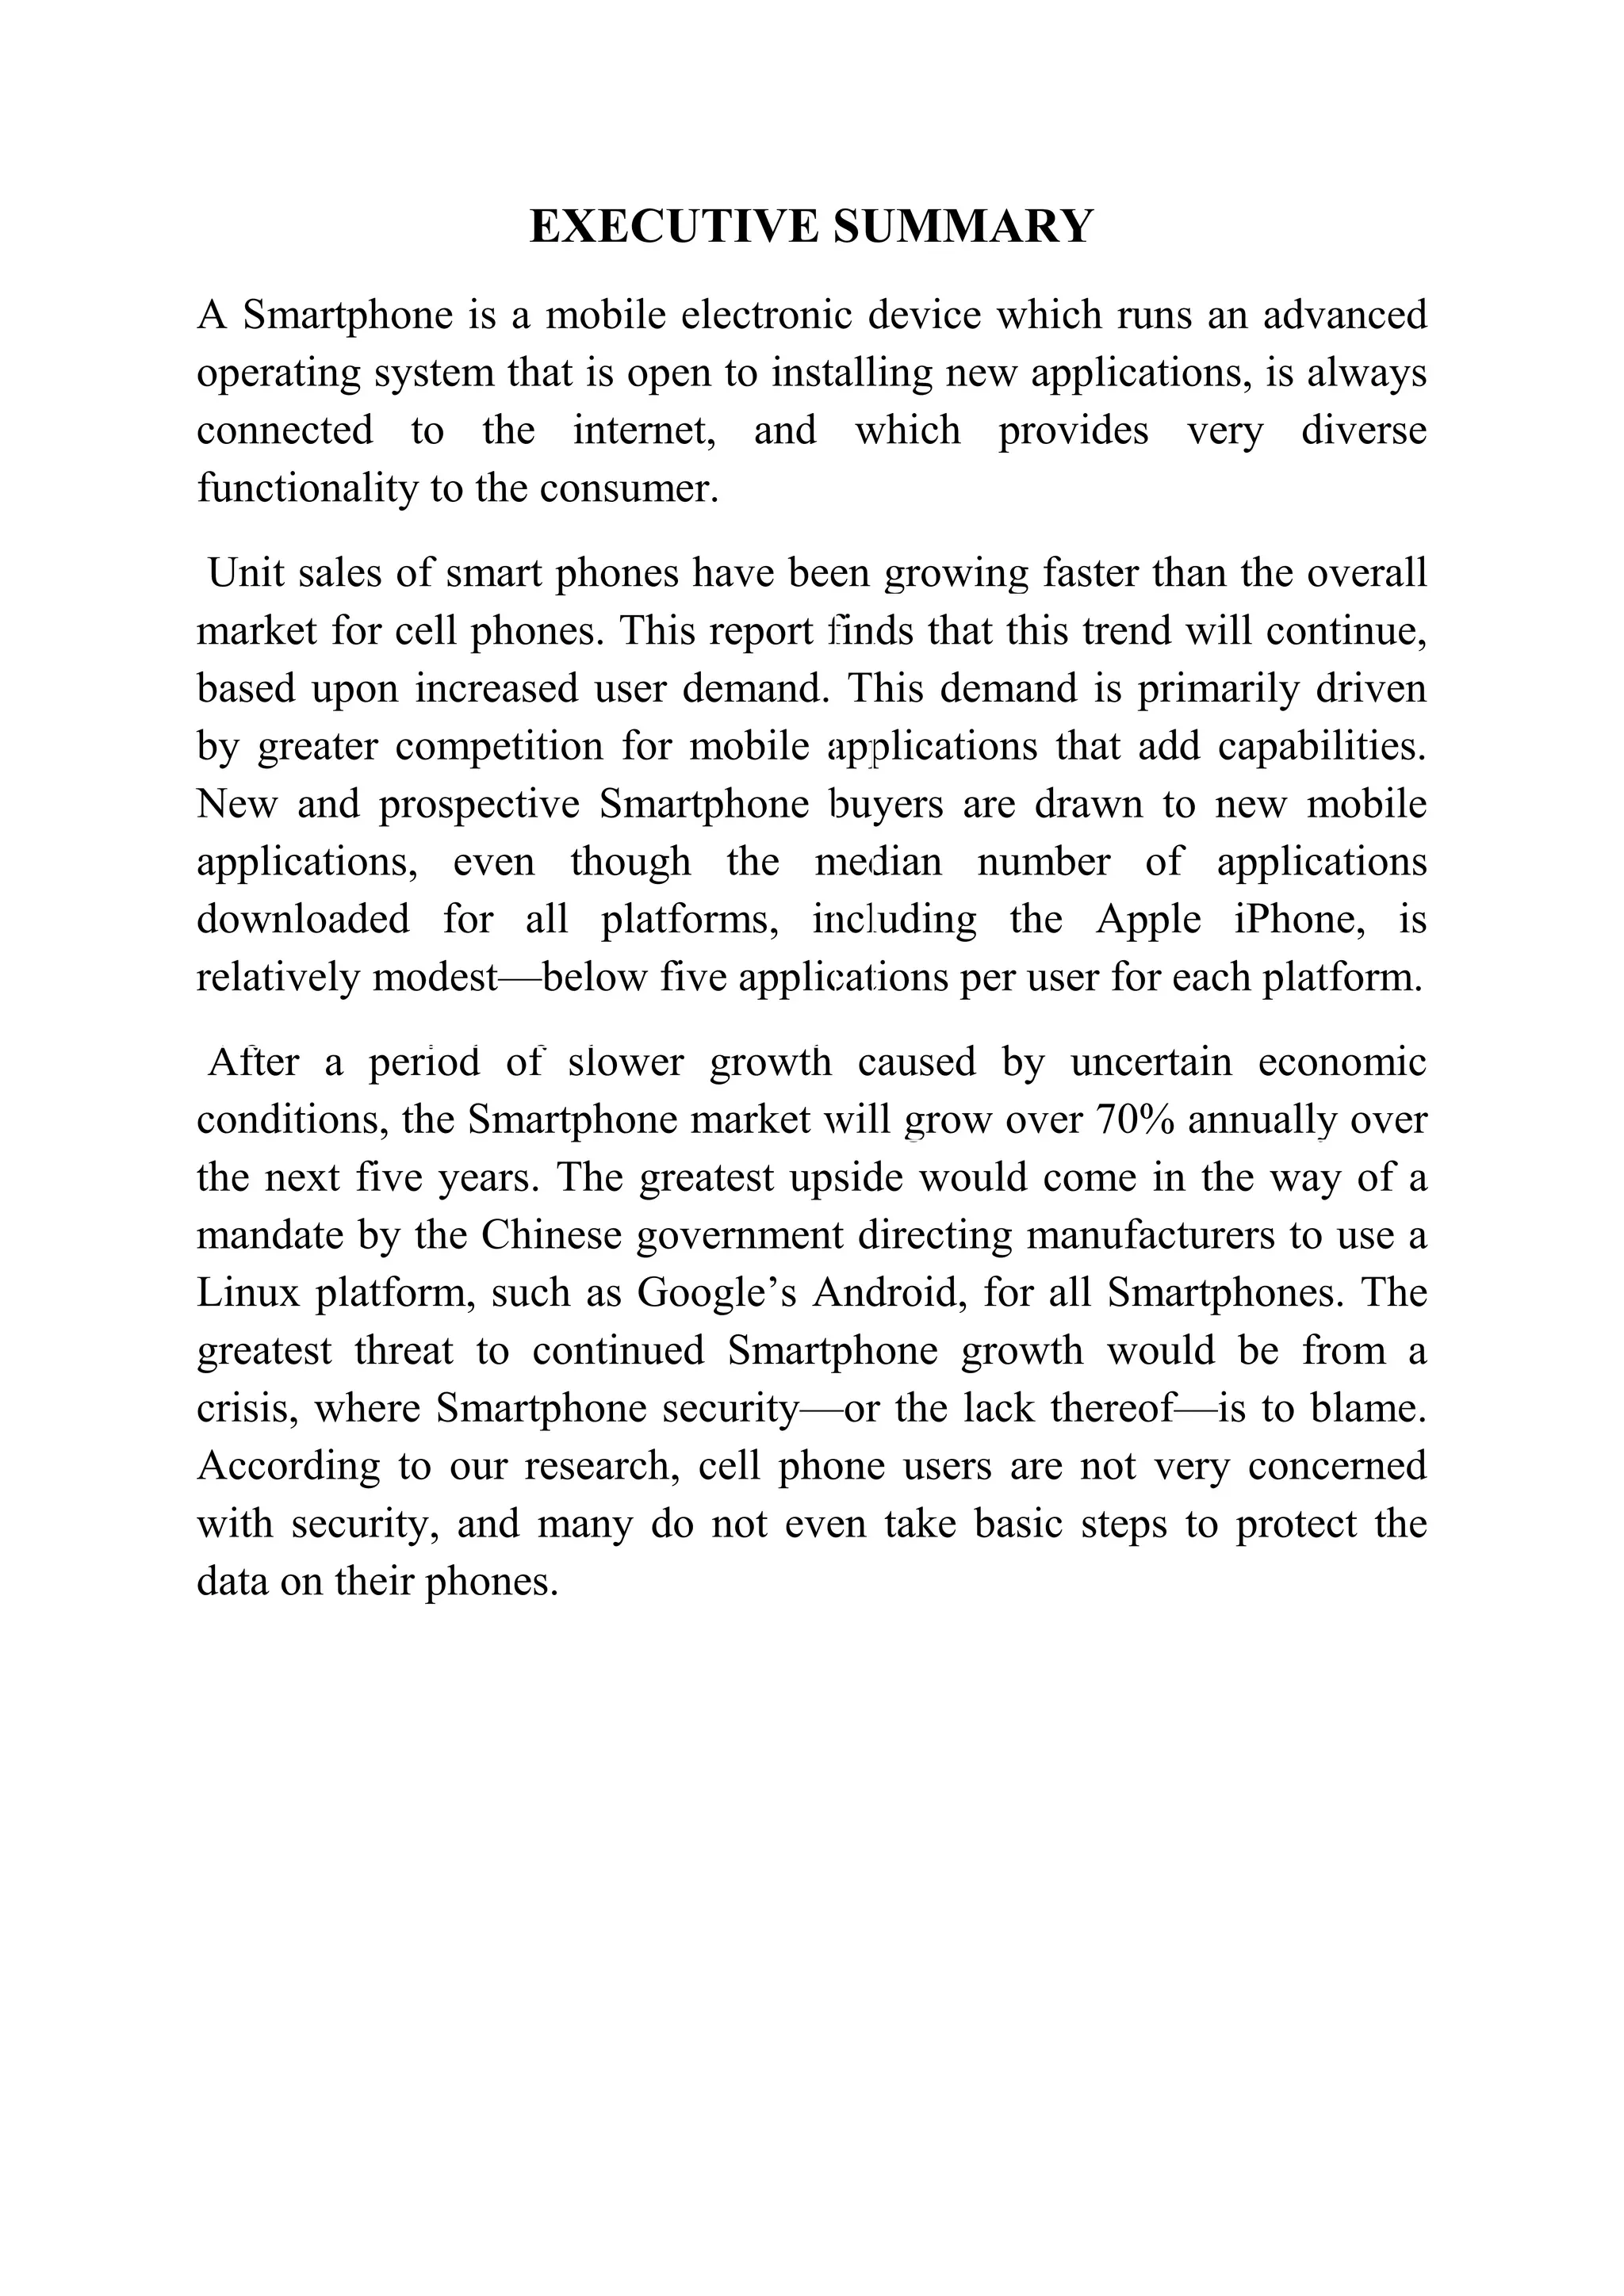
![ANOVA:
Dependent Variable: “ Reading News” & “Watching videos (Youtube)”
Independent Variable: Different Age groups
Ho [Null Hypothesis]: There is no significant difference of Reading News on Smart
Phone among the different Age Groups.
Ha [Alternate Hypothesis]: There is a significant difference of Reading News on
Smart Phone among the different Age Groups.
Ho [Null Hypothesis]: There is no significant difference of Watching Videos on
Smart Phone among the different Age Groups.
Ha [Alternate Hypothesis]: There is a significant difference of Watching Videos on
Smart Phone among the different Age Groups.
Output:
ANOVA
Sum of Squares df Mean Square F Sig.
News Between Groups .583 3 .194 .434 .731
Within Groups 9.417 21 .448
Total 10.000 24
Watching Video (Youtube) Between Groups .507 3 .169 .719 .552
Within Groups 4.933 21 .235
Total 5.440 24
Conclusion:
The p-value of Reading News .731 > 0.5 & Watching Videos .552 >0.5 indicates that
we have to accept the Null Hypothesis. Hence there is no significant difference of
Reading News & Watching Videos on Smart Phone among the different Age Groups.](https://image.slidesharecdn.com/brkiranjaiswal-200704120352/75/Business-research-kiran-jaiswal-13-2048.jpg)
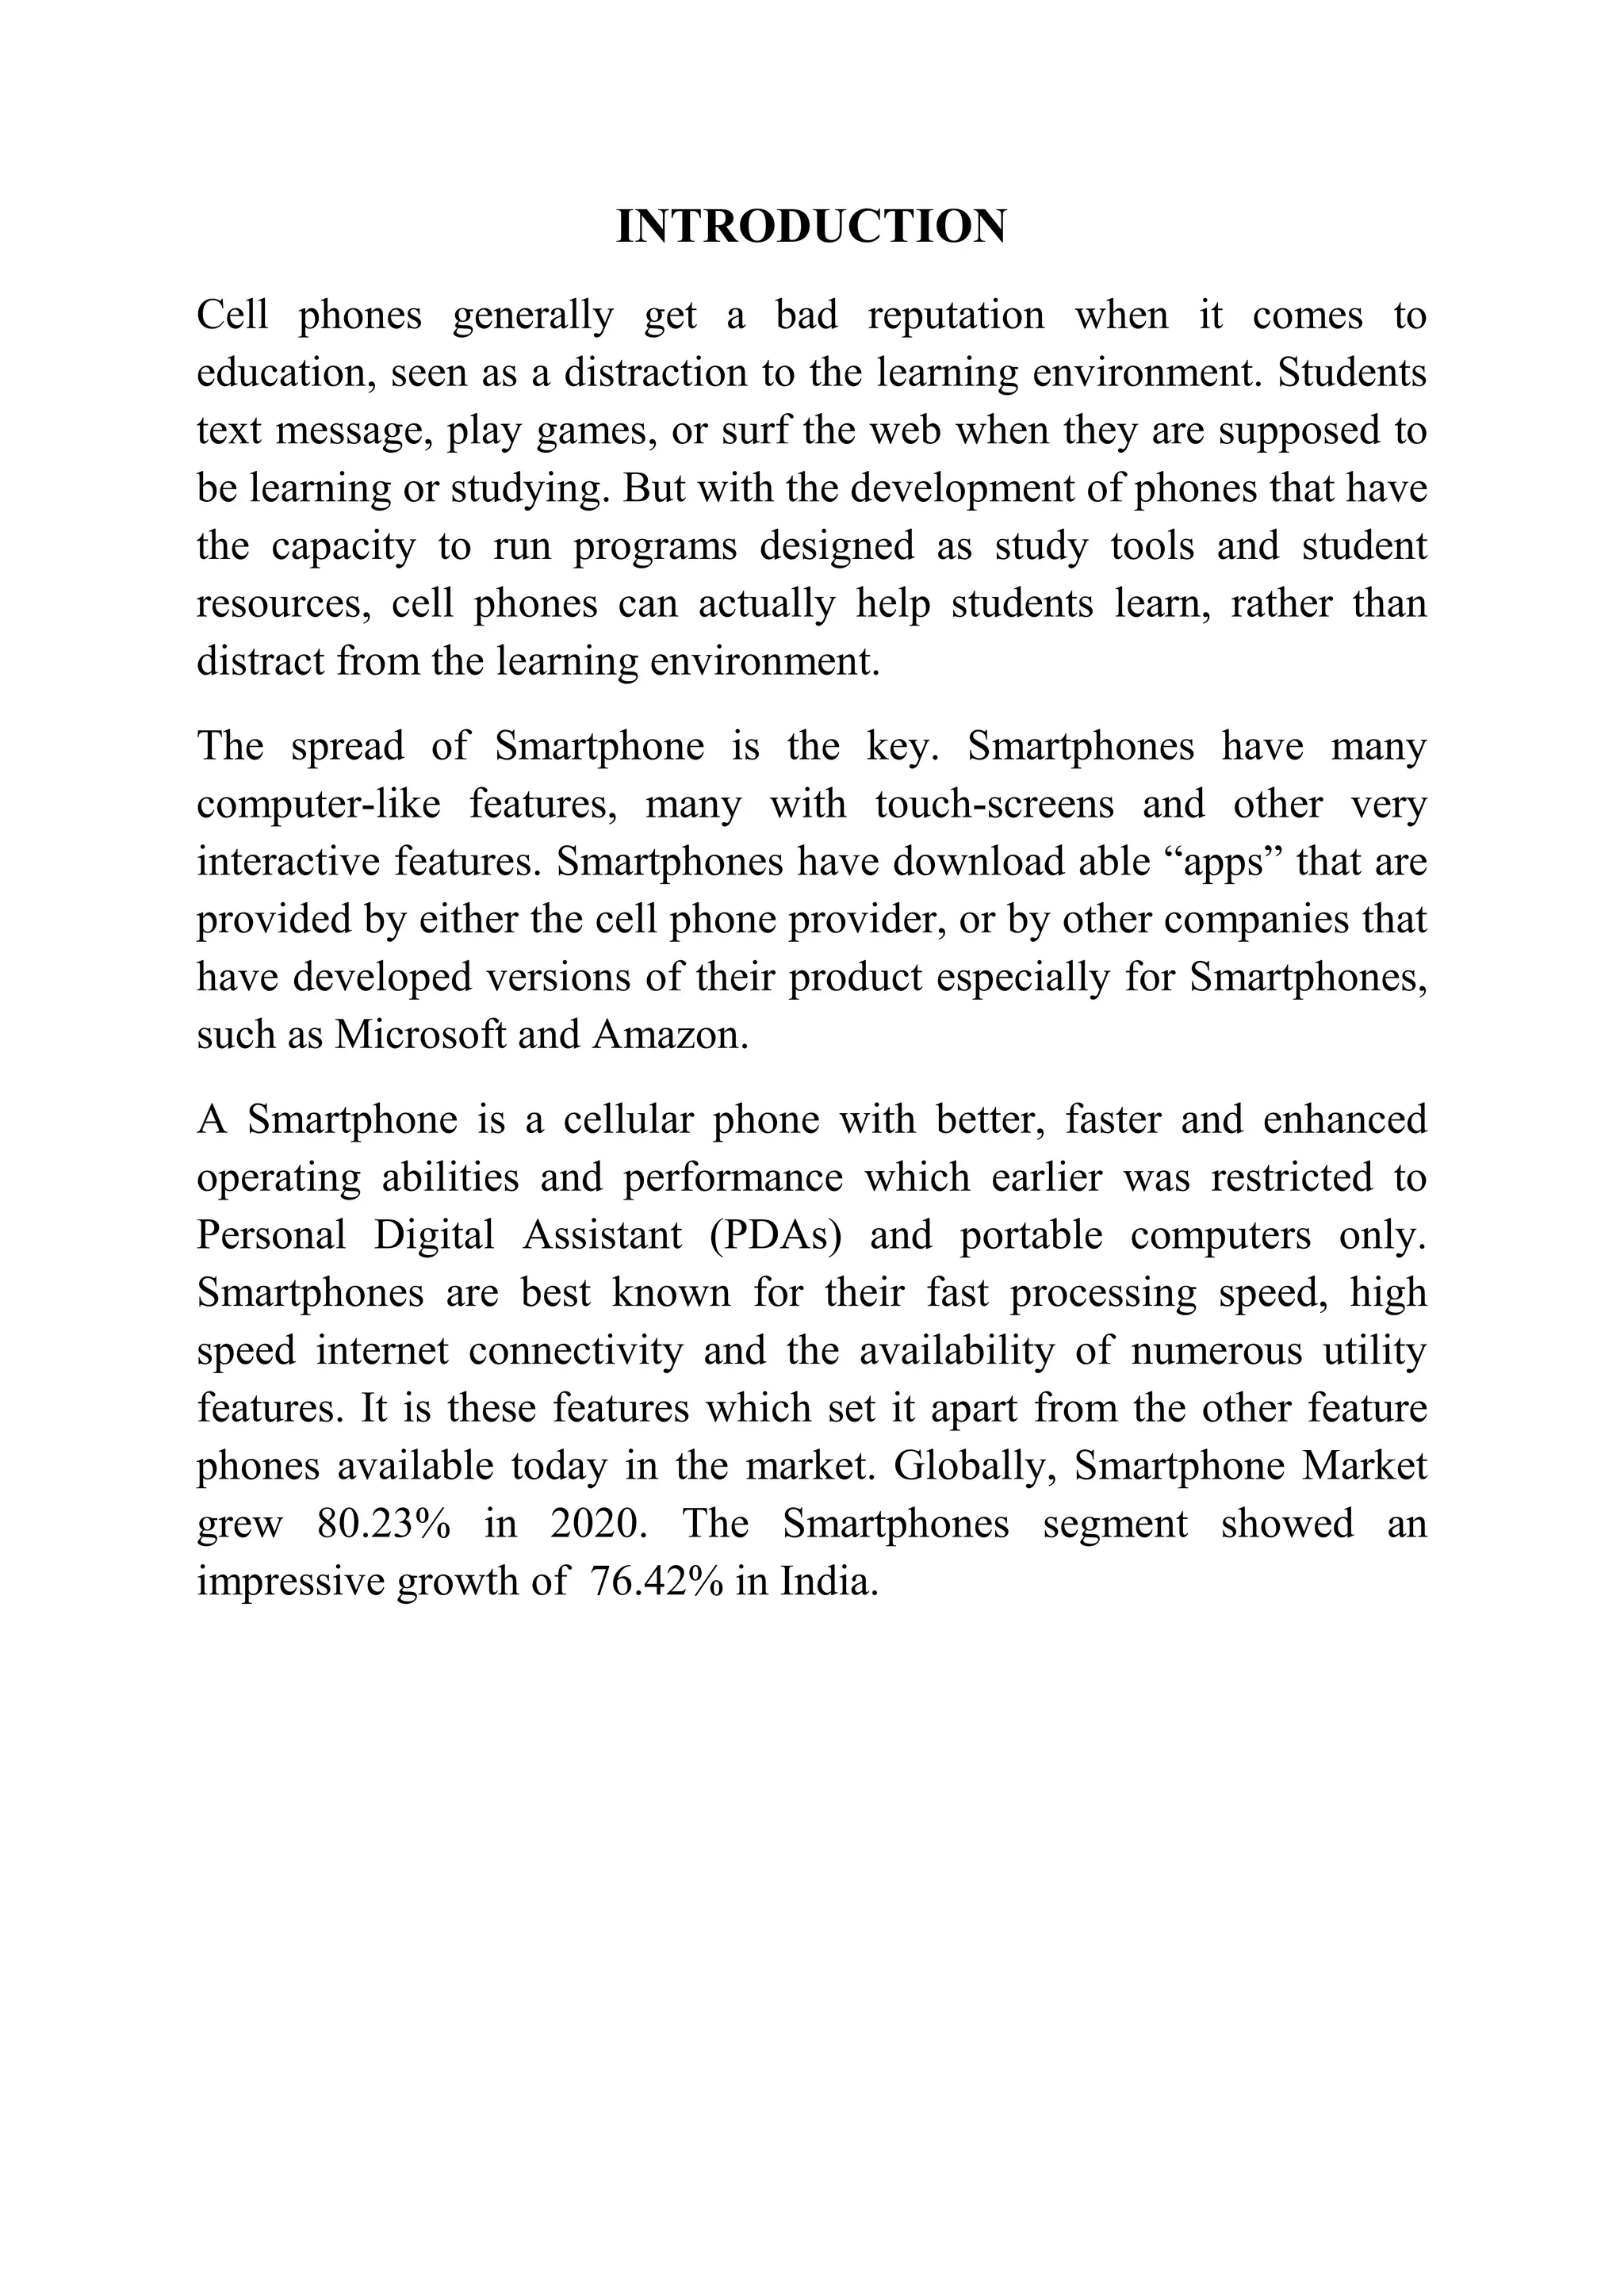
![ANOVA:
Dependent Variable: “ Listening to Music” & “Talking on Phone”
Independent Variable: Gender
Ho [Null Hypothesis]: There is no significant difference of Listening to Music
between Male & Female.
Ha [Alternate Hypothesis]: There is a significant difference of Listening to Music
between Male & Female.
Ho [Null Hypothesis]: There is no significant difference of Talking on phone
between Male & Female.
Ha [Alternate Hypothesis]: There is a significant difference of Talking on phone
between Male & Female.
Output:
ANOVA
Sum of Squares df Mean Square F Sig.
Listening to music Between Groups .006 1 .006 .018 .893
Within Groups 7.994 23 .348
Total 8.000 24
Talking on the phone Between Groups .103 1 .103 .238 .630
Within Groups 9.897 23 .430
Total 10.000 24
Conclusion:
The p-value of Listening to Music .893 > 0.5 & Talking on Phone .630 >0.5 indicates
that we have to accept the Null Hypothesis. Hence there is no significant difference of
Listening to Music & Talking on pone between Male & Female respondents.](https://image.slidesharecdn.com/brkiranjaiswal-200704120352/75/Business-research-kiran-jaiswal-14-2048.jpg)


![[DSC Europe 25] Kaja Kandare - LLM as a judge.pptx](https://cdn.slidesharecdn.com/ss_thumbnails/arxyccaxsdsd1ba99wjw-7-251212104007-2b4e3f64-thumbnail.jpg?width=640&height=640&fit=bounds)
![[DSC Europe 25] Bassam Maharmeh - Artificial Intelligence: Opportunities and ...](https://cdn.slidesharecdn.com/ss_thumbnails/thhfmr2fqpawzj7hsjpg-5-251211083048-2c23204f-thumbnail.jpg?width=640&height=640&fit=bounds)
![[DSC Europe 25] Hans Kleinsman - The Compliance Gearbox: How Tax Tech Mediate...](https://cdn.slidesharecdn.com/ss_thumbnails/dxdytie1toel0hr90bjs-2-251212103250-174fdbe7-thumbnail.jpg?width=640&height=640&fit=bounds)


![[DSC Europe 25] Dunja Adzic Jovanovic - AI and Cybersecurity: Defending Data ...](https://cdn.slidesharecdn.com/ss_thumbnails/o1zylpbhrtwnixxq2xj8-7-251211083048-185086f6-thumbnail.jpg?width=640&height=640&fit=bounds)


![[DSC Europe 25] Miodrag Pesovic & Vladislav Radonjic - Federated Data Archite...](https://cdn.slidesharecdn.com/ss_thumbnails/gsbe3y5it5uhndi4e08e-1-251212103249-f1008e0c-thumbnail.jpg?width=640&height=640&fit=bounds)
![[DSC Europe 25] Nikolay Burlutskiy - Best Practices for Building Enterprise M...](https://cdn.slidesharecdn.com/ss_thumbnails/uirvaiuvq8y1w8hzd9tx-7-251212103249-2619edb4-thumbnail.jpg?width=640&height=640&fit=bounds)


![[DSC Europe 25] Debmalya Biswas - Agentification: the art of transforming man...](https://cdn.slidesharecdn.com/ss_thumbnails/r5azlggvtqiaiiusrqdr-4-251212103249-5a12c89b-thumbnail.jpg?width=640&height=640&fit=bounds)
