The document contains analysis of shopping store data across 6 scenarios:
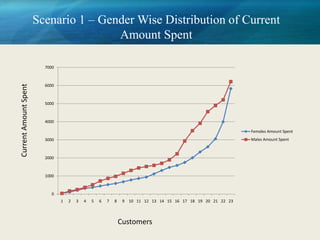
1) Gender-wise distribution of previous and current spending.
2) Comparative analysis of previous and current average spending.
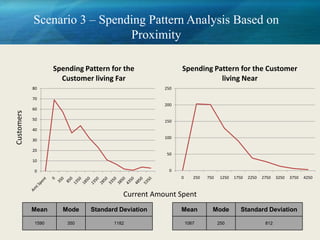
3) Spending patterns of customers living far vs near, and inferences.
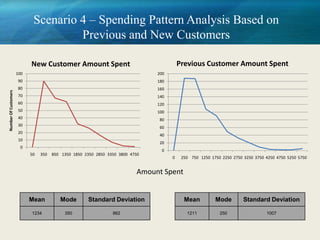
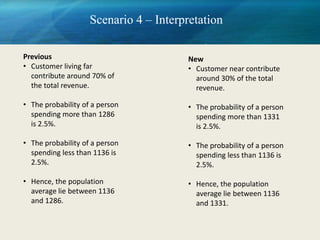
4) Spending patterns of new vs previous customers, and inferences.
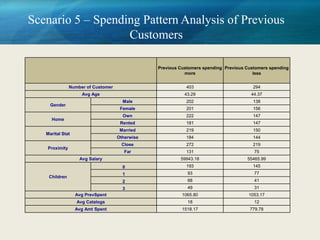
5) Analysis of previous customers spending more vs less based on demographics.
6) Spending patterns based on age groups and their mean previous, current spending.