
![Experienced Management Team
A M Naik K Venkataramanan M V Kotwal
Executive Chairman CEO & Managing Director President (Heavy Engineering)
BE [Mech] BE [Tech] – IIT, Delhi BE [Mech], Univ. of Bombay
Joined L&T in March 1965 Joined L&T in June 1969 Joined L&T in October 1968
Diverse experience in Vast experience in product Vast experience in Heavy
general management, engineering and project Engineering business
Technology and E&C management including manufacture of
critical equipment for
Nuclear Power & Space
Research Program
S. N. Subrahmanyan
Sr. Executive Vice President R Shankar Raman
Shailendra Roy
(Construction) Chief Financial Officer
Sr. Executive Vice President
B.SC ENGG (CIVIL), MBA B.Com, ACA, CWA – Power Development
(Finance) Joined L&T Group in Business & Corp. Affairs
Joined L&T in November November 1994 BE (Tech)
1984 Vast experience in Finance, Joined L&T in 2004
Vast experience in Taxation, Insurance, Risk
Vast experience in
Design, Engineering Management, Legal and
Thermal Power Business
and Construction Industry Investor Relations
9](https://image.slidesharecdn.com/lt20investor20presentation20-20feb202013-130218082551-phpapp01/85/L-t-20-investor-20presentation-20-20feb-202013-9-320.jpg)
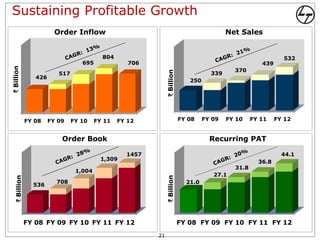
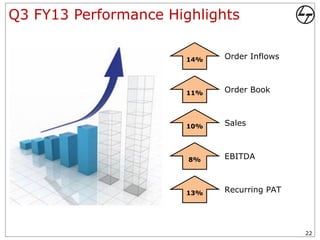
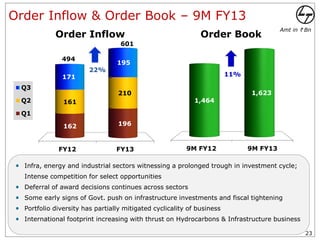
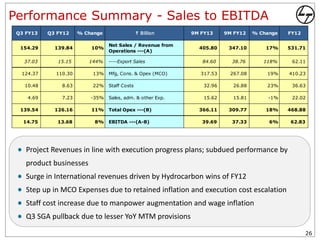
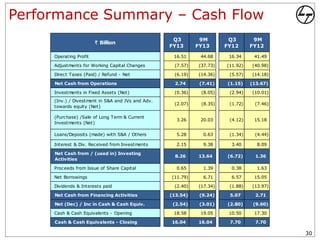
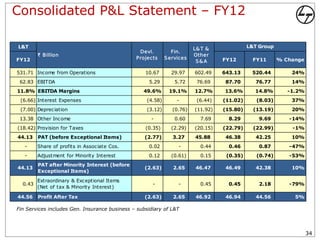
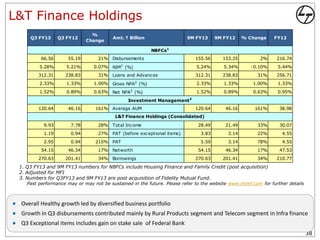


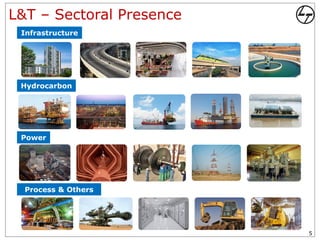
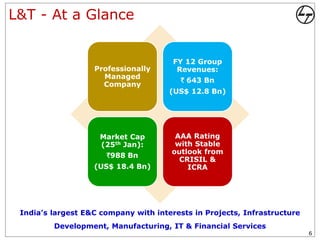
- Larsen & Toubro Limited (L&T) is an Indian multinational engaged in technology, engineering, construction, manufacturing and financial services with global operations. - In Q3 FY13, L&T reported order inflows growth of 14% and order book growth of 11% compared to same period last year. Net sales grew 10% while EBITDA grew 8% for Q3 FY13. - For 9M FY13, order inflows were up 22% at Rs. 601 billion while order book was up 11% at Rs. 1,623 billion compared to same period last year. Net sales grew 17% to Rs. 405.80 billion for 9M


