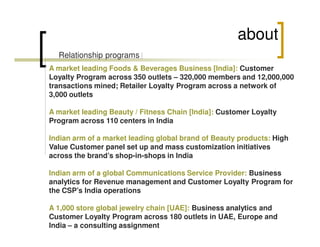
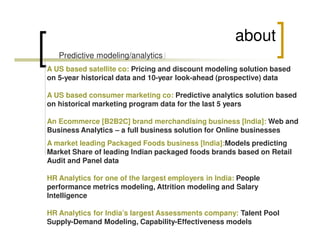
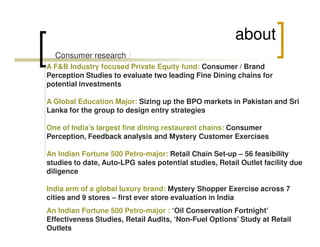
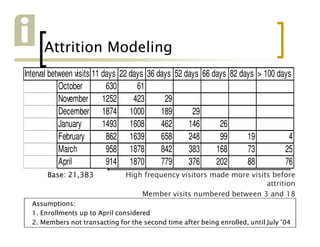
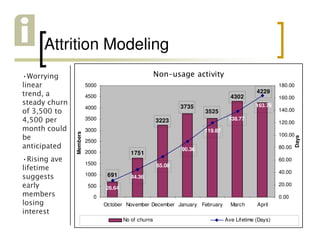
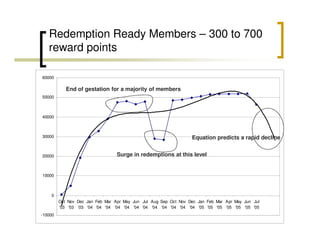
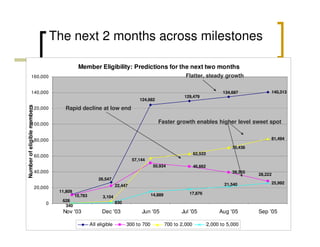

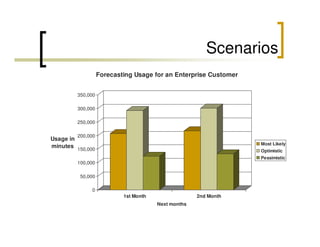
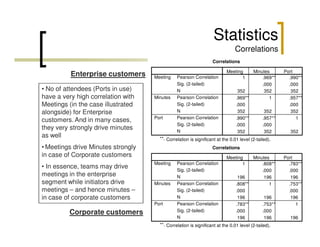
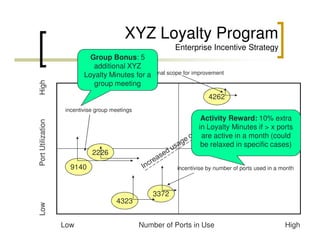

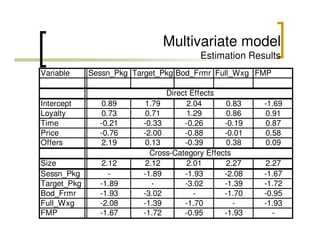

This document contains summaries of various analytics projects conducted by inTouch analytics for clients across multiple industries: - Customer loyalty and retail programs for food/beverage, beauty, communications, and jewelry companies involving customer segmentation, attrition modeling, and redemption predictions. - Predictive modeling for pricing, marketing program performance, and people/talent analytics for various businesses. - Consumer research, mystery shopping, and retail audits for restaurants, education, petroleum, and luxury brands. - Descriptive analytics including customer profiling and segmentation for a food/beverage loyalty program with over 350,000 members. - Revenue management analytics and usage forecasting for a global communications service provider.


