1. Statistics plays an important role in research by enabling researchers to extract meaningful information from data in the presence of variability.
2. The most important time for a statistician to be involved is in the beginning of a study to help design the experiment and ensure the data collection will provide the necessary information.
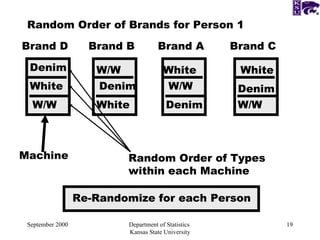
3. Properly designing the experiment through treatment structure, design structure, and randomization is critical for obtaining unbiased and informative results through statistical analysis.


![Quality Initiatives Iso 9001 2000[1]](https://cdn.slidesharecdn.com/ss_thumbnails/qualityinitiativesiso900120001-100227095532-phpapp02-thumbnail.jpg?width=640&height=640&fit=bounds)


