SlideShare a Scribd company logo
Multivariable Analysis Report
A. METHODOLOGY
1. Descriptive analysis of mean, standard deviation, Kurtosis and Skewness tests.
2. Reliability of all subscales of Cultural Intelligent Scale (CGS) and Individual Motivation for
Study Abroad (IMSA).
3. Exploratory Factor Analysis (EFA) of Cultural Intelligent Scale (CGS) and Individual Motivation
for Study Abroad (IMSA).
4. Paired sample T-test to determine whether there is a significant difference between two set
of means: male vs female (gender), undergraduate vs graduate programs (Study Level) in
term of Cultural Intelligence and Motivation for Study Abroad.
5. One-way ANOVA to determine whether three groups: business & economics vs engineering
and others of the factor “major” is equal in term of Cultural Intelligence and Motivation for
Study Abroad.
6. Two-way ANOVA to determine whether there is a significant interaction between gender &
study level, gender & major, study level & major in term of Cultural Intelligence and
Motivation for Study Abroad and the main effects of the factors.
7. Multiple linear regression to test effect of Cultural Intelligent Scale on Individual Motivation
for Study Abroad.
B. RESULTS
I. Descriptive Analysis
The descriptive statistics showed in Table 1 provide details of mean, standard deviation as well as
normally distribution test statistics (Skewness and Kurtosis tests) for the independent and
dependent variables of the study.
Mean Std. Deviation Skewness Kurtosis
Gender 1.52 .503 -.074 -2.044
Stu_Level 1.24 .430 1.234 -.490
Major 2.63 1.266 .004 -1.722
MC1 5.71 1.293 -1.834 3.687
MC2 5.98 .962 -2.222 8.640
MC3 5.73 1.138 -1.595 2.988
MC4 5.48 1.319 -1.576 2.712
COG1 4.98 1.414 -.991 .937
COG2 5.10 1.503 -1.073 .683
COG3 5.11 1.423 -.742 .195
COG4 4.70 1.454 -.747 .113
COG5 4.60 1.456 -.730 .170
COG6 4.86 1.458 -.880 .489
MOT1 5.93 1.068 -1.760 5.165
MOT2 5.25 1.286 -1.229 2.524
MOT3 5.53 1.272 -.980 .696
MOT4 5.35 1.214 -.833 .534
MOT5 5.33 1.389 -1.195 1.212
BEH1 5.14 1.474 -.957 .584
BEH2 5.16 1.302 -.944 1.039
BEH3 5.13 1.276 -.651 .203
BEH4 5.39 1.314 -.917 .188
BEH5 5.35 1.401 -1.170 1.276
CRM1 5.76 1.478 -1.382 1.220
CRM2 5.34 1.610 -1.163 .566
CRM3 5.14 1.712 -.963 .102
CRM4 5.42 1.631 -.954 -.037
URM1 5.06 1.803 -.910 -.220
URM2 5.05 1.873 -.744 -.672
URM3 5.48 1.282 -.831 -.236
SRM1 3.93 2.315 .030 -1.588
SRM2 3.11 2.263 .606 -1.173
CARM 4.16 2.239 -.241 -1.479
II. Reliability
Reliability of all subscales of Cultural Intelligent Scale (CGS) and Individual Motivation for Study
Abroad (IMSA) is tested using Cronbach’s alpha index. Tab. 2 lists all of the Cronbach’s alpha index
values.
Subscale Cronbach’s alpha
MC .857
COG .916
MOT .858
BEH .932
CRM .812
URM .810
SRM .825
CARM
Table 2 reveals that all the subscales of the Cultural Intelligent Scale and Individual Motivation for
Study Abroad Scale are acceptable (Cronbach’s alpha > 70). This result indicates that all sets of
variables are consistent and reliable.
III. Exploratory Factor Analysis (EFA)
Exploratory Factor Analysis (EFA) is used to examine the underlying structure of Cultural Intelligent
Scale (CGS) and Individual Motivation for Study Abroad (IMSA) and deduct the variables if needed.
1. EFA for Cultural Intelligent Scale (CQS)
Firstly, Exploratory Factor Analysis is applied to Cultural Intelligent Scale (CQS)
In order to test if the data is appropriate for factor analysis or not, Kaiser-Meyer-Olkin Measure of
Sampling Adequacy (KMO) and Bartlett’s Test of Sphericity results are examined. Accordingly, KMO
value is found out as .87, and the result of Bartlett’s Test of Sphericity is [χ2=1426.271; df=190;
p<.00] also found out to be meaningful. These values show that the data is appropriate for EFA.
Then, Varimax orthogonal rotation method is used to examine the factor structure of Cultural
Intelligence Scale. In the analysis, in order to decide which items are appropriate for the scale, the
threshold value for factor loadings is accepted as .50. In addition, for items having high loadings in
more than one factor, the variance between them is accepted to be at least .10. It is decided that
items not providing these requirements would be discarded.
At the end of the first factor analysis, items are loaded under 4 factors in which the eigenvalues are
greater than 1.0. This structure explains 71.9% of the total variance. Therefore, the four-factor
structure is considered to be appropriate for the scale.
According to the Varimax orthogonal rotation results, 1 item (MOT2) is discarded due to being not
coherent with the other items in the same factor. Moreover, 1 item (COG1) having high loadings in
more than one factor is also discarded.
After discarding two items, the analysis is run again. Correspondingly, KMO value is found out as .85
and the result of Barlett’s Test of Sphericity (χ2 = 1092,27, df= 153, p<.000) is found out to be
meaningful.
As the result of analysis, the four-factor structure is accepted with Factor 1: Behavioral Cognitive
(BEH, factor loadings are between .743 and .844, explains 46.59% of the variance), Factor 2:
Cognitive (COG, factor loadings vary from .631 to.866, explains 12.64% of the variance), Factor 3:
Metacognitive (MC, factor loadings are between .591 and .841, explains 8.31% of the variance), and
Factor 4: Motivation Cognitive (MOT, factor loadings range from .579 to .795, explains 5.88% of the
variance). All factors as a whole account for 73.427% of the total variance.
Table 2. Results of EFA on CGS.
Component Variance Explained
(%)BEH COG MC MOT
MC1 .284 .045 .808 .044
MC2 -.080 .186 .841 .107 8.31
MC3 .236 .266 .717 .274
MC4 .070 .417 .591 .269
COG2 .277 .711 .417 .083
COG3 .129 .763 .350 .120
COG4 .201 .866 .233 .156 12.65
COG5 .205 .800 .087 .194
COG6 .261 .631 -.142 .498
MOT1 .244 .256 .283 .579
MOT3 .402 .162 .128 .717 5.88
MOT4 .204 .090 .201 .795
MOT5 .439 .277 .125 .635
BEH1 .834 .160 .246 .180
BEH2 .844 .183 .243 .156
BEH3 .795 .294 .029 .303 46.59
BEH4 .816 .244 .020 .297
BEH5 .743 .094 .050 .269
Total 73.427
2. EFA for Individual Motivation for Study Abroad (IMSA) scale.
Firstly, Exploratory Factor Analysis is applied to Individual Motivation for Study Abroad scale.
After computing, the result of KMO value is .821, and Bartlett’s Test of Sphericity value is
[χ2=368.817; df=45; p<.000], which is meaning and the IMSA is appropriate to run EFA.
Accordingly, items are extracted with fixed 4 factors. This four-factor structure explains 77.04% of
the total variance.
According to the Varimax orthogonal rotation results, three items are removed from the structure
which are CRM3, CRM4 and URM3 because their loadings are not coherent with the other items in
the same factor.
After removing these items, the analysis is repeatedly conducted. the result of KMO value is .764,
and Bartlett’s Test of Sphericity value is [χ2=241.684; df=21; p<.000], which is still appropriate.
The four-factor structure of IMSA now explains 87.11%of the total variance. The structure includes
Factor 1: University-related Motivation with factor loading range from .867 to .893 (explains 49.44%
of the variance), Factor 2: Social-related Motivation with loadings of .866 to .879 (explains 19.44% of
the variance), Factor 3: Culture-related Motivation (CRM) with factor loadings varying from .812
to .856 (explains 10.52% of the variance), Factor 4: Career-related Motivation with loading of .895
(explains 7.71% of the variance).
Table 3. Results of EFA on IMSA.
Component Variance Explained
(%)URM SRM CRM CARM
CRM1 .206 .243 .856 -.036
10.52
CRM2 .326 .035 .812 .212
URM1 .867 .128 .286 .142
49.44
URM2 .893 .148 .235 .083
SRM1 .261 .879 .147 .124
19.44
SRM2 .021 .866 .130 .293
CARM .173 .354 .104 .895 7.71
Total 87.11%
IV. T-test
Paired sample T-test was computed to determine whether there is a significant difference between
two set of means: male vs female (gender), undergraduate vs graduate programs (Study Level) in
term of Cultural Intelligence and Motivation for Study Abroad.
According to the results of paired sample t-test analysis, there is no Gender difference and Study
Level difference in the dependent variables of Cultural Intelligence and Motivation for Study Abroad
scales.
Table 4. T-test Results
Variable
Gender
t
Sig.
(2-tailed) Variable
Study Level
t
Sig.
(2-tailed)Male Female Bachelor Master
MC 5.7000 5.7500 -.235 .815 MC 5.7540 5.7540 .470 .640.
COG 4.8800 4.8651 .055 .956 COG 4.8794 4.8794 .093 .926
MOT 5.4800 5.4744 .026 .979 MOT 5.4667 5.4667 -.174 .862
BEH 5.3150 5.1581 .601 .549 BEH 5.3524 5.3524 1.639 .105
CRM 5.3250 5.6744 -1.278 .205 CRM 5.5556 5.5556 .639 .525
SRM 3.5125 3.5233 -.023 .982 SRM 3.5159 3.5159 -.017 .987
URM 5.3875 5.1628 .792 .431 URM 5.3095 5.3095 .480 .632
CARM 4.08 4.23 -.319 .751 CARM 4.16 4.16 .015 .988
V. One-way ANOVA
One-way ANOVA is used to determine whether three groups: business & economics vs engineering
and others of the factor “Major” is equal in term of Cultural Intelligence and Motivation for Study
Abroad.
Table 5. One-way ANOVA
Sum of Squares df Mean Square F Sig.
MC Between Groups 3.328 2 1.664 1.836
Within Groups 72.499 80 .906
Total 75.827 82
COG Between Groups 1.326 2 .663 .438
Within Groups 121.040 80 1.513
Total 122.366 82
MOT Between Groups .429 2 .215 .226
Within Groups 75.877 80 .948
Total 76.307 82
BEH Between Groups 3.587 2 1.793 1.291
Within Groups 111.119 80 1.389
Total 114.706 82
CRM Between Groups 1.838 2 .919 .582
Within Groups 126.242 80 1.578
Total 128.080 82
SRM Between Groups 6.576 2 3.288 .732
Within Groups 359.147 80 4.489
Total 365.723 82
URM Between Groups 5.896 2 2.948 1.811
Within Groups 130.255 80 1.628
Total 136.151 82
CARM Between Groups 14.347 2 7.174 1.447
Within Groups 396.617 80 4.958
Total 410.964 82
According to the results of paired sample t-test analysis, there is no significant difference among
these dependent variables.
VI. Two-way ANOVA
Two-way ANOVA to determine whether there is a significant interaction between gender &
study level, gender & major, study level & major in term of Cultural Intelligence and Motivation
for Study Abroad and the main effects of the factors.
Table 6. Two-way ANOVA
Gender*Stu_Level Gender Stu_Level Levene’s Test of Homonology
MC . . . .120
COG . . . .545
MOT . . . .132
BEH . . . .234
CRM . . . .310
SRM .147 .381 .571 .017
URM . . . .532
CARM . . . .318
Gender*Major Gender Major Levene’s Test of Homonology
MC . . . .113
COG . . . .447
MOT . . . .697
BEH . . . .192
CRM . . . .305
SRM .770 .597 .382 .019
URM . . . .690
CARM . . . .759
Stu_Level*Major Stu_Level Major Levene’s Test of Homogeneity
MC . . . .110
COG . . . .803
MOT . . . .060
BEH . . . .218
CRM .043 .050 .059 .031
SRM . . . .088
URM . . . .157
CARM . . . .348
Before testing the Two-way ANOVA analysis, we need to make sure there is homogeneity of the
variances using Levene’s Test. Table 6 shows that only 3 variances meet the criteria of Levene’s Test
(Sig.<0.05).
In two-way ANOVA with Gender and Study Level, only variance of SRM has homogeneity. However,
the result indicates that there is no significant interaction between the effects of gender and Study
Level on Social related Motivation for study abroad (SRM).
With the combination of Gender and Major, the homogeneity also exists for variance of factors with
SRM, but there is also no significant interaction between the effects of Gender and Major on Social
related Motivation for study abroad (SRM).
Considering the combination of Study Level and Major, the criterion of homogeneity is accepted for
CRM and there is a significant interaction between the effects of Study Level and Major on CRM
variable. However, considering Post Hoc result, there is no significant relationship between each
couple of groups.
Finally, simple main effects of every factors were not significant (p>0.05).
VII. Regression
Multiple linear regression to test effect of Cultural Intelligent Scale on Individual Motivation for
Study Abroad.
Table 7. Model summary
R R Square Adjusted R
Square
Standard Error
of the Estimate
Durbin
Watson test
MC .441a
.195 .153 .88482 1.922
COG .515a
.265 .227 1.07376 1.769
MOT .367a
.135 .091 .91990 1.710
BEH .486a
.236 .197 1.05995 2.025
Considering the R Square values in Table 7, the independents variables of the model have ability to
explain 19.5% variance of MC, 26.5% variance of COG, 13.5% variance of MOT, 23.6% variance of
BEH.
Table 8. ANOVA table in Regression analysis
Sum of Squares Df Mean Square F Sig.
MC 14.760 4 3.690 4.713 .002
COG 32.436 4 8.109 7.033 .000a
MOT 10.302 4 2.575 3.043 .022a
BEH 27.073 4 6.768 6.024 .000a
In term of ANOVA results in Regression analysis, the Table 8 shows that the independent variables
statistically predict all dependent variables (p<0.005) except MOT (F= 3.043, p=0.022)
Coefficients
Table 9, 10, 11, 12 shows the coefficients of independent variables on MC, COG, MOT, BEH.
Considering VIF values, there is no collinearity in all of the regressions (VIF < 2). The values of
Tolerance are high so the regression are acceptable.
Table 9. Coefficients of independent variables on MC
Unstandardized
Coefficients
Standardized
Coefficients
T Sig.
Collinearity
Statistics
B
Std.
Error
Beta Tolerance VIF
CARM .036 .053 .083 .668 .508 .667 1.499
CRM .187 .105 .243 1.788 .078 .558 1.791
SRM -.063 .058 -.138 -1.092 .278 .645 1.550
URM .189 .101 .253 1.869 .065 .564 1.774
Table 10. Coefficients of independent variables on COG
Unstandardized
Coefficients
Standardized
Coefficients
T Sig.
Collinearity
Statistics
B
Std.
Error
Beta Tolerance VIF
CARM .009 .065 .017 .146 .884 .667 1.499
CRM .122 .127 .124 .957 .341 .558 1.791
SRM .077 .070 .134 1.107 .272 .645 1.550
URM .336 .123 .355 2.743 .008 .564 1.774
Table 11. Coefficients of independent variables on MOT
Unstandardized
Coefficients
Standardized
Coefficients
T Sig.
Collinearity
Statistics
B
Std.
Error
Beta Tolerance VIF
CARM -.018 .056 -.041 -.321 .749 .667 1.499
CRM .164 .109 .213 1.510 .135 .558 1.791
SRM .097 .060 .213 1.624 .108 .645 1.550
URM .048 .105 .064 .456 .650 .564 1.774
Table 12. Coefficients of independent variables on BEH
Unstandardized
Coefficients
Standardized
Coefficients
T Sig.
Collinearity
Statistics
B
Std.
Error
Beta Tolerance VIF
CARM .010 .064 .019 .153 .879 .667 1.499
CRM .102 .125 .108 .816 .417 .558 1.791
SRM .055 .069 .099 .800 .426 .645 1.550
URM .328 .121 .358 2.712 .008 .564 1.774
The results show that there is only significant relationship between URM and COG as well as BEH. It
indicates that University related Motivation significantly positive affect Cognitive and Behavioral
Cognitive in Cultural Intelligent.

More Related Content

Similar to Statistics Analysis Report SPSS Vietnamese Students Cultural Intelligent

2272021 safe assign originality reporthttpslms.seu.edu
2272021 safe assign originality reporthttpslms.seu.edu2272021 safe assign originality reporthttpslms.seu.edu
2272021 safe assign originality reporthttpslms.seu.edusmile790243
 
Turkey financial stress risk index and econometric modeling using garch and m...
Turkey financial stress risk index and econometric modeling using garch and m...Turkey financial stress risk index and econometric modeling using garch and m...
Turkey financial stress risk index and econometric modeling using garch and m...YUNUS EMRE Ozcan
 
A Study of Factors Influencing Selection of Management Colleges in India - A ...
A Study of Factors Influencing Selection of Management Colleges in India - A ...A Study of Factors Influencing Selection of Management Colleges in India - A ...
A Study of Factors Influencing Selection of Management Colleges in India - A ...Ravi Shankar
 
Quantitative Structure Activity Relationship Studies of 4-Methyl-2-(p-Substit...
Quantitative Structure Activity Relationship Studies of 4-Methyl-2-(p-Substit...Quantitative Structure Activity Relationship Studies of 4-Methyl-2-(p-Substit...
Quantitative Structure Activity Relationship Studies of 4-Methyl-2-(p-Substit...IJAEMSJORNAL
 
Math 221 Massive Success / snaptutorial.com
Math 221 Massive Success / snaptutorial.comMath 221 Massive Success / snaptutorial.com
Math 221 Massive Success / snaptutorial.comStephenson164
 
European conference on educational research
European conference on educational research European conference on educational research
European conference on educational research GIRUMTAREKE
 
European conference on educational research
European conference on educational research European conference on educational research
European conference on educational research GIRUMTAREKE
 
European conference on educational research
European conference on educational research European conference on educational research
European conference on educational research GIRUMTAREKE
 
week 1 ScoreWeek 1.Measurement and Description - chapters 1 and 2.docx
week 1 ScoreWeek 1.Measurement and Description - chapters 1 and 2.docxweek 1 ScoreWeek 1.Measurement and Description - chapters 1 and 2.docx
week 1 ScoreWeek 1.Measurement and Description - chapters 1 and 2.docxmelbruce90096
 
Applying fuzzy ahp to evaluate the carbon foot print on the workplace in educ...
Applying fuzzy ahp to evaluate the carbon foot print on the workplace in educ...Applying fuzzy ahp to evaluate the carbon foot print on the workplace in educ...
Applying fuzzy ahp to evaluate the carbon foot print on the workplace in educ...eSAT Publishing House
 
16 ch ken black solution
16 ch ken black solution16 ch ken black solution
16 ch ken black solutionKrunal Shah
 
Bateman eq5 d_for uk rasch user group 2014
Bateman eq5 d_for uk rasch user group 2014Bateman eq5 d_for uk rasch user group 2014
Bateman eq5 d_for uk rasch user group 2014Andrew Bateman
 
Charles Cotter's PhD research findings & recommendations_Strategic L&D
Charles Cotter's PhD research findings & recommendations_Strategic L&DCharles Cotter's PhD research findings & recommendations_Strategic L&D
Charles Cotter's PhD research findings & recommendations_Strategic L&DCharles Cotter, PhD
 
Stochastic frontier with copular
Stochastic frontier with copular Stochastic frontier with copular
Stochastic frontier with copular Kasidit Poonkham
 
6MODULE 2Module 2 Problem SetEXAMPLEGrand .docx
6MODULE 2Module 2 Problem SetEXAMPLEGrand .docx6MODULE 2Module 2 Problem SetEXAMPLEGrand .docx
6MODULE 2Module 2 Problem SetEXAMPLEGrand .docxblondellchancy
 
Introduction to Statistics Part A - Outputs 1. A sa.docx
Introduction to Statistics Part A - Outputs 1. A sa.docxIntroduction to Statistics Part A - Outputs 1. A sa.docx
Introduction to Statistics Part A - Outputs 1. A sa.docxmariuse18nolet
 
As mentioned earlier, the mid-term will have conceptual and quanti.docx
As mentioned earlier, the mid-term will have conceptual and quanti.docxAs mentioned earlier, the mid-term will have conceptual and quanti.docx
As mentioned earlier, the mid-term will have conceptual and quanti.docxfredharris32
 
Splay Method of Model Acquisition Assessment
Splay Method of Model Acquisition AssessmentSplay Method of Model Acquisition Assessment
Splay Method of Model Acquisition Assessmentijtsrd
 
wealth age region37 50 M24 88 U14 64 A13 63 U13 66 .docx
wealth age region37 50 M24 88 U14 64 A13 63 U13 66 .docxwealth age region37 50 M24 88 U14 64 A13 63 U13 66 .docx
wealth age region37 50 M24 88 U14 64 A13 63 U13 66 .docxmelbruce90096
 

Similar to Statistics Analysis Report SPSS Vietnamese Students Cultural Intelligent (20)

2272021 safe assign originality reporthttpslms.seu.edu
2272021 safe assign originality reporthttpslms.seu.edu2272021 safe assign originality reporthttpslms.seu.edu
2272021 safe assign originality reporthttpslms.seu.edu
 
Turkey financial stress risk index and econometric modeling using garch and m...
Turkey financial stress risk index and econometric modeling using garch and m...Turkey financial stress risk index and econometric modeling using garch and m...
Turkey financial stress risk index and econometric modeling using garch and m...
 
SERMACS Poster
SERMACS PosterSERMACS Poster
SERMACS Poster
 
A Study of Factors Influencing Selection of Management Colleges in India - A ...
A Study of Factors Influencing Selection of Management Colleges in India - A ...A Study of Factors Influencing Selection of Management Colleges in India - A ...
A Study of Factors Influencing Selection of Management Colleges in India - A ...
 
Quantitative Structure Activity Relationship Studies of 4-Methyl-2-(p-Substit...
Quantitative Structure Activity Relationship Studies of 4-Methyl-2-(p-Substit...Quantitative Structure Activity Relationship Studies of 4-Methyl-2-(p-Substit...
Quantitative Structure Activity Relationship Studies of 4-Methyl-2-(p-Substit...
 
Math 221 Massive Success / snaptutorial.com
Math 221 Massive Success / snaptutorial.comMath 221 Massive Success / snaptutorial.com
Math 221 Massive Success / snaptutorial.com
 
European conference on educational research
European conference on educational research European conference on educational research
European conference on educational research
 
European conference on educational research
European conference on educational research European conference on educational research
European conference on educational research
 
European conference on educational research
European conference on educational research European conference on educational research
European conference on educational research
 
week 1 ScoreWeek 1.Measurement and Description - chapters 1 and 2.docx
week 1 ScoreWeek 1.Measurement and Description - chapters 1 and 2.docxweek 1 ScoreWeek 1.Measurement and Description - chapters 1 and 2.docx
week 1 ScoreWeek 1.Measurement and Description - chapters 1 and 2.docx
 
Applying fuzzy ahp to evaluate the carbon foot print on the workplace in educ...
Applying fuzzy ahp to evaluate the carbon foot print on the workplace in educ...Applying fuzzy ahp to evaluate the carbon foot print on the workplace in educ...
Applying fuzzy ahp to evaluate the carbon foot print on the workplace in educ...
 
16 ch ken black solution
16 ch ken black solution16 ch ken black solution
16 ch ken black solution
 
Bateman eq5 d_for uk rasch user group 2014
Bateman eq5 d_for uk rasch user group 2014Bateman eq5 d_for uk rasch user group 2014
Bateman eq5 d_for uk rasch user group 2014
 
Charles Cotter's PhD research findings & recommendations_Strategic L&D
Charles Cotter's PhD research findings & recommendations_Strategic L&DCharles Cotter's PhD research findings & recommendations_Strategic L&D
Charles Cotter's PhD research findings & recommendations_Strategic L&D
 
Stochastic frontier with copular
Stochastic frontier with copular Stochastic frontier with copular
Stochastic frontier with copular
 
6MODULE 2Module 2 Problem SetEXAMPLEGrand .docx
6MODULE 2Module 2 Problem SetEXAMPLEGrand .docx6MODULE 2Module 2 Problem SetEXAMPLEGrand .docx
6MODULE 2Module 2 Problem SetEXAMPLEGrand .docx
 
Introduction to Statistics Part A - Outputs 1. A sa.docx
Introduction to Statistics Part A - Outputs 1. A sa.docxIntroduction to Statistics Part A - Outputs 1. A sa.docx
Introduction to Statistics Part A - Outputs 1. A sa.docx
 
As mentioned earlier, the mid-term will have conceptual and quanti.docx
As mentioned earlier, the mid-term will have conceptual and quanti.docxAs mentioned earlier, the mid-term will have conceptual and quanti.docx
As mentioned earlier, the mid-term will have conceptual and quanti.docx
 
Splay Method of Model Acquisition Assessment
Splay Method of Model Acquisition AssessmentSplay Method of Model Acquisition Assessment
Splay Method of Model Acquisition Assessment
 
wealth age region37 50 M24 88 U14 64 A13 63 U13 66 .docx
wealth age region37 50 M24 88 U14 64 A13 63 U13 66 .docxwealth age region37 50 M24 88 U14 64 A13 63 U13 66 .docx
wealth age region37 50 M24 88 U14 64 A13 63 U13 66 .docx
 

More from Selina Mai

Final report Management Literature Review Selina
Final report Management Literature Review SelinaFinal report Management Literature Review Selina
Final report Management Literature Review SelinaSelina Mai
 
Mid-term report Management Literature Review Selina
Mid-term report Management Literature Review SelinaMid-term report Management Literature Review Selina
Mid-term report Management Literature Review SelinaSelina Mai
 
Za marketing proposal
Za marketing proposalZa marketing proposal
Za marketing proposalSelina Mai
 
Case Study Starbucks Loyalty Program
Case Study Starbucks Loyalty ProgramCase Study Starbucks Loyalty Program
Case Study Starbucks Loyalty ProgramSelina Mai
 
Application of Lost averse and zero cost from Predictably Irrational of Dan A...
Application of Lost averse and zero cost from Predictably Irrational of Dan A...Application of Lost averse and zero cost from Predictably Irrational of Dan A...
Application of Lost averse and zero cost from Predictably Irrational of Dan A...Selina Mai
 
Culture shock presentation
Culture shock presentationCulture shock presentation
Culture shock presentationSelina Mai
 
American people presentation
American people presentationAmerican people presentation
American people presentationSelina Mai
 

More from Selina Mai (7)

Final report Management Literature Review Selina
Final report Management Literature Review SelinaFinal report Management Literature Review Selina
Final report Management Literature Review Selina
 
Mid-term report Management Literature Review Selina
Mid-term report Management Literature Review SelinaMid-term report Management Literature Review Selina
Mid-term report Management Literature Review Selina
 
Za marketing proposal
Za marketing proposalZa marketing proposal
Za marketing proposal
 
Case Study Starbucks Loyalty Program
Case Study Starbucks Loyalty ProgramCase Study Starbucks Loyalty Program
Case Study Starbucks Loyalty Program
 
Application of Lost averse and zero cost from Predictably Irrational of Dan A...
Application of Lost averse and zero cost from Predictably Irrational of Dan A...Application of Lost averse and zero cost from Predictably Irrational of Dan A...
Application of Lost averse and zero cost from Predictably Irrational of Dan A...
 
Culture shock presentation
Culture shock presentationCulture shock presentation
Culture shock presentation
 
American people presentation
American people presentationAmerican people presentation
American people presentation
 

Recently uploaded

Criminal IP - Threat Hunting Webinar.pdf
Criminal IP - Threat Hunting Webinar.pdfCriminal IP - Threat Hunting Webinar.pdf
Criminal IP - Threat Hunting Webinar.pdfCriminal IP
 
tapal brand analysis PPT slide for comptetive data
tapal brand analysis PPT slide for comptetive datatapal brand analysis PPT slide for comptetive data
tapal brand analysis PPT slide for comptetive datatheahmadsaood
 
How can I successfully sell my pi coins in Philippines?
How can I successfully sell my pi coins in Philippines?How can I successfully sell my pi coins in Philippines?
How can I successfully sell my pi coins in Philippines?DOT TECH
 
一比一原版(TWU毕业证)西三一大学毕业证成绩单
一比一原版(TWU毕业证)西三一大学毕业证成绩单一比一原版(TWU毕业证)西三一大学毕业证成绩单
一比一原版(TWU毕业证)西三一大学毕业证成绩单ocavb
 
一比一原版(ArtEZ毕业证)ArtEZ艺术学院毕业证成绩单
一比一原版(ArtEZ毕业证)ArtEZ艺术学院毕业证成绩单一比一原版(ArtEZ毕业证)ArtEZ艺术学院毕业证成绩单
一比一原版(ArtEZ毕业证)ArtEZ艺术学院毕业证成绩单vcaxypu
 
standardisation of garbhpala offhgfffghh
standardisation of garbhpala offhgfffghhstandardisation of garbhpala offhgfffghh
standardisation of garbhpala offhgfffghhArpitMalhotra16
 
Using PDB Relocation to Move a Single PDB to Another Existing CDB
Using PDB Relocation to Move a Single PDB to Another Existing CDBUsing PDB Relocation to Move a Single PDB to Another Existing CDB
Using PDB Relocation to Move a Single PDB to Another Existing CDBAlireza Kamrani
 
Innovative Methods in Media and Communication Research by Sebastian Kubitschk...
Innovative Methods in Media and Communication Research by Sebastian Kubitschk...Innovative Methods in Media and Communication Research by Sebastian Kubitschk...
Innovative Methods in Media and Communication Research by Sebastian Kubitschk...correoyaya
 
2024-05-14 - Tableau User Group - TC24 Hot Topics - Tableau Pulse and Einstei...
2024-05-14 - Tableau User Group - TC24 Hot Topics - Tableau Pulse and Einstei...2024-05-14 - Tableau User Group - TC24 Hot Topics - Tableau Pulse and Einstei...
2024-05-14 - Tableau User Group - TC24 Hot Topics - Tableau Pulse and Einstei...elinavihriala
 
一比一原版(NYU毕业证)纽约大学毕业证成绩单
一比一原版(NYU毕业证)纽约大学毕业证成绩单一比一原版(NYU毕业证)纽约大学毕业证成绩单
一比一原版(NYU毕业证)纽约大学毕业证成绩单ewymefz
 
一比一原版(CBU毕业证)不列颠海角大学毕业证成绩单
一比一原版(CBU毕业证)不列颠海角大学毕业证成绩单一比一原版(CBU毕业证)不列颠海角大学毕业证成绩单
一比一原版(CBU毕业证)不列颠海角大学毕业证成绩单nscud
 
一比一原版(QU毕业证)皇后大学毕业证成绩单
一比一原版(QU毕业证)皇后大学毕业证成绩单一比一原版(QU毕业证)皇后大学毕业证成绩单
一比一原版(QU毕业证)皇后大学毕业证成绩单enxupq
 
Tabula.io Cheatsheet: automate your data workflows
Tabula.io Cheatsheet: automate your data workflowsTabula.io Cheatsheet: automate your data workflows
Tabula.io Cheatsheet: automate your data workflowsalex933524
 
一比一原版(UPenn毕业证)宾夕法尼亚大学毕业证成绩单
一比一原版(UPenn毕业证)宾夕法尼亚大学毕业证成绩单一比一原版(UPenn毕业证)宾夕法尼亚大学毕业证成绩单
一比一原版(UPenn毕业证)宾夕法尼亚大学毕业证成绩单ewymefz
 
Criminal IP - Threat Hunting Webinar.pdf
Criminal IP - Threat Hunting Webinar.pdfCriminal IP - Threat Hunting Webinar.pdf
Criminal IP - Threat Hunting Webinar.pdfCriminal IP
 
Computer Presentation.pptx ecommerce advantage s
Computer Presentation.pptx ecommerce advantage sComputer Presentation.pptx ecommerce advantage s
Computer Presentation.pptx ecommerce advantage sMAQIB18
 
Supply chain analytics to combat the effects of Ukraine-Russia-conflict
Supply chain analytics to combat the effects of Ukraine-Russia-conflictSupply chain analytics to combat the effects of Ukraine-Russia-conflict
Supply chain analytics to combat the effects of Ukraine-Russia-conflictJack Cole
 
Professional Data Engineer Certification Exam Guide  _  Learn  _  Google Clou...
Professional Data Engineer Certification Exam Guide  _  Learn  _  Google Clou...Professional Data Engineer Certification Exam Guide  _  Learn  _  Google Clou...
Professional Data Engineer Certification Exam Guide  _  Learn  _  Google Clou...Domenico Conte
 
一比一原版(CU毕业证)卡尔顿大学毕业证成绩单
一比一原版(CU毕业证)卡尔顿大学毕业证成绩单一比一原版(CU毕业证)卡尔顿大学毕业证成绩单
一比一原版(CU毕业证)卡尔顿大学毕业证成绩单yhkoc
 
Business update Q1 2024 Lar España Real Estate SOCIMI
Business update Q1 2024 Lar España Real Estate SOCIMIBusiness update Q1 2024 Lar España Real Estate SOCIMI
Business update Q1 2024 Lar España Real Estate SOCIMIAlejandraGmez176757
 

Recently uploaded (20)

Criminal IP - Threat Hunting Webinar.pdf
Criminal IP - Threat Hunting Webinar.pdfCriminal IP - Threat Hunting Webinar.pdf
Criminal IP - Threat Hunting Webinar.pdf
 
tapal brand analysis PPT slide for comptetive data
tapal brand analysis PPT slide for comptetive datatapal brand analysis PPT slide for comptetive data
tapal brand analysis PPT slide for comptetive data
 
How can I successfully sell my pi coins in Philippines?
How can I successfully sell my pi coins in Philippines?How can I successfully sell my pi coins in Philippines?
How can I successfully sell my pi coins in Philippines?
 
一比一原版(TWU毕业证)西三一大学毕业证成绩单
一比一原版(TWU毕业证)西三一大学毕业证成绩单一比一原版(TWU毕业证)西三一大学毕业证成绩单
一比一原版(TWU毕业证)西三一大学毕业证成绩单
 
一比一原版(ArtEZ毕业证)ArtEZ艺术学院毕业证成绩单
一比一原版(ArtEZ毕业证)ArtEZ艺术学院毕业证成绩单一比一原版(ArtEZ毕业证)ArtEZ艺术学院毕业证成绩单
一比一原版(ArtEZ毕业证)ArtEZ艺术学院毕业证成绩单
 
standardisation of garbhpala offhgfffghh
standardisation of garbhpala offhgfffghhstandardisation of garbhpala offhgfffghh
standardisation of garbhpala offhgfffghh
 
Using PDB Relocation to Move a Single PDB to Another Existing CDB
Using PDB Relocation to Move a Single PDB to Another Existing CDBUsing PDB Relocation to Move a Single PDB to Another Existing CDB
Using PDB Relocation to Move a Single PDB to Another Existing CDB
 
Innovative Methods in Media and Communication Research by Sebastian Kubitschk...
Innovative Methods in Media and Communication Research by Sebastian Kubitschk...Innovative Methods in Media and Communication Research by Sebastian Kubitschk...
Innovative Methods in Media and Communication Research by Sebastian Kubitschk...
 
2024-05-14 - Tableau User Group - TC24 Hot Topics - Tableau Pulse and Einstei...
2024-05-14 - Tableau User Group - TC24 Hot Topics - Tableau Pulse and Einstei...2024-05-14 - Tableau User Group - TC24 Hot Topics - Tableau Pulse and Einstei...
2024-05-14 - Tableau User Group - TC24 Hot Topics - Tableau Pulse and Einstei...
 
一比一原版(NYU毕业证)纽约大学毕业证成绩单
一比一原版(NYU毕业证)纽约大学毕业证成绩单一比一原版(NYU毕业证)纽约大学毕业证成绩单
一比一原版(NYU毕业证)纽约大学毕业证成绩单
 
一比一原版(CBU毕业证)不列颠海角大学毕业证成绩单
一比一原版(CBU毕业证)不列颠海角大学毕业证成绩单一比一原版(CBU毕业证)不列颠海角大学毕业证成绩单
一比一原版(CBU毕业证)不列颠海角大学毕业证成绩单
 
一比一原版(QU毕业证)皇后大学毕业证成绩单
一比一原版(QU毕业证)皇后大学毕业证成绩单一比一原版(QU毕业证)皇后大学毕业证成绩单
一比一原版(QU毕业证)皇后大学毕业证成绩单
 
Tabula.io Cheatsheet: automate your data workflows
Tabula.io Cheatsheet: automate your data workflowsTabula.io Cheatsheet: automate your data workflows
Tabula.io Cheatsheet: automate your data workflows
 
一比一原版(UPenn毕业证)宾夕法尼亚大学毕业证成绩单
一比一原版(UPenn毕业证)宾夕法尼亚大学毕业证成绩单一比一原版(UPenn毕业证)宾夕法尼亚大学毕业证成绩单
一比一原版(UPenn毕业证)宾夕法尼亚大学毕业证成绩单
 
Criminal IP - Threat Hunting Webinar.pdf
Criminal IP - Threat Hunting Webinar.pdfCriminal IP - Threat Hunting Webinar.pdf
Criminal IP - Threat Hunting Webinar.pdf
 
Computer Presentation.pptx ecommerce advantage s
Computer Presentation.pptx ecommerce advantage sComputer Presentation.pptx ecommerce advantage s
Computer Presentation.pptx ecommerce advantage s
 
Supply chain analytics to combat the effects of Ukraine-Russia-conflict
Supply chain analytics to combat the effects of Ukraine-Russia-conflictSupply chain analytics to combat the effects of Ukraine-Russia-conflict
Supply chain analytics to combat the effects of Ukraine-Russia-conflict
 
Professional Data Engineer Certification Exam Guide  _  Learn  _  Google Clou...
Professional Data Engineer Certification Exam Guide  _  Learn  _  Google Clou...Professional Data Engineer Certification Exam Guide  _  Learn  _  Google Clou...
Professional Data Engineer Certification Exam Guide  _  Learn  _  Google Clou...
 
一比一原版(CU毕业证)卡尔顿大学毕业证成绩单
一比一原版(CU毕业证)卡尔顿大学毕业证成绩单一比一原版(CU毕业证)卡尔顿大学毕业证成绩单
一比一原版(CU毕业证)卡尔顿大学毕业证成绩单
 
Business update Q1 2024 Lar España Real Estate SOCIMI
Business update Q1 2024 Lar España Real Estate SOCIMIBusiness update Q1 2024 Lar España Real Estate SOCIMI
Business update Q1 2024 Lar España Real Estate SOCIMI
 

Statistics Analysis Report SPSS Vietnamese Students Cultural Intelligent

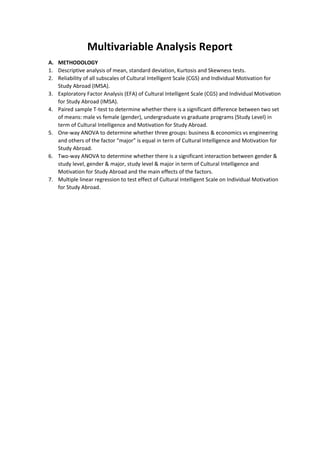
  • 1. Multivariable Analysis Report A. METHODOLOGY 1. Descriptive analysis of mean, standard deviation, Kurtosis and Skewness tests. 2. Reliability of all subscales of Cultural Intelligent Scale (CGS) and Individual Motivation for Study Abroad (IMSA). 3. Exploratory Factor Analysis (EFA) of Cultural Intelligent Scale (CGS) and Individual Motivation for Study Abroad (IMSA). 4. Paired sample T-test to determine whether there is a significant difference between two set of means: male vs female (gender), undergraduate vs graduate programs (Study Level) in term of Cultural Intelligence and Motivation for Study Abroad. 5. One-way ANOVA to determine whether three groups: business & economics vs engineering and others of the factor “major” is equal in term of Cultural Intelligence and Motivation for Study Abroad. 6. Two-way ANOVA to determine whether there is a significant interaction between gender & study level, gender & major, study level & major in term of Cultural Intelligence and Motivation for Study Abroad and the main effects of the factors. 7. Multiple linear regression to test effect of Cultural Intelligent Scale on Individual Motivation for Study Abroad.
  • 2. B. RESULTS I. Descriptive Analysis The descriptive statistics showed in Table 1 provide details of mean, standard deviation as well as normally distribution test statistics (Skewness and Kurtosis tests) for the independent and dependent variables of the study. Mean Std. Deviation Skewness Kurtosis Gender 1.52 .503 -.074 -2.044 Stu_Level 1.24 .430 1.234 -.490 Major 2.63 1.266 .004 -1.722 MC1 5.71 1.293 -1.834 3.687 MC2 5.98 .962 -2.222 8.640 MC3 5.73 1.138 -1.595 2.988 MC4 5.48 1.319 -1.576 2.712 COG1 4.98 1.414 -.991 .937 COG2 5.10 1.503 -1.073 .683 COG3 5.11 1.423 -.742 .195 COG4 4.70 1.454 -.747 .113 COG5 4.60 1.456 -.730 .170 COG6 4.86 1.458 -.880 .489 MOT1 5.93 1.068 -1.760 5.165 MOT2 5.25 1.286 -1.229 2.524 MOT3 5.53 1.272 -.980 .696 MOT4 5.35 1.214 -.833 .534 MOT5 5.33 1.389 -1.195 1.212 BEH1 5.14 1.474 -.957 .584 BEH2 5.16 1.302 -.944 1.039 BEH3 5.13 1.276 -.651 .203 BEH4 5.39 1.314 -.917 .188 BEH5 5.35 1.401 -1.170 1.276 CRM1 5.76 1.478 -1.382 1.220 CRM2 5.34 1.610 -1.163 .566 CRM3 5.14 1.712 -.963 .102 CRM4 5.42 1.631 -.954 -.037 URM1 5.06 1.803 -.910 -.220 URM2 5.05 1.873 -.744 -.672 URM3 5.48 1.282 -.831 -.236 SRM1 3.93 2.315 .030 -1.588 SRM2 3.11 2.263 .606 -1.173 CARM 4.16 2.239 -.241 -1.479
  • 3. II. Reliability Reliability of all subscales of Cultural Intelligent Scale (CGS) and Individual Motivation for Study Abroad (IMSA) is tested using Cronbach’s alpha index. Tab. 2 lists all of the Cronbach’s alpha index values. Subscale Cronbach’s alpha MC .857 COG .916 MOT .858 BEH .932 CRM .812 URM .810 SRM .825 CARM Table 2 reveals that all the subscales of the Cultural Intelligent Scale and Individual Motivation for Study Abroad Scale are acceptable (Cronbach’s alpha > 70). This result indicates that all sets of variables are consistent and reliable. III. Exploratory Factor Analysis (EFA) Exploratory Factor Analysis (EFA) is used to examine the underlying structure of Cultural Intelligent Scale (CGS) and Individual Motivation for Study Abroad (IMSA) and deduct the variables if needed. 1. EFA for Cultural Intelligent Scale (CQS) Firstly, Exploratory Factor Analysis is applied to Cultural Intelligent Scale (CQS) In order to test if the data is appropriate for factor analysis or not, Kaiser-Meyer-Olkin Measure of Sampling Adequacy (KMO) and Bartlett’s Test of Sphericity results are examined. Accordingly, KMO value is found out as .87, and the result of Bartlett’s Test of Sphericity is [χ2=1426.271; df=190; p<.00] also found out to be meaningful. These values show that the data is appropriate for EFA. Then, Varimax orthogonal rotation method is used to examine the factor structure of Cultural Intelligence Scale. In the analysis, in order to decide which items are appropriate for the scale, the threshold value for factor loadings is accepted as .50. In addition, for items having high loadings in more than one factor, the variance between them is accepted to be at least .10. It is decided that items not providing these requirements would be discarded. At the end of the first factor analysis, items are loaded under 4 factors in which the eigenvalues are greater than 1.0. This structure explains 71.9% of the total variance. Therefore, the four-factor structure is considered to be appropriate for the scale. According to the Varimax orthogonal rotation results, 1 item (MOT2) is discarded due to being not coherent with the other items in the same factor. Moreover, 1 item (COG1) having high loadings in more than one factor is also discarded. After discarding two items, the analysis is run again. Correspondingly, KMO value is found out as .85 and the result of Barlett’s Test of Sphericity (χ2 = 1092,27, df= 153, p<.000) is found out to be meaningful.
  • 4. As the result of analysis, the four-factor structure is accepted with Factor 1: Behavioral Cognitive (BEH, factor loadings are between .743 and .844, explains 46.59% of the variance), Factor 2: Cognitive (COG, factor loadings vary from .631 to.866, explains 12.64% of the variance), Factor 3: Metacognitive (MC, factor loadings are between .591 and .841, explains 8.31% of the variance), and Factor 4: Motivation Cognitive (MOT, factor loadings range from .579 to .795, explains 5.88% of the variance). All factors as a whole account for 73.427% of the total variance. Table 2. Results of EFA on CGS. Component Variance Explained (%)BEH COG MC MOT MC1 .284 .045 .808 .044 MC2 -.080 .186 .841 .107 8.31 MC3 .236 .266 .717 .274 MC4 .070 .417 .591 .269 COG2 .277 .711 .417 .083 COG3 .129 .763 .350 .120 COG4 .201 .866 .233 .156 12.65 COG5 .205 .800 .087 .194 COG6 .261 .631 -.142 .498 MOT1 .244 .256 .283 .579 MOT3 .402 .162 .128 .717 5.88 MOT4 .204 .090 .201 .795 MOT5 .439 .277 .125 .635 BEH1 .834 .160 .246 .180 BEH2 .844 .183 .243 .156 BEH3 .795 .294 .029 .303 46.59 BEH4 .816 .244 .020 .297 BEH5 .743 .094 .050 .269 Total 73.427
  • 5. 2. EFA for Individual Motivation for Study Abroad (IMSA) scale. Firstly, Exploratory Factor Analysis is applied to Individual Motivation for Study Abroad scale. After computing, the result of KMO value is .821, and Bartlett’s Test of Sphericity value is [χ2=368.817; df=45; p<.000], which is meaning and the IMSA is appropriate to run EFA. Accordingly, items are extracted with fixed 4 factors. This four-factor structure explains 77.04% of the total variance. According to the Varimax orthogonal rotation results, three items are removed from the structure which are CRM3, CRM4 and URM3 because their loadings are not coherent with the other items in the same factor. After removing these items, the analysis is repeatedly conducted. the result of KMO value is .764, and Bartlett’s Test of Sphericity value is [χ2=241.684; df=21; p<.000], which is still appropriate. The four-factor structure of IMSA now explains 87.11%of the total variance. The structure includes Factor 1: University-related Motivation with factor loading range from .867 to .893 (explains 49.44% of the variance), Factor 2: Social-related Motivation with loadings of .866 to .879 (explains 19.44% of the variance), Factor 3: Culture-related Motivation (CRM) with factor loadings varying from .812 to .856 (explains 10.52% of the variance), Factor 4: Career-related Motivation with loading of .895 (explains 7.71% of the variance). Table 3. Results of EFA on IMSA. Component Variance Explained (%)URM SRM CRM CARM CRM1 .206 .243 .856 -.036 10.52 CRM2 .326 .035 .812 .212 URM1 .867 .128 .286 .142 49.44 URM2 .893 .148 .235 .083 SRM1 .261 .879 .147 .124 19.44 SRM2 .021 .866 .130 .293 CARM .173 .354 .104 .895 7.71 Total 87.11%
  • 6. IV. T-test Paired sample T-test was computed to determine whether there is a significant difference between two set of means: male vs female (gender), undergraduate vs graduate programs (Study Level) in term of Cultural Intelligence and Motivation for Study Abroad. According to the results of paired sample t-test analysis, there is no Gender difference and Study Level difference in the dependent variables of Cultural Intelligence and Motivation for Study Abroad scales. Table 4. T-test Results Variable Gender t Sig. (2-tailed) Variable Study Level t Sig. (2-tailed)Male Female Bachelor Master MC 5.7000 5.7500 -.235 .815 MC 5.7540 5.7540 .470 .640. COG 4.8800 4.8651 .055 .956 COG 4.8794 4.8794 .093 .926 MOT 5.4800 5.4744 .026 .979 MOT 5.4667 5.4667 -.174 .862 BEH 5.3150 5.1581 .601 .549 BEH 5.3524 5.3524 1.639 .105 CRM 5.3250 5.6744 -1.278 .205 CRM 5.5556 5.5556 .639 .525 SRM 3.5125 3.5233 -.023 .982 SRM 3.5159 3.5159 -.017 .987 URM 5.3875 5.1628 .792 .431 URM 5.3095 5.3095 .480 .632 CARM 4.08 4.23 -.319 .751 CARM 4.16 4.16 .015 .988
  • 7. V. One-way ANOVA One-way ANOVA is used to determine whether three groups: business & economics vs engineering and others of the factor “Major” is equal in term of Cultural Intelligence and Motivation for Study Abroad. Table 5. One-way ANOVA Sum of Squares df Mean Square F Sig. MC Between Groups 3.328 2 1.664 1.836 Within Groups 72.499 80 .906 Total 75.827 82 COG Between Groups 1.326 2 .663 .438 Within Groups 121.040 80 1.513 Total 122.366 82 MOT Between Groups .429 2 .215 .226 Within Groups 75.877 80 .948 Total 76.307 82 BEH Between Groups 3.587 2 1.793 1.291 Within Groups 111.119 80 1.389 Total 114.706 82 CRM Between Groups 1.838 2 .919 .582 Within Groups 126.242 80 1.578 Total 128.080 82 SRM Between Groups 6.576 2 3.288 .732 Within Groups 359.147 80 4.489 Total 365.723 82 URM Between Groups 5.896 2 2.948 1.811 Within Groups 130.255 80 1.628 Total 136.151 82 CARM Between Groups 14.347 2 7.174 1.447 Within Groups 396.617 80 4.958 Total 410.964 82 According to the results of paired sample t-test analysis, there is no significant difference among these dependent variables.
  • 8. VI. Two-way ANOVA Two-way ANOVA to determine whether there is a significant interaction between gender & study level, gender & major, study level & major in term of Cultural Intelligence and Motivation for Study Abroad and the main effects of the factors. Table 6. Two-way ANOVA Gender*Stu_Level Gender Stu_Level Levene’s Test of Homonology MC . . . .120 COG . . . .545 MOT . . . .132 BEH . . . .234 CRM . . . .310 SRM .147 .381 .571 .017 URM . . . .532 CARM . . . .318 Gender*Major Gender Major Levene’s Test of Homonology MC . . . .113 COG . . . .447 MOT . . . .697 BEH . . . .192 CRM . . . .305 SRM .770 .597 .382 .019 URM . . . .690 CARM . . . .759 Stu_Level*Major Stu_Level Major Levene’s Test of Homogeneity MC . . . .110 COG . . . .803 MOT . . . .060 BEH . . . .218 CRM .043 .050 .059 .031 SRM . . . .088 URM . . . .157 CARM . . . .348 Before testing the Two-way ANOVA analysis, we need to make sure there is homogeneity of the variances using Levene’s Test. Table 6 shows that only 3 variances meet the criteria of Levene’s Test (Sig.<0.05). In two-way ANOVA with Gender and Study Level, only variance of SRM has homogeneity. However, the result indicates that there is no significant interaction between the effects of gender and Study Level on Social related Motivation for study abroad (SRM). With the combination of Gender and Major, the homogeneity also exists for variance of factors with SRM, but there is also no significant interaction between the effects of Gender and Major on Social related Motivation for study abroad (SRM). Considering the combination of Study Level and Major, the criterion of homogeneity is accepted for CRM and there is a significant interaction between the effects of Study Level and Major on CRM
  • 9. variable. However, considering Post Hoc result, there is no significant relationship between each couple of groups. Finally, simple main effects of every factors were not significant (p>0.05). VII. Regression Multiple linear regression to test effect of Cultural Intelligent Scale on Individual Motivation for Study Abroad. Table 7. Model summary R R Square Adjusted R Square Standard Error of the Estimate Durbin Watson test MC .441a .195 .153 .88482 1.922 COG .515a .265 .227 1.07376 1.769 MOT .367a .135 .091 .91990 1.710 BEH .486a .236 .197 1.05995 2.025 Considering the R Square values in Table 7, the independents variables of the model have ability to explain 19.5% variance of MC, 26.5% variance of COG, 13.5% variance of MOT, 23.6% variance of BEH. Table 8. ANOVA table in Regression analysis Sum of Squares Df Mean Square F Sig. MC 14.760 4 3.690 4.713 .002 COG 32.436 4 8.109 7.033 .000a MOT 10.302 4 2.575 3.043 .022a BEH 27.073 4 6.768 6.024 .000a In term of ANOVA results in Regression analysis, the Table 8 shows that the independent variables statistically predict all dependent variables (p<0.005) except MOT (F= 3.043, p=0.022) Coefficients Table 9, 10, 11, 12 shows the coefficients of independent variables on MC, COG, MOT, BEH. Considering VIF values, there is no collinearity in all of the regressions (VIF < 2). The values of Tolerance are high so the regression are acceptable. Table 9. Coefficients of independent variables on MC Unstandardized Coefficients Standardized Coefficients T Sig. Collinearity Statistics B Std. Error Beta Tolerance VIF CARM .036 .053 .083 .668 .508 .667 1.499 CRM .187 .105 .243 1.788 .078 .558 1.791 SRM -.063 .058 -.138 -1.092 .278 .645 1.550 URM .189 .101 .253 1.869 .065 .564 1.774 Table 10. Coefficients of independent variables on COG
  • 10. Unstandardized Coefficients Standardized Coefficients T Sig. Collinearity Statistics B Std. Error Beta Tolerance VIF CARM .009 .065 .017 .146 .884 .667 1.499 CRM .122 .127 .124 .957 .341 .558 1.791 SRM .077 .070 .134 1.107 .272 .645 1.550 URM .336 .123 .355 2.743 .008 .564 1.774 Table 11. Coefficients of independent variables on MOT Unstandardized Coefficients Standardized Coefficients T Sig. Collinearity Statistics B Std. Error Beta Tolerance VIF CARM -.018 .056 -.041 -.321 .749 .667 1.499 CRM .164 .109 .213 1.510 .135 .558 1.791 SRM .097 .060 .213 1.624 .108 .645 1.550 URM .048 .105 .064 .456 .650 .564 1.774 Table 12. Coefficients of independent variables on BEH Unstandardized Coefficients Standardized Coefficients T Sig. Collinearity Statistics B Std. Error Beta Tolerance VIF CARM .010 .064 .019 .153 .879 .667 1.499 CRM .102 .125 .108 .816 .417 .558 1.791 SRM .055 .069 .099 .800 .426 .645 1.550 URM .328 .121 .358 2.712 .008 .564 1.774 The results show that there is only significant relationship between URM and COG as well as BEH. It indicates that University related Motivation significantly positive affect Cognitive and Behavioral Cognitive in Cultural Intelligent.