Statistical Analysis Project
•Download as DOCX, PDF•
1 like•162 views
Performed Statistical Analysis tests through coding in R to see which aspect of a professional golfer's game has the highest predictive value on average earnings per event.
Report
Share
Report
Share

Recommended
lanen_5e_ch05_student.ppt
This document discusses cost estimation methods including engineering estimates, account analysis, and statistical analysis using regression. It provides examples of estimating costs for a new computer repair center using these different methods. Specifically, it walks through estimating fixed and variable costs using account analysis of the repair center's actual cost data. It then uses this data to estimate costs through regression analysis and interpret the regression output, including identifying potential problems with regression data like nonlinear relationships, outliers, and spurious relationships. The overall document provides an overview of cost estimation techniques and applying them to a case example.
Data Analytics Project_Eun Seuk Choi (Eric)
This document describes a linear regression analysis conducted to predict NBA players' wins contributed (WINS) using minutes played (M), games played (GP), offensive rating (ORPM), and defensive rating (DRPM). The final model was WINS~GP+M+ORPM+DRPM, which had an R^2 of 0.8575. Cross-validation showed the model predicted out-of-sample data well. The analysis found ORPM was most predictive of WINS based on its confidence interval not containing 0.
final
This document analyzes the post-earnings announcement drift (PEAD) effect using stock market data from 1995 to 2000. The author finds that: 1) PEAD does exist as stocks continue drifting in the direction of earnings surprises for weeks after announcements; 2) The magnitude of PEAD increases with the size of the earnings surprise; and 3) PEAD is also related to other factors like firm size, book-to-market ratio, and past stock performance. Regression analysis confirms the relationships between PEAD, earnings surprises, and other financial variables.
An Empirical Investigation Of The Arbitrage Pricing Theory
The study empirically tests the Arbitrage Pricing Theory (APT) developed by Ross in 1976 using daily stock return data from 1962-1972. It finds:
1) Factor analysis identifies 5 factors that explain stock returns within industry groups, supporting the APT.
2) Cross-sectional regressions show factor loadings can explain expected stock returns, as the APT predicts.
3) Adding total return variance to the regressions does not eliminate the explanatory power of factor loadings, supporting the APT over alternatives.
4) Tests across industry groups find no evidence factor structures differ, as the APT assumes consistent factors across stocks.
IRJET- Effecient Support Itemset Mining using Parallel Map Reducing
This document presents a study on using parallel MapReduce algorithms for efficient frequent itemset mining on high-dimensional datasets. It first summarizes existing frequent itemset mining algorithms like Apriori, Predictive Apriori, and Filtered Associator and their limitations in handling high-dimensional data due to the "curse of dimensionality." It then proposes using a parallel MapReduce approach and evaluates its performance on a high-dimensional dataset, showing improvements in execution time, load balancing, and robustness over the other algorithms. Experimental results demonstrate the efficiency of the proposed MapReduce algorithm for mining high-dimensional data.
Luis_Ramon_Report.doc
The document describes the phases of a data mining project on predicting home insurance purchases. It analyzes customer data using various techniques, creates new variables, selects the top predictive variables, and generates models. The best model was one where the cost of false negatives was 10 times the cost of false positives, as it had the lowest overall cost and highest return on investment. This model will be deployed.
Nfl injury final deck
The document analyzes NFL injury data to explore differences in injury rates between natural and synthetic turf fields. It finds:
1) Injured players had slightly different movement patterns than uninjured players, though the differences were not statistically significant.
2) Field type was a significant predictor of injury, with synthetic turf associated with higher injury rates.
3) A combination of movement metrics and field type provided the best prediction of injury risk in statistical models.
Common evaluation measures in NLP and IR
This document discusses various evaluation measures used in information retrieval and natural language processing. It describes precision, recall, and the F1 score as fundamental measures for unranked retrieval sets. It also covers averaged precision and recall, accuracy, novelty and coverage ratios. For ranked retrieval sets, it discusses recall-precision graphs, interpolated recall-precision, precision at k, R-precision, ROC curves, and normalized discounted cumulative gain (NDCG). The document also discusses agreement measures like Kappa statistics and parses evaluation measures like Parseval and attachment scores.
Real Estate Investment Advising Using Machine Learning
This document presents a comparative study of machine learning algorithms for real estate investment advising using property price prediction. It analyzes Linear Regression using gradient descent, K-Nearest Neighbors regression, and Random Forest regression on quarterly Mumbai real estate data from 2005-2016. Features like area, rooms, distance to landmarks, amenities are used to predict prices. Random Forest regression achieved the lowest errors in predicting testing data, making it the most feasible algorithm according to the study. The authors conclude it is a promising approach for real estate trend forecasting and developing an investment advising tool.
Factors affecting customer satisfaction
The objective of the project is to use the dataset 'Factor-Hair-Revised.csv' to build an optimum regression model to predict satisfaction.
Perform exploratory data analysis on the dataset. Showcase some charts, graphs. Check for outliers and missing values.
Check evidence of multicollinearity.
Perform simple linear regression for the dependent variable with every independent variable.
Perform PCA/Factor analysis by extracting 4 factors. Interpret the output and name the Factors.
Perform Multiple linear regression with customer satisfaction as dependent variables and the four factors as independent variables.
IRJET- Supervised Learning Classification Algorithms Comparison
This document compares several supervised machine learning classification algorithms on a Titanic dataset: Logistic Regression, K-Nearest Neighbors, Decision Tree, Random Forest, Support Vector Machine, and Naive Bayes. It finds that Random Forest achieves the highest accuracy. Evaluation metrics like precision, recall, F1-score, and accuracy are used to evaluate and compare model performance on test data.
IRJET- Supervised Learning Classification Algorithms Comparison
This document compares several supervised machine learning classification algorithms on a Titanic dataset: Logistic Regression, K-Nearest Neighbors, Decision Tree, Random Forest, Support Vector Machine, and Naive Bayes. It finds that Random Forest achieves the highest accuracy. It preprocesses the dataset, trains models on a training set, and evaluates them using metrics like precision, recall, and F1-score calculated from the confusion matrix on a test set.
Chapter iv
The document discusses various methods for describing and exploring data, including dot plots, stem-and-leaf displays, percentiles, box plots, and skewness. It provides examples of each method using sample data sets and step-by-step calculations. Contingency tables are also introduced as a way to study relationships between nominal or ordinal variables.
Perfmeasure.ppt
This document discusses performance evaluation of investments and portfolios. It covers the following key points in 3 sentences:
Abnormal performance is measured against benchmarks adjusted for market and risk factors. Various risk-adjusted return measures are used, including the Sharpe Ratio, Treynor Ratio, and Jensen's Alpha, to evaluate performance based on different investment assumptions. Performance attribution decomposes overall returns into components related to allocation decisions, security selection, and market conditions to explain sources of performance differences from a benchmark.
APT_&_VaR[1]
The document discusses arbitrage pricing theory (APT) and compares it to the capital asset pricing model (CAPM). It presents the results of regressing stock returns on various economic factors to test the predictions of APT. The key results are:
1) The economic factors used in the APT model were not statistically significant determinants of stock returns, contrary to what APT predicts.
2) Only the market beta was a highly significant determinant of returns, supporting CAPM theory.
3) The residuals from the single-factor CAPM model show signs of autocorrelation and heteroskedasticity, suggesting omitted variables.
The document concludes the results are inconclusive between APT and
Engineering Economy : Decisions-Recognizing-Risks
Decision Recognizing Risk_Engineering Economy Topic 5
RDataMining slides-regression-classification
The document describes building regression and classification models in R, including linear regression, generalized linear models, decision trees, and random forests. It uses examples of CPI data to demonstrate linear regression and predicts CPI values in 2011. For classification, it builds a decision tree model on the iris dataset using the party package and visualizes the tree. The document provides information on evaluating and comparing different models.
Chapter 04
This chapter discusses various methods for summarizing and exploring data, including dot plots, stem-and-leaf displays, percentiles, box plots, and scatter plots. Dot plots and stem-and-leaf displays organize data in a way that shows the distribution while maintaining each data point. Percentiles such as the median and quartiles divide data into equal portions. Box plots graphically show the center, spread, and outliers of data. Scatter plots reveal relationships between two variables, while contingency tables summarize categorical data relationships.
Tutorial 8 Solutions.docx
This document discusses methods for estimating key inputs used to calculate the weighted average cost of capital (WACC) for a company. It evaluates different approaches to estimating beta, the risk-free rate, and equity market risk premium based on regression analysis of stock return data. For the company in question, CSR, it selects a beta of 1.15 based on 3 years of weekly return data. The risk-free rate is taken as the 10-year government bond yield of 3.37% geometrically averaged over 4 years. The equity risk premium is estimated to be 8.88% based on the accumulation index return over the same period. This yields an estimated cost of equity of 13.58% and overall WACC cannot be
creditriskmanagment_howardhaughton121510
CreditRisk+ is a method for quantifying the probability of loss distributions and risk measures like Value at Risk for loan portfolios. It generates loss distributions based on probability generating functions and models defaults as independent Poisson processes. The document outlines the theoretical framework and assumptions of CreditRisk+, including how to model exposure bands, default correlations, and aggregate loans from multiple borrowers.
High Performance Decision Tree Optimization within a Deep Learning Framework ...
High Performance Decision Tree Optimization within a Deep Learning Framework for Investment and Risk Management
Forecasting Stock Market using Multiple Linear Regression
This document discusses using multiple linear regression to predict stock market prices based on interest rates and unemployment rates. It presents sample data and uses the statistical software SPSS and Python to conduct a multiple linear regression analysis. The analysis finds that interest rates and unemployment rates significantly influence stock market prices, with rates explaining 90% of price variance. The regression output is used to generate an equation to forecast stock prices based on interest and unemployment rate values.
Statistical Model to Predict IPO Prices for Semiconductor
This study aims to create a statistical model to predict IPO prices for companies in the semiconductor and semiconductor equipment industry. The researchers collected data on various financial metrics for 159 firms from FactSet and used regression analysis to determine relationships between potential independent variables like book value, profitability, and dividend metrics, and dependent variable of stock price. The best-fitting model found cash flow per share and book value per share as most predictive of price, with dividend per share also found significant based on t-statistics. The study concludes the gamma model with these variables is optimal for predicting IPO prices in this industry.
H354549
This document summarizes a study that examines the production efficiency of smallholder chicken farms in Northwestern Vietnam using data envelopment analysis. The study finds that the average efficiency of chicken farms is relatively low, indicating room for improvement. Scale efficiency is about 90% on average, so farms cannot gain much efficiency through upscaling. Household characteristics like total land owned and vocational training influence efficiency, but other factors do not. The study uses data from Vietnam household surveys on 335 smallholder farms, analyzing efficiency based on inputs like costs and outputs like chicken meat and egg value.
Bbs11 ppt ch14
This document provides an overview of multiple regression analysis. It introduces the concept of using multiple independent variables (X1, X2, etc.) to predict a dependent variable (Y) through a regression equation. It presents examples using Excel and Minitab to estimate the regression coefficients and other measures from sample data. Key outputs include the regression equation, R-squared (proportion of variation in Y explained by the X's), adjusted R-squared (penalized for additional variables), and an F-test to determine if the overall regression model is statistically significant.
Regression and Classification with R
This document discusses building regression and classification models in R, including linear regression, generalized linear models, and decision trees. It provides examples of building each type of model using various R packages and datasets. Linear regression is used to predict CPI data. Generalized linear models and decision trees are built to predict body fat percentage. Decision trees are also built on the iris dataset to classify flower species.
Effects of dividends on common stock prices the nepalese evidence
presentation on effects of dividends on common stock prices in the nepelese evidence paper was was published by prof. rade shyam pradhan in the the excellence
1 chapter 04
This chapter discusses various methods for describing and exploring quantitative data, including dot plots, stem-and-leaf displays, percentiles, box plots, measures of skewness, scatter diagrams, and contingency tables. It provides examples and explanations of how to construct and interpret each method. Key goals are to develop an understanding of distributions and relationships within data sets.
一比一原版(UCSF文凭证书)旧金山分校毕业证如何办理
毕业原版【微信:176555708】【(UCSF毕业证书)旧金山分校毕业证】【微信:176555708】成绩单、外壳、offer、留信学历认证(永久存档真实可查)采用学校原版纸张、特殊工艺完全按照原版一比一制作(包括:隐形水印,阴影底纹,钢印LOGO烫金烫银,LOGO烫金烫银复合重叠,文字图案浮雕,激光镭射,紫外荧光,温感,复印防伪)行业标杆!精益求精,诚心合作,真诚制作!多年品质 ,按需精细制作,24小时接单,全套进口原装设备,十五年致力于帮助留学生解决难题,业务范围有加拿大、英国、澳洲、韩国、美国、新加坡,新西兰等学历材料,包您满意。
【我们承诺采用的是学校原版纸张(纸质、底色、纹路),我们拥有全套进口原装设备,特殊工艺都是采用不同机器制作,仿真度基本可以达到100%,所有工艺效果都可提前给客户展示,不满意可以根据客户要求进行调整,直到满意为止!】
【业务选择办理准则】
一、工作未确定,回国需先给父母、亲戚朋友看下文凭的情况,办理一份就读学校的毕业证【微信176555708】文凭即可
二、回国进私企、外企、自己做生意的情况,这些单位是不查询毕业证真伪的,而且国内没有渠道去查询国外文凭的真假,也不需要提供真实教育部认证。鉴于此,办理一份毕业证【微信176555708】即可
三、进国企,银行,事业单位,考公务员等等,这些单位是必需要提供真实教育部认证的,办理教育部认证所需资料众多且烦琐,所有材料您都必须提供原件,我们凭借丰富的经验,快捷的绿色通道帮您快速整合材料,让您少走弯路。
留信网认证的作用:
1:该专业认证可证明留学生真实身份
2:同时对留学生所学专业登记给予评定
3:国家专业人才认证中心颁发入库证书
4:这个认证书并且可以归档倒地方
5:凡事获得留信网入网的信息将会逐步更新到个人身份内,将在公安局网内查询个人身份证信息后,同步读取人才网入库信息
6:个人职称评审加20分
7:个人信誉贷款加10分
8:在国家人才网主办的国家网络招聘大会中纳入资料,供国家高端企业选择人才
留信网服务项目:
1、留学生专业人才库服务(留信分析)
2、国(境)学习人员提供就业推荐信服务
3、留学人员区块链存储服务
→ 【关于价格问题(保证一手价格)】
我们所定的价格是非常合理的,而且我们现在做得单子大多数都是代理和回头客户介绍的所以一般现在有新的单子 我给客户的都是第一手的代理价格,因为我想坦诚对待大家 不想跟大家在价格方面浪费时间
对于老客户或者被老客户介绍过来的朋友,我们都会适当给一些优惠。
选择实体注册公司办理,更放心,更安全!我们的承诺:客户在留信官方认证查询网站查询到认证通过结果后付款,不成功不收费!
一比一原版爱尔兰都柏林大学毕业证(本硕)ucd学位证书如何办理
原版一模一样【微信:741003700 】【爱尔兰都柏林大学毕业证(本硕)ucd成绩单】【微信:741003700 】学位证,留信认证(真实可查,永久存档)原件一模一样纸张工艺/offer、雅思、外壳等材料/诚信可靠,可直接看成品样本,帮您解决无法毕业带来的各种难题!外壳,原版制作,诚信可靠,可直接看成品样本。行业标杆!精益求精,诚心合作,真诚制作!多年品质 ,按需精细制作,24小时接单,全套进口原装设备。十五年致力于帮助留学生解决难题,包您满意。
本公司拥有海外各大学样板无数,能完美还原。
1:1完美还原海外各大学毕业材料上的工艺:水印,阴影底纹,钢印LOGO烫金烫银,LOGO烫金烫银复合重叠。文字图案浮雕、激光镭射、紫外荧光、温感、复印防伪等防伪工艺。材料咨询办理、认证咨询办理请加学历顾问Q/微741003700
【主营项目】
一.毕业证【q微741003700】成绩单、使馆认证、教育部认证、雅思托福成绩单、学生卡等!
二.真实使馆公证(即留学回国人员证明,不成功不收费)
三.真实教育部学历学位认证(教育部存档!教育部留服网站永久可查)
四.办理各国各大学文凭(一对一专业服务,可全程监控跟踪进度)
如果您处于以下几种情况:
◇在校期间,因各种原因未能顺利毕业……拿不到官方毕业证【q/微741003700】
◇面对父母的压力,希望尽快拿到;
◇不清楚认证流程以及材料该如何准备;
◇回国时间很长,忘记办理;
◇回国马上就要找工作,办给用人单位看;
◇企事业单位必须要求办理的
◇需要报考公务员、购买免税车、落转户口
◇申请留学生创业基金
留信网认证的作用:
1:该专业认证可证明留学生真实身份
2:同时对留学生所学专业登记给予评定
3:国家专业人才认证中心颁发入库证书
4:这个认证书并且可以归档倒地方
5:凡事获得留信网入网的信息将会逐步更新到个人身份内,将在公安局网内查询个人身份证信息后,同步读取人才网入库信息
6:个人职称评审加20分
7:个人信誉贷款加10分
8:在国家人才网主办的国家网络招聘大会中纳入资料,供国家高端企业选择人才
办理爱尔兰都柏林大学毕业证(本硕)ucd学位证书【微信:741003700 】外观非常简单,由纸质材料制成,上面印有校徽、校名、毕业生姓名、专业等信息。
办理爱尔兰都柏林大学毕业证(本硕)ucd学位证书【微信:741003700 】格式相对统一,各专业都有相应的模板。通常包括以下部分:
校徽:象征着学校的荣誉和传承。
校名:学校英文全称
授予学位:本部分将注明获得的具体学位名称。
毕业生姓名:这是最重要的信息之一,标志着该证书是由特定人员获得的。
颁发日期:这是毕业正式生效的时间,也代表着毕业生学业的结束。
其他信息:根据不同的专业和学位,可能会有一些特定的信息或章节。
办理爱尔兰都柏林大学毕业证(本硕)ucd学位证书【微信:741003700 】价值很高,需要妥善保管。一般来说,应放置在安全、干燥、防潮的地方,避免长时间暴露在阳光下。如需使用,最好使用复印件而不是原件,以免丢失。
综上所述,办理爱尔兰都柏林大学毕业证(本硕)ucd学位证书【微信:741003700 】是证明身份和学历的高价值文件。外观简单庄重,格式统一,包括重要的个人信息和发布日期。对持有人来说,妥善保管是非常重要的。
More Related Content
Similar to Statistical Analysis Project
Real Estate Investment Advising Using Machine Learning
This document presents a comparative study of machine learning algorithms for real estate investment advising using property price prediction. It analyzes Linear Regression using gradient descent, K-Nearest Neighbors regression, and Random Forest regression on quarterly Mumbai real estate data from 2005-2016. Features like area, rooms, distance to landmarks, amenities are used to predict prices. Random Forest regression achieved the lowest errors in predicting testing data, making it the most feasible algorithm according to the study. The authors conclude it is a promising approach for real estate trend forecasting and developing an investment advising tool.
Factors affecting customer satisfaction
The objective of the project is to use the dataset 'Factor-Hair-Revised.csv' to build an optimum regression model to predict satisfaction.
Perform exploratory data analysis on the dataset. Showcase some charts, graphs. Check for outliers and missing values.
Check evidence of multicollinearity.
Perform simple linear regression for the dependent variable with every independent variable.
Perform PCA/Factor analysis by extracting 4 factors. Interpret the output and name the Factors.
Perform Multiple linear regression with customer satisfaction as dependent variables and the four factors as independent variables.
IRJET- Supervised Learning Classification Algorithms Comparison
This document compares several supervised machine learning classification algorithms on a Titanic dataset: Logistic Regression, K-Nearest Neighbors, Decision Tree, Random Forest, Support Vector Machine, and Naive Bayes. It finds that Random Forest achieves the highest accuracy. Evaluation metrics like precision, recall, F1-score, and accuracy are used to evaluate and compare model performance on test data.
IRJET- Supervised Learning Classification Algorithms Comparison
This document compares several supervised machine learning classification algorithms on a Titanic dataset: Logistic Regression, K-Nearest Neighbors, Decision Tree, Random Forest, Support Vector Machine, and Naive Bayes. It finds that Random Forest achieves the highest accuracy. It preprocesses the dataset, trains models on a training set, and evaluates them using metrics like precision, recall, and F1-score calculated from the confusion matrix on a test set.
Chapter iv
The document discusses various methods for describing and exploring data, including dot plots, stem-and-leaf displays, percentiles, box plots, and skewness. It provides examples of each method using sample data sets and step-by-step calculations. Contingency tables are also introduced as a way to study relationships between nominal or ordinal variables.
Perfmeasure.ppt
This document discusses performance evaluation of investments and portfolios. It covers the following key points in 3 sentences:
Abnormal performance is measured against benchmarks adjusted for market and risk factors. Various risk-adjusted return measures are used, including the Sharpe Ratio, Treynor Ratio, and Jensen's Alpha, to evaluate performance based on different investment assumptions. Performance attribution decomposes overall returns into components related to allocation decisions, security selection, and market conditions to explain sources of performance differences from a benchmark.
APT_&_VaR[1]
The document discusses arbitrage pricing theory (APT) and compares it to the capital asset pricing model (CAPM). It presents the results of regressing stock returns on various economic factors to test the predictions of APT. The key results are:
1) The economic factors used in the APT model were not statistically significant determinants of stock returns, contrary to what APT predicts.
2) Only the market beta was a highly significant determinant of returns, supporting CAPM theory.
3) The residuals from the single-factor CAPM model show signs of autocorrelation and heteroskedasticity, suggesting omitted variables.
The document concludes the results are inconclusive between APT and
Engineering Economy : Decisions-Recognizing-Risks
Decision Recognizing Risk_Engineering Economy Topic 5
RDataMining slides-regression-classification
The document describes building regression and classification models in R, including linear regression, generalized linear models, decision trees, and random forests. It uses examples of CPI data to demonstrate linear regression and predicts CPI values in 2011. For classification, it builds a decision tree model on the iris dataset using the party package and visualizes the tree. The document provides information on evaluating and comparing different models.
Chapter 04
This chapter discusses various methods for summarizing and exploring data, including dot plots, stem-and-leaf displays, percentiles, box plots, and scatter plots. Dot plots and stem-and-leaf displays organize data in a way that shows the distribution while maintaining each data point. Percentiles such as the median and quartiles divide data into equal portions. Box plots graphically show the center, spread, and outliers of data. Scatter plots reveal relationships between two variables, while contingency tables summarize categorical data relationships.
Tutorial 8 Solutions.docx
This document discusses methods for estimating key inputs used to calculate the weighted average cost of capital (WACC) for a company. It evaluates different approaches to estimating beta, the risk-free rate, and equity market risk premium based on regression analysis of stock return data. For the company in question, CSR, it selects a beta of 1.15 based on 3 years of weekly return data. The risk-free rate is taken as the 10-year government bond yield of 3.37% geometrically averaged over 4 years. The equity risk premium is estimated to be 8.88% based on the accumulation index return over the same period. This yields an estimated cost of equity of 13.58% and overall WACC cannot be
creditriskmanagment_howardhaughton121510
CreditRisk+ is a method for quantifying the probability of loss distributions and risk measures like Value at Risk for loan portfolios. It generates loss distributions based on probability generating functions and models defaults as independent Poisson processes. The document outlines the theoretical framework and assumptions of CreditRisk+, including how to model exposure bands, default correlations, and aggregate loans from multiple borrowers.
High Performance Decision Tree Optimization within a Deep Learning Framework ...
High Performance Decision Tree Optimization within a Deep Learning Framework for Investment and Risk Management
Forecasting Stock Market using Multiple Linear Regression
This document discusses using multiple linear regression to predict stock market prices based on interest rates and unemployment rates. It presents sample data and uses the statistical software SPSS and Python to conduct a multiple linear regression analysis. The analysis finds that interest rates and unemployment rates significantly influence stock market prices, with rates explaining 90% of price variance. The regression output is used to generate an equation to forecast stock prices based on interest and unemployment rate values.
Statistical Model to Predict IPO Prices for Semiconductor
This study aims to create a statistical model to predict IPO prices for companies in the semiconductor and semiconductor equipment industry. The researchers collected data on various financial metrics for 159 firms from FactSet and used regression analysis to determine relationships between potential independent variables like book value, profitability, and dividend metrics, and dependent variable of stock price. The best-fitting model found cash flow per share and book value per share as most predictive of price, with dividend per share also found significant based on t-statistics. The study concludes the gamma model with these variables is optimal for predicting IPO prices in this industry.
H354549
This document summarizes a study that examines the production efficiency of smallholder chicken farms in Northwestern Vietnam using data envelopment analysis. The study finds that the average efficiency of chicken farms is relatively low, indicating room for improvement. Scale efficiency is about 90% on average, so farms cannot gain much efficiency through upscaling. Household characteristics like total land owned and vocational training influence efficiency, but other factors do not. The study uses data from Vietnam household surveys on 335 smallholder farms, analyzing efficiency based on inputs like costs and outputs like chicken meat and egg value.
Bbs11 ppt ch14
This document provides an overview of multiple regression analysis. It introduces the concept of using multiple independent variables (X1, X2, etc.) to predict a dependent variable (Y) through a regression equation. It presents examples using Excel and Minitab to estimate the regression coefficients and other measures from sample data. Key outputs include the regression equation, R-squared (proportion of variation in Y explained by the X's), adjusted R-squared (penalized for additional variables), and an F-test to determine if the overall regression model is statistically significant.
Regression and Classification with R
This document discusses building regression and classification models in R, including linear regression, generalized linear models, and decision trees. It provides examples of building each type of model using various R packages and datasets. Linear regression is used to predict CPI data. Generalized linear models and decision trees are built to predict body fat percentage. Decision trees are also built on the iris dataset to classify flower species.
Effects of dividends on common stock prices the nepalese evidence
presentation on effects of dividends on common stock prices in the nepelese evidence paper was was published by prof. rade shyam pradhan in the the excellence
1 chapter 04
This chapter discusses various methods for describing and exploring quantitative data, including dot plots, stem-and-leaf displays, percentiles, box plots, measures of skewness, scatter diagrams, and contingency tables. It provides examples and explanations of how to construct and interpret each method. Key goals are to develop an understanding of distributions and relationships within data sets.
Similar to Statistical Analysis Project (20)
Real Estate Investment Advising Using Machine Learning
Real Estate Investment Advising Using Machine Learning
IRJET- Supervised Learning Classification Algorithms Comparison
IRJET- Supervised Learning Classification Algorithms Comparison
IRJET- Supervised Learning Classification Algorithms Comparison
IRJET- Supervised Learning Classification Algorithms Comparison
High Performance Decision Tree Optimization within a Deep Learning Framework ...
High Performance Decision Tree Optimization within a Deep Learning Framework ...
Forecasting Stock Market using Multiple Linear Regression
Forecasting Stock Market using Multiple Linear Regression
Statistical Model to Predict IPO Prices for Semiconductor
Statistical Model to Predict IPO Prices for Semiconductor
Effects of dividends on common stock prices the nepalese evidence
Effects of dividends on common stock prices the nepalese evidence
Recently uploaded
一比一原版(UCSF文凭证书)旧金山分校毕业证如何办理
毕业原版【微信:176555708】【(UCSF毕业证书)旧金山分校毕业证】【微信:176555708】成绩单、外壳、offer、留信学历认证(永久存档真实可查)采用学校原版纸张、特殊工艺完全按照原版一比一制作(包括:隐形水印,阴影底纹,钢印LOGO烫金烫银,LOGO烫金烫银复合重叠,文字图案浮雕,激光镭射,紫外荧光,温感,复印防伪)行业标杆!精益求精,诚心合作,真诚制作!多年品质 ,按需精细制作,24小时接单,全套进口原装设备,十五年致力于帮助留学生解决难题,业务范围有加拿大、英国、澳洲、韩国、美国、新加坡,新西兰等学历材料,包您满意。
【我们承诺采用的是学校原版纸张(纸质、底色、纹路),我们拥有全套进口原装设备,特殊工艺都是采用不同机器制作,仿真度基本可以达到100%,所有工艺效果都可提前给客户展示,不满意可以根据客户要求进行调整,直到满意为止!】
【业务选择办理准则】
一、工作未确定,回国需先给父母、亲戚朋友看下文凭的情况,办理一份就读学校的毕业证【微信176555708】文凭即可
二、回国进私企、外企、自己做生意的情况,这些单位是不查询毕业证真伪的,而且国内没有渠道去查询国外文凭的真假,也不需要提供真实教育部认证。鉴于此,办理一份毕业证【微信176555708】即可
三、进国企,银行,事业单位,考公务员等等,这些单位是必需要提供真实教育部认证的,办理教育部认证所需资料众多且烦琐,所有材料您都必须提供原件,我们凭借丰富的经验,快捷的绿色通道帮您快速整合材料,让您少走弯路。
留信网认证的作用:
1:该专业认证可证明留学生真实身份
2:同时对留学生所学专业登记给予评定
3:国家专业人才认证中心颁发入库证书
4:这个认证书并且可以归档倒地方
5:凡事获得留信网入网的信息将会逐步更新到个人身份内,将在公安局网内查询个人身份证信息后,同步读取人才网入库信息
6:个人职称评审加20分
7:个人信誉贷款加10分
8:在国家人才网主办的国家网络招聘大会中纳入资料,供国家高端企业选择人才
留信网服务项目:
1、留学生专业人才库服务(留信分析)
2、国(境)学习人员提供就业推荐信服务
3、留学人员区块链存储服务
→ 【关于价格问题(保证一手价格)】
我们所定的价格是非常合理的,而且我们现在做得单子大多数都是代理和回头客户介绍的所以一般现在有新的单子 我给客户的都是第一手的代理价格,因为我想坦诚对待大家 不想跟大家在价格方面浪费时间
对于老客户或者被老客户介绍过来的朋友,我们都会适当给一些优惠。
选择实体注册公司办理,更放心,更安全!我们的承诺:客户在留信官方认证查询网站查询到认证通过结果后付款,不成功不收费!
一比一原版爱尔兰都柏林大学毕业证(本硕)ucd学位证书如何办理
原版一模一样【微信:741003700 】【爱尔兰都柏林大学毕业证(本硕)ucd成绩单】【微信:741003700 】学位证,留信认证(真实可查,永久存档)原件一模一样纸张工艺/offer、雅思、外壳等材料/诚信可靠,可直接看成品样本,帮您解决无法毕业带来的各种难题!外壳,原版制作,诚信可靠,可直接看成品样本。行业标杆!精益求精,诚心合作,真诚制作!多年品质 ,按需精细制作,24小时接单,全套进口原装设备。十五年致力于帮助留学生解决难题,包您满意。
本公司拥有海外各大学样板无数,能完美还原。
1:1完美还原海外各大学毕业材料上的工艺:水印,阴影底纹,钢印LOGO烫金烫银,LOGO烫金烫银复合重叠。文字图案浮雕、激光镭射、紫外荧光、温感、复印防伪等防伪工艺。材料咨询办理、认证咨询办理请加学历顾问Q/微741003700
【主营项目】
一.毕业证【q微741003700】成绩单、使馆认证、教育部认证、雅思托福成绩单、学生卡等!
二.真实使馆公证(即留学回国人员证明,不成功不收费)
三.真实教育部学历学位认证(教育部存档!教育部留服网站永久可查)
四.办理各国各大学文凭(一对一专业服务,可全程监控跟踪进度)
如果您处于以下几种情况:
◇在校期间,因各种原因未能顺利毕业……拿不到官方毕业证【q/微741003700】
◇面对父母的压力,希望尽快拿到;
◇不清楚认证流程以及材料该如何准备;
◇回国时间很长,忘记办理;
◇回国马上就要找工作,办给用人单位看;
◇企事业单位必须要求办理的
◇需要报考公务员、购买免税车、落转户口
◇申请留学生创业基金
留信网认证的作用:
1:该专业认证可证明留学生真实身份
2:同时对留学生所学专业登记给予评定
3:国家专业人才认证中心颁发入库证书
4:这个认证书并且可以归档倒地方
5:凡事获得留信网入网的信息将会逐步更新到个人身份内,将在公安局网内查询个人身份证信息后,同步读取人才网入库信息
6:个人职称评审加20分
7:个人信誉贷款加10分
8:在国家人才网主办的国家网络招聘大会中纳入资料,供国家高端企业选择人才
办理爱尔兰都柏林大学毕业证(本硕)ucd学位证书【微信:741003700 】外观非常简单,由纸质材料制成,上面印有校徽、校名、毕业生姓名、专业等信息。
办理爱尔兰都柏林大学毕业证(本硕)ucd学位证书【微信:741003700 】格式相对统一,各专业都有相应的模板。通常包括以下部分:
校徽:象征着学校的荣誉和传承。
校名:学校英文全称
授予学位:本部分将注明获得的具体学位名称。
毕业生姓名:这是最重要的信息之一,标志着该证书是由特定人员获得的。
颁发日期:这是毕业正式生效的时间,也代表着毕业生学业的结束。
其他信息:根据不同的专业和学位,可能会有一些特定的信息或章节。
办理爱尔兰都柏林大学毕业证(本硕)ucd学位证书【微信:741003700 】价值很高,需要妥善保管。一般来说,应放置在安全、干燥、防潮的地方,避免长时间暴露在阳光下。如需使用,最好使用复印件而不是原件,以免丢失。
综上所述,办理爱尔兰都柏林大学毕业证(本硕)ucd学位证书【微信:741003700 】是证明身份和学历的高价值文件。外观简单庄重,格式统一,包括重要的个人信息和发布日期。对持有人来说,妥善保管是非常重要的。
Predictably Improve Your B2B Tech Company's Performance by Leveraging Data
Harness the power of AI-backed reports, benchmarking and data analysis to predict trends and detect anomalies in your marketing efforts.
Peter Caputa, CEO at Databox, reveals how you can discover the strategies and tools to increase your growth rate (and margins!).
From metrics to track to data habits to pick up, enhance your reporting for powerful insights to improve your B2B tech company's marketing.
- - -
This is the webinar recording from the June 2024 HubSpot User Group (HUG) for B2B Technology USA.
Watch the video recording at https://youtu.be/5vjwGfPN9lw
Sign up for future HUG events at https://events.hubspot.com/b2b-technology-usa/
DSSML24_tspann_CodelessGenerativeAIPipelines
Codeless Generative AI Pipelines
(GenAI with Milvus)
https://ml.dssconf.pl/user.html#!/lecture/DSSML24-041a/rate
Discover the potential of real-time streaming in the context of GenAI as we delve into the intricacies of Apache NiFi and its capabilities. Learn how this tool can significantly simplify the data engineering workflow for GenAI applications, allowing you to focus on the creative aspects rather than the technical complexities. I will guide you through practical examples and use cases, showing the impact of automation on prompt building. From data ingestion to transformation and delivery, witness how Apache NiFi streamlines the entire pipeline, ensuring a smooth and hassle-free experience.
Timothy Spann
https://www.youtube.com/@FLaNK-Stack
https://medium.com/@tspann
https://www.datainmotion.dev/
milvus, unstructured data, vector database, zilliz, cloud, vectors, python, deep learning, generative ai, genai, nifi, kafka, flink, streaming, iot, edge
Orchestrating the Future: Navigating Today's Data Workflow Challenges with Ai...
Navigating today's data landscape isn't just about managing workflows; it's about strategically propelling your business forward. Apache Airflow has stood out as the benchmark in this arena, driving data orchestration forward since its early days. As we dive into the complexities of our current data-rich environment, where the sheer volume of information and its timely, accurate processing are crucial for AI and ML applications, the role of Airflow has never been more critical.
In my journey as the Senior Engineering Director and a pivotal member of Apache Airflow's Project Management Committee (PMC), I've witnessed Airflow transform data handling, making agility and insight the norm in an ever-evolving digital space. At Astronomer, our collaboration with leading AI & ML teams worldwide has not only tested but also proven Airflow's mettle in delivering data reliably and efficiently—data that now powers not just insights but core business functions.
This session is a deep dive into the essence of Airflow's success. We'll trace its evolution from a budding project to the backbone of data orchestration it is today, constantly adapting to meet the next wave of data challenges, including those brought on by Generative AI. It's this forward-thinking adaptability that keeps Airflow at the forefront of innovation, ready for whatever comes next.
The ever-growing demands of AI and ML applications have ushered in an era where sophisticated data management isn't a luxury—it's a necessity. Airflow's innate flexibility and scalability are what makes it indispensable in managing the intricate workflows of today, especially those involving Large Language Models (LLMs).
This talk isn't just a rundown of Airflow's features; it's about harnessing these capabilities to turn your data workflows into a strategic asset. Together, we'll explore how Airflow remains at the cutting edge of data orchestration, ensuring your organization is not just keeping pace but setting the pace in a data-driven future.
Session in https://budapestdata.hu/2024/04/kaxil-naik-astronomer-io/ | https://dataml24.sessionize.com/session/667627
一比一原版澳洲西澳大学毕业证(uwa毕业证书)如何办理
原版一模一样【微信:741003700 】【澳洲西澳大学毕业证(uwa毕业证书)成绩单】【微信:741003700 】学位证,留信认证(真实可查,永久存档)原件一模一样纸张工艺/offer、雅思、外壳等材料/诚信可靠,可直接看成品样本,帮您解决无法毕业带来的各种难题!外壳,原版制作,诚信可靠,可直接看成品样本。行业标杆!精益求精,诚心合作,真诚制作!多年品质 ,按需精细制作,24小时接单,全套进口原装设备。十五年致力于帮助留学生解决难题,包您满意。
本公司拥有海外各大学样板无数,能完美还原。
1:1完美还原海外各大学毕业材料上的工艺:水印,阴影底纹,钢印LOGO烫金烫银,LOGO烫金烫银复合重叠。文字图案浮雕、激光镭射、紫外荧光、温感、复印防伪等防伪工艺。材料咨询办理、认证咨询办理请加学历顾问Q/微741003700
【主营项目】
一.毕业证【q微741003700】成绩单、使馆认证、教育部认证、雅思托福成绩单、学生卡等!
二.真实使馆公证(即留学回国人员证明,不成功不收费)
三.真实教育部学历学位认证(教育部存档!教育部留服网站永久可查)
四.办理各国各大学文凭(一对一专业服务,可全程监控跟踪进度)
如果您处于以下几种情况:
◇在校期间,因各种原因未能顺利毕业……拿不到官方毕业证【q/微741003700】
◇面对父母的压力,希望尽快拿到;
◇不清楚认证流程以及材料该如何准备;
◇回国时间很长,忘记办理;
◇回国马上就要找工作,办给用人单位看;
◇企事业单位必须要求办理的
◇需要报考公务员、购买免税车、落转户口
◇申请留学生创业基金
留信网认证的作用:
1:该专业认证可证明留学生真实身份
2:同时对留学生所学专业登记给予评定
3:国家专业人才认证中心颁发入库证书
4:这个认证书并且可以归档倒地方
5:凡事获得留信网入网的信息将会逐步更新到个人身份内,将在公安局网内查询个人身份证信息后,同步读取人才网入库信息
6:个人职称评审加20分
7:个人信誉贷款加10分
8:在国家人才网主办的国家网络招聘大会中纳入资料,供国家高端企业选择人才
办理澳洲西澳大学毕业证(uwa毕业证书)【微信:741003700 】外观非常简单,由纸质材料制成,上面印有校徽、校名、毕业生姓名、专业等信息。
办理澳洲西澳大学毕业证(uwa毕业证书)【微信:741003700 】格式相对统一,各专业都有相应的模板。通常包括以下部分:
校徽:象征着学校的荣誉和传承。
校名:学校英文全称
授予学位:本部分将注明获得的具体学位名称。
毕业生姓名:这是最重要的信息之一,标志着该证书是由特定人员获得的。
颁发日期:这是毕业正式生效的时间,也代表着毕业生学业的结束。
其他信息:根据不同的专业和学位,可能会有一些特定的信息或章节。
办理澳洲西澳大学毕业证(uwa毕业证书)【微信:741003700 】价值很高,需要妥善保管。一般来说,应放置在安全、干燥、防潮的地方,避免长时间暴露在阳光下。如需使用,最好使用复印件而不是原件,以免丢失。
综上所述,办理澳洲西澳大学毕业证(uwa毕业证书)【微信:741003700 】是证明身份和学历的高价值文件。外观简单庄重,格式统一,包括重要的个人信息和发布日期。对持有人来说,妥善保管是非常重要的。
一比一原版英国赫特福德大学毕业证(hertfordshire毕业证书)如何办理
原版一模一样【微信:741003700 】【英国赫特福德大学毕业证(hertfordshire毕业证书)成绩单】【微信:741003700 】学位证,留信认证(真实可查,永久存档)原件一模一样纸张工艺/offer、雅思、外壳等材料/诚信可靠,可直接看成品样本,帮您解决无法毕业带来的各种难题!外壳,原版制作,诚信可靠,可直接看成品样本。行业标杆!精益求精,诚心合作,真诚制作!多年品质 ,按需精细制作,24小时接单,全套进口原装设备。十五年致力于帮助留学生解决难题,包您满意。
本公司拥有海外各大学样板无数,能完美还原。
1:1完美还原海外各大学毕业材料上的工艺:水印,阴影底纹,钢印LOGO烫金烫银,LOGO烫金烫银复合重叠。文字图案浮雕、激光镭射、紫外荧光、温感、复印防伪等防伪工艺。材料咨询办理、认证咨询办理请加学历顾问Q/微741003700
【主营项目】
一.毕业证【q微741003700】成绩单、使馆认证、教育部认证、雅思托福成绩单、学生卡等!
二.真实使馆公证(即留学回国人员证明,不成功不收费)
三.真实教育部学历学位认证(教育部存档!教育部留服网站永久可查)
四.办理各国各大学文凭(一对一专业服务,可全程监控跟踪进度)
如果您处于以下几种情况:
◇在校期间,因各种原因未能顺利毕业……拿不到官方毕业证【q/微741003700】
◇面对父母的压力,希望尽快拿到;
◇不清楚认证流程以及材料该如何准备;
◇回国时间很长,忘记办理;
◇回国马上就要找工作,办给用人单位看;
◇企事业单位必须要求办理的
◇需要报考公务员、购买免税车、落转户口
◇申请留学生创业基金
留信网认证的作用:
1:该专业认证可证明留学生真实身份
2:同时对留学生所学专业登记给予评定
3:国家专业人才认证中心颁发入库证书
4:这个认证书并且可以归档倒地方
5:凡事获得留信网入网的信息将会逐步更新到个人身份内,将在公安局网内查询个人身份证信息后,同步读取人才网入库信息
6:个人职称评审加20分
7:个人信誉贷款加10分
8:在国家人才网主办的国家网络招聘大会中纳入资料,供国家高端企业选择人才
办理英国赫特福德大学毕业证(hertfordshire毕业证书)【微信:741003700 】外观非常简单,由纸质材料制成,上面印有校徽、校名、毕业生姓名、专业等信息。
办理英国赫特福德大学毕业证(hertfordshire毕业证书)【微信:741003700 】格式相对统一,各专业都有相应的模板。通常包括以下部分:
校徽:象征着学校的荣誉和传承。
校名:学校英文全称
授予学位:本部分将注明获得的具体学位名称。
毕业生姓名:这是最重要的信息之一,标志着该证书是由特定人员获得的。
颁发日期:这是毕业正式生效的时间,也代表着毕业生学业的结束。
其他信息:根据不同的专业和学位,可能会有一些特定的信息或章节。
办理英国赫特福德大学毕业证(hertfordshire毕业证书)【微信:741003700 】价值很高,需要妥善保管。一般来说,应放置在安全、干燥、防潮的地方,避免长时间暴露在阳光下。如需使用,最好使用复印件而不是原件,以免丢失。
综上所述,办理英国赫特福德大学毕业证(hertfordshire毕业证书)【微信:741003700 】是证明身份和学历的高价值文件。外观简单庄重,格式统一,包括重要的个人信息和发布日期。对持有人来说,妥善保管是非常重要的。
Jio cinema Retention & Engagement Strategy.pdf
Introduction to Jio Cinema**:
- Brief overview of Jio Cinema as a streaming platform.
- Its significance in the Indian market.
- Introduction to retention and engagement strategies in the streaming industry.
2. **Understanding Retention and Engagement**:
- Define retention and engagement in the context of streaming platforms.
- Importance of retaining users in a competitive market.
- Key metrics used to measure retention and engagement.
3. **Jio Cinema's Content Strategy**:
- Analysis of the content library offered by Jio Cinema.
- Focus on exclusive content, originals, and partnerships.
- Catering to diverse audience preferences (regional, genre-specific, etc.).
- User-generated content and interactive features.
4. **Personalization and Recommendation Algorithms**:
- How Jio Cinema leverages user data for personalized recommendations.
- Algorithmic strategies for suggesting content based on user preferences, viewing history, and behavior.
- Dynamic content curation to keep users engaged.
5. **User Experience and Interface Design**:
- Evaluation of Jio Cinema's user interface (UI) and user experience (UX).
- Accessibility features and device compatibility.
- Seamless navigation and search functionality.
- Integration with other Jio services.
6. **Community Building and Social Features**:
- Strategies for fostering a sense of community among users.
- User reviews, ratings, and comments.
- Social sharing and engagement features.
- Interactive events and campaigns.
7. **Retention through Loyalty Programs and Incentives**:
- Overview of loyalty programs and rewards offered by Jio Cinema.
- Subscription plans and benefits.
- Promotional offers, discounts, and partnerships.
- Gamification elements to encourage continued usage.
8. **Customer Support and Feedback Mechanisms**:
- Analysis of Jio Cinema's customer support infrastructure.
- Channels for user feedback and suggestions.
- Handling of user complaints and queries.
- Continuous improvement based on user feedback.
9. **Multichannel Engagement Strategies**:
- Utilization of multiple channels for user engagement (email, push notifications, SMS, etc.).
- Targeted marketing campaigns and promotions.
- Cross-promotion with other Jio services and partnerships.
- Integration with social media platforms.
10. **Data Analytics and Iterative Improvement**:
- Role of data analytics in understanding user behavior and preferences.
- A/B testing and experimentation to optimize engagement strategies.
- Iterative improvement based on data-driven insights.
原版一比一爱尔兰都柏林大学毕业证(UCD毕业证书)如何办理
原版制作【微信:41543339】【爱尔兰都柏林大学毕业证(UCD毕业证书)】【微信:41543339】《成绩单、外壳、雅思、offer、真实留信官方学历认证(永久存档/真实可查)》采用学校原版纸张、特殊工艺完全按照原版一比一制作(包括:隐形水印,阴影底纹,钢印LOGO烫金烫银,LOGO烫金烫银复合重叠,文字图案浮雕,激光镭射,紫外荧光,温感,复印防伪)行业标杆!精益求精,诚心合作,真诚制作!多年品质 ,按需精细制作,24小时接单,全套进口原装设备,十五年致力于帮助留学生解决难题,业务范围有加拿大、英国、澳洲、韩国、美国、新加坡,新西兰等学历材料,包您满意。
【我们承诺采用的是学校原版纸张(纸质、底色、纹路)我们拥有全套进口原装设备,特殊工艺都是采用不同机器制作,仿真度基本可以达到100%,所有工艺效果都可提前给客户展示,不满意可以根据客户要求进行调整,直到满意为止!】
【业务选择办理准则】
一、工作未确定,回国需先给父母、亲戚朋友看下文凭的情况,办理一份就读学校的毕业证【微信41543339】文凭即可
二、回国进私企、外企、自己做生意的情况,这些单位是不查询毕业证真伪的,而且国内没有渠道去查询国外文凭的真假,也不需要提供真实教育部认证。鉴于此,办理一份毕业证【微信41543339】即可
三、进国企,银行,事业单位,考公务员等等,这些单位是必需要提供真实教育部认证的,办理教育部认证所需资料众多且烦琐,所有材料您都必须提供原件,我们凭借丰富的经验,快捷的绿色通道帮您快速整合材料,让您少走弯路。
留信网认证的作用:
1:该专业认证可证明留学生真实身份
2:同时对留学生所学专业登记给予评定
3:国家专业人才认证中心颁发入库证书
4:这个认证书并且可以归档倒地方
5:凡事获得留信网入网的信息将会逐步更新到个人身份内,将在公安局网内查询个人身份证信息后,同步读取人才网入库信息
6:个人职称评审加20分
7:个人信誉贷款加10分
8:在国家人才网主办的国家网络招聘大会中纳入资料,供国家高端企业选择人才
留信网服务项目:
1、留学生专业人才库服务(留信分析)
2、国(境)学习人员提供就业推荐信服务
3、留学人员区块链存储服务
【关于价格问题(保证一手价格)】
我们所定的价格是非常合理的,而且我们现在做得单子大多数都是代理和回头客户介绍的所以一般现在有新的单子 我给客户的都是第一手的代理价格,因为我想坦诚对待大家 不想跟大家在价格方面浪费时间
对于老客户或者被老客户介绍过来的朋友,我们都会适当给一些优惠。
选择实体注册公司办理,更放心,更安全!我们的承诺:客户在留信官方认证查询网站查询到认证通过结果后付款,不成功不收费!
一比一原版(曼大毕业证书)曼尼托巴大学毕业证如何办理
原版一模一样【微信:741003700 】【(曼大毕业证书)曼尼托巴大学毕业证成绩单】【微信:741003700 】学位证,留信认证(真实可查,永久存档)原件一模一样纸张工艺/offer、雅思、外壳等材料/诚信可靠,可直接看成品样本,帮您解决无法毕业带来的各种难题!外壳,原版制作,诚信可靠,可直接看成品样本。行业标杆!精益求精,诚心合作,真诚制作!多年品质 ,按需精细制作,24小时接单,全套进口原装设备。十五年致力于帮助留学生解决难题,包您满意。
本公司拥有海外各大学样板无数,能完美还原。
1:1完美还原海外各大学毕业材料上的工艺:水印,阴影底纹,钢印LOGO烫金烫银,LOGO烫金烫银复合重叠。文字图案浮雕、激光镭射、紫外荧光、温感、复印防伪等防伪工艺。材料咨询办理、认证咨询办理请加学历顾问Q/微741003700
【主营项目】
一.毕业证【q微741003700】成绩单、使馆认证、教育部认证、雅思托福成绩单、学生卡等!
二.真实使馆公证(即留学回国人员证明,不成功不收费)
三.真实教育部学历学位认证(教育部存档!教育部留服网站永久可查)
四.办理各国各大学文凭(一对一专业服务,可全程监控跟踪进度)
如果您处于以下几种情况:
◇在校期间,因各种原因未能顺利毕业……拿不到官方毕业证【q/微741003700】
◇面对父母的压力,希望尽快拿到;
◇不清楚认证流程以及材料该如何准备;
◇回国时间很长,忘记办理;
◇回国马上就要找工作,办给用人单位看;
◇企事业单位必须要求办理的
◇需要报考公务员、购买免税车、落转户口
◇申请留学生创业基金
留信网认证的作用:
1:该专业认证可证明留学生真实身份
2:同时对留学生所学专业登记给予评定
3:国家专业人才认证中心颁发入库证书
4:这个认证书并且可以归档倒地方
5:凡事获得留信网入网的信息将会逐步更新到个人身份内,将在公安局网内查询个人身份证信息后,同步读取人才网入库信息
6:个人职称评审加20分
7:个人信誉贷款加10分
8:在国家人才网主办的国家网络招聘大会中纳入资料,供国家高端企业选择人才
办理(曼大毕业证书)曼尼托巴大学毕业证【微信:741003700 】外观非常简单,由纸质材料制成,上面印有校徽、校名、毕业生姓名、专业等信息。
办理(曼大毕业证书)曼尼托巴大学毕业证【微信:741003700 】格式相对统一,各专业都有相应的模板。通常包括以下部分:
校徽:象征着学校的荣誉和传承。
校名:学校英文全称
授予学位:本部分将注明获得的具体学位名称。
毕业生姓名:这是最重要的信息之一,标志着该证书是由特定人员获得的。
颁发日期:这是毕业正式生效的时间,也代表着毕业生学业的结束。
其他信息:根据不同的专业和学位,可能会有一些特定的信息或章节。
办理(曼大毕业证书)曼尼托巴大学毕业证【微信:741003700 】价值很高,需要妥善保管。一般来说,应放置在安全、干燥、防潮的地方,避免长时间暴露在阳光下。如需使用,最好使用复印件而不是原件,以免丢失。
综上所述,办理(曼大毕业证书)曼尼托巴大学毕业证【微信:741003700 】是证明身份和学历的高价值文件。外观简单庄重,格式统一,包括重要的个人信息和发布日期。对持有人来说,妥善保管是非常重要的。
06-12-2024-BudapestDataForum-BuildingReal-timePipelineswithFLaNK AIM
06-12-2024-BudapestDataForum-BuildingReal-timePipelineswithFLaNK AIM
by
Timothy Spann
Principal Developer Advocate
https://budapestdata.hu/2024/en/
https://budapestml.hu/2024/en/
tim.spann@zilliz.com
https://www.linkedin.com/in/timothyspann/
https://x.com/paasdev
https://github.com/tspannhw
https://www.youtube.com/@flank-stack
milvus
vector database
gen ai
generative ai
deep learning
machine learning
apache nifi
apache pulsar
apache kafka
apache flink
一比一原版英属哥伦比亚大学毕业证(UBC毕业证书)学历如何办理
原版办【微信号:BYZS866】【英属哥伦比亚大学毕业证(UBC毕业证书)】【微信号:BYZS866】《成绩单、外壳、雅思、offer、真实留信官方学历认证(永久存档/真实可查)》采用学校原版纸张、特殊工艺完全按照原版一比一制作(包括:隐形水印,阴影底纹,钢印LOGO烫金烫银,LOGO烫金烫银复合重叠,文字图案浮雕,激光镭射,紫外荧光,温感,复印防伪)行业标杆!精益求精,诚心合作,真诚制作!多年品质 ,按需精细制作,24小时接单,全套进口原装设备,十五年致力于帮助留学生解决难题,业务范围有加拿大、英国、澳洲、韩国、美国、新加坡,新西兰等学历材料,包您满意。
【我们承诺采用的是学校原版纸张(纸质、底色、纹路)我们拥有全套进口原装设备,特殊工艺都是采用不同机器制作,仿真度基本可以达到100%,所有工艺效果都可提前给客户展示,不满意可以根据客户要求进行调整,直到满意为止!】
【业务选择办理准则】
一、工作未确定,回国需先给父母、亲戚朋友看下文凭的情况,办理一份就读学校的毕业证【微信号BYZS866】文凭即可
二、回国进私企、外企、自己做生意的情况,这些单位是不查询毕业证真伪的,而且国内没有渠道去查询国外文凭的真假,也不需要提供真实教育部认证。鉴于此,办理一份毕业证【微信号BYZS866】即可
三、进国企,银行,事业单位,考公务员等等,这些单位是必需要提供真实教育部认证的,办理教育部认证所需资料众多且烦琐,所有材料您都必须提供原件,我们凭借丰富的经验,快捷的绿色通道帮您快速整合材料,让您少走弯路。
留信网认证的作用:
1:该专业认证可证明留学生真实身份
2:同时对留学生所学专业登记给予评定
3:国家专业人才认证中心颁发入库证书
4:这个认证书并且可以归档倒地方
5:凡事获得留信网入网的信息将会逐步更新到个人身份内,将在公安局网内查询个人身份证信息后,同步读取人才网入库信息
6:个人职称评审加20分
7:个人信誉贷款加10分
8:在国家人才网主办的国家网络招聘大会中纳入资料,供国家高端企业选择人才
留信网服务项目:
1、留学生专业人才库服务(留信分析)
2、国(境)学习人员提供就业推荐信服务
3、留学人员区块链存储服务
【关于价格问题(保证一手价格)】
我们所定的价格是非常合理的,而且我们现在做得单子大多数都是代理和回头客户介绍的所以一般现在有新的单子 我给客户的都是第一手的代理价格,因为我想坦诚对待大家 不想跟大家在价格方面浪费时间
对于老客户或者被老客户介绍过来的朋友,我们都会适当给一些优惠。
选择实体注册公司办理,更放心,更安全!我们的承诺:客户在留信官方认证查询网站查询到认证通过结果后付款,不成功不收费!
Open Source Contributions to Postgres: The Basics POSETTE 2024
Postgres is the most advanced open-source database in the world and it's supported by a community, not a single company. So how does this work? How does code actually get into Postgres? I recently had a patch submitted and committed and I want to share what I learned in that process. I’ll give you an overview of Postgres versions and how the underlying project codebase functions. I’ll also show you the process for submitting a patch and getting that tested and committed.
一比一原版南十字星大学毕业证(SCU毕业证书)学历如何办理
原版办理【微信号:BYZS866】【南十字星大学毕业证(SCU毕业证书)】【微信号:BYZS866】《成绩单、外壳、雅思、offer、真实留信官方学历认证(永久存档/真实可查)》采用学校原版纸张、特殊工艺完全按照原版一比一制作(包括:隐形水印,阴影底纹,钢印LOGO烫金烫银,LOGO烫金烫银复合重叠,文字图案浮雕,激光镭射,紫外荧光,温感,复印防伪)行业标杆!精益求精,诚心合作,真诚制作!多年品质 ,按需精细制作,24小时接单,全套进口原装设备,十五年致力于帮助留学生解决难题,业务范围有加拿大、英国、澳洲、韩国、美国、新加坡,新西兰等学历材料,包您满意。
【我们承诺采用的是学校原版纸张(纸质、底色、纹路)我们拥有全套进口原装设备,特殊工艺都是采用不同机器制作,仿真度基本可以达到100%,所有工艺效果都可提前给客户展示,不满意可以根据客户要求进行调整,直到满意为止!】
【业务选择办理准则】
一、工作未确定,回国需先给父母、亲戚朋友看下文凭的情况,办理一份就读学校的毕业证【微信号BYZS866】文凭即可
二、回国进私企、外企、自己做生意的情况,这些单位是不查询毕业证真伪的,而且国内没有渠道去查询国外文凭的真假,也不需要提供真实教育部认证。鉴于此,办理一份毕业证【微信号BYZS866】即可
三、进国企,银行,事业单位,考公务员等等,这些单位是必需要提供真实教育部认证的,办理教育部认证所需资料众多且烦琐,所有材料您都必须提供原件,我们凭借丰富的经验,快捷的绿色通道帮您快速整合材料,让您少走弯路。
留信网认证的作用:
1:该专业认证可证明留学生真实身份
2:同时对留学生所学专业登记给予评定
3:国家专业人才认证中心颁发入库证书
4:这个认证书并且可以归档倒地方
5:凡事获得留信网入网的信息将会逐步更新到个人身份内,将在公安局网内查询个人身份证信息后,同步读取人才网入库信息
6:个人职称评审加20分
7:个人信誉贷款加10分
8:在国家人才网主办的国家网络招聘大会中纳入资料,供国家高端企业选择人才
留信网服务项目:
1、留学生专业人才库服务(留信分析)
2、国(境)学习人员提供就业推荐信服务
3、留学人员区块链存储服务
【关于价格问题(保证一手价格)】
我们所定的价格是非常合理的,而且我们现在做得单子大多数都是代理和回头客户介绍的所以一般现在有新的单子 我给客户的都是第一手的代理价格,因为我想坦诚对待大家 不想跟大家在价格方面浪费时间
对于老客户或者被老客户介绍过来的朋友,我们都会适当给一些优惠。
选择实体注册公司办理,更放心,更安全!我们的承诺:客户在留信官方认证查询网站查询到认证通过结果后付款,不成功不收费!
The Ipsos - AI - Monitor 2024 Report.pdf
According to Ipsos AI Monitor's 2024 report, 65% Indians said that products and services using AI have profoundly changed their daily life in the past 3-5 years.
一比一原版(harvard毕业证书)哈佛大学毕业证如何办理
一模一样【微信:A575476】【(harvard毕业证书)哈佛大学毕业证成绩单Offer】【微信:A575476】(留信学历认证永久存档查询)采用学校原版纸张、特殊工艺完全按照原版一比一制作(包括:隐形水印,阴影底纹,钢印LOGO烫金烫银,LOGO烫金烫银复合重叠,文字图案浮雕,激光镭射,紫外荧光,温感,复印防伪)行业标杆!精益求精,诚心合作,真诚制作!多年品质 ,按需精细制作,24小时接单,全套进口原装设备,十五年致力于帮助留学生解决难题,业务范围有加拿大、英国、澳洲、韩国、美国、新加坡,新西兰等学历材料,包您满意。
【业务选择办理准则】
一、工作未确定,回国需先给父母、亲戚朋友看下文凭的情况,办理一份就读学校的毕业证【微信:A575476】文凭即可
二、回国进私企、外企、自己做生意的情况,这些单位是不查询毕业证真伪的,而且国内没有渠道去查询国外文凭的真假,也不需要提供真实教育部认证。鉴于此,办理一份毕业证【微信:A575476】即可
三、进国企,银行,事业单位,考公务员等等,这些单位是必需要提供真实教育部认证的,办理教育部认证所需资料众多且烦琐,所有材料您都必须提供原件,我们凭借丰富的经验,快捷的绿色通道帮您快速整合材料,让您少走弯路。
留信网认证的作用:
1:该专业认证可证明留学生真实身份
2:同时对留学生所学专业登记给予评定
3:国家专业人才认证中心颁发入库证书
4:这个认证书并且可以归档倒地方
5:凡事获得留信网入网的信息将会逐步更新到个人身份内,将在公安局网内查询个人身份证信息后,同步读取人才网入库信息
6:个人职称评审加20分
7:个人信誉贷款加10分
8:在国家人才网主办的国家网络招聘大会中纳入资料,供国家高端企业选择人才
→ 【关于价格问题(保证一手价格)
我们所定的价格是非常合理的,而且我们现在做得单子大多数都是代理和回头客户介绍的所以一般现在有新的单子 我给客户的都是第一手的代理价格,因为我想坦诚对待大家 不想跟大家在价格方面浪费时间
对于老客户或者被老客户介绍过来的朋友,我们都会适当给一些优惠。
选择实体注册公司办理,更放心,更安全!我们的承诺:可来公司面谈,可签订合同,会陪同客户一起到教育部认证窗口递交认证材料,客户在教育部官方认证查询网站查询到认证通过结果后付款,不成功不收费!
End-to-end pipeline agility - Berlin Buzzwords 2024
We describe how we achieve high change agility in data engineering by eliminating the fear of breaking downstream data pipelines through end-to-end pipeline testing, and by using schema metaprogramming to safely eliminate boilerplate involved in changes that affect whole pipelines.
A quick poll on agility in changing pipelines from end to end indicated a huge span in capabilities. For the question "How long time does it take for all downstream pipelines to be adapted to an upstream change," the median response was 6 months, but some respondents could do it in less than a day. When quantitative data engineering differences between the best and worst are measured, the span is often 100x-1000x, sometimes even more.
A long time ago, we suffered at Spotify from fear of changing pipelines due to not knowing what the impact might be downstream. We made plans for a technical solution to test pipelines end-to-end to mitigate that fear, but the effort failed for cultural reasons. We eventually solved this challenge, but in a different context. In this presentation we will describe how we test full pipelines effectively by manipulating workflow orchestration, which enables us to make changes in pipelines without fear of breaking downstream.
Making schema changes that affect many jobs also involves a lot of toil and boilerplate. Using schema-on-read mitigates some of it, but has drawbacks since it makes it more difficult to detect errors early. We will describe how we have rejected this tradeoff by applying schema metaprogramming, eliminating boilerplate but keeping the protection of static typing, thereby further improving agility to quickly modify data pipelines without fear.
一比一原版格里菲斯大学毕业证(Griffith毕业证书)学历如何办理
原版制作【微信号:BYZS866】【格里菲斯大学毕业证(Griffith毕业证书)】【微信号:BYZS866】《成绩单、外壳、雅思、offer、真实留信官方学历认证(永久存档/真实可查)》采用学校原版纸张、特殊工艺完全按照原版一比一制作(包括:隐形水印,阴影底纹,钢印LOGO烫金烫银,LOGO烫金烫银复合重叠,文字图案浮雕,激光镭射,紫外荧光,温感,复印防伪)行业标杆!精益求精,诚心合作,真诚制作!多年品质 ,按需精细制作,24小时接单,全套进口原装设备,十五年致力于帮助留学生解决难题,业务范围有加拿大、英国、澳洲、韩国、美国、新加坡,新西兰等学历材料,包您满意。
【我们承诺采用的是学校原版纸张(纸质、底色、纹路)我们拥有全套进口原装设备,特殊工艺都是采用不同机器制作,仿真度基本可以达到100%,所有工艺效果都可提前给客户展示,不满意可以根据客户要求进行调整,直到满意为止!】
【业务选择办理准则】
一、工作未确定,回国需先给父母、亲戚朋友看下文凭的情况,办理一份就读学校的毕业证【微信号BYZS866】文凭即可
二、回国进私企、外企、自己做生意的情况,这些单位是不查询毕业证真伪的,而且国内没有渠道去查询国外文凭的真假,也不需要提供真实教育部认证。鉴于此,办理一份毕业证【微信号BYZS866】即可
三、进国企,银行,事业单位,考公务员等等,这些单位是必需要提供真实教育部认证的,办理教育部认证所需资料众多且烦琐,所有材料您都必须提供原件,我们凭借丰富的经验,快捷的绿色通道帮您快速整合材料,让您少走弯路。
留信网认证的作用:
1:该专业认证可证明留学生真实身份
2:同时对留学生所学专业登记给予评定
3:国家专业人才认证中心颁发入库证书
4:这个认证书并且可以归档倒地方
5:凡事获得留信网入网的信息将会逐步更新到个人身份内,将在公安局网内查询个人身份证信息后,同步读取人才网入库信息
6:个人职称评审加20分
7:个人信誉贷款加10分
8:在国家人才网主办的国家网络招聘大会中纳入资料,供国家高端企业选择人才
留信网服务项目:
1、留学生专业人才库服务(留信分析)
2、国(境)学习人员提供就业推荐信服务
3、留学人员区块链存储服务
【关于价格问题(保证一手价格)】
我们所定的价格是非常合理的,而且我们现在做得单子大多数都是代理和回头客户介绍的所以一般现在有新的单子 我给客户的都是第一手的代理价格,因为我想坦诚对待大家 不想跟大家在价格方面浪费时间
对于老客户或者被老客户介绍过来的朋友,我们都会适当给一些优惠。
选择实体注册公司办理,更放心,更安全!我们的承诺:客户在留信官方认证查询网站查询到认证通过结果后付款,不成功不收费!
Recently uploaded (20)
Predictably Improve Your B2B Tech Company's Performance by Leveraging Data
Predictably Improve Your B2B Tech Company's Performance by Leveraging Data
Orchestrating the Future: Navigating Today's Data Workflow Challenges with Ai...
Orchestrating the Future: Navigating Today's Data Workflow Challenges with Ai...
06-12-2024-BudapestDataForum-BuildingReal-timePipelineswithFLaNK AIM
06-12-2024-BudapestDataForum-BuildingReal-timePipelineswithFLaNK AIM
Open Source Contributions to Postgres: The Basics POSETTE 2024
Open Source Contributions to Postgres: The Basics POSETTE 2024
End-to-end pipeline agility - Berlin Buzzwords 2024
End-to-end pipeline agility - Berlin Buzzwords 2024
Statistical Analysis Project
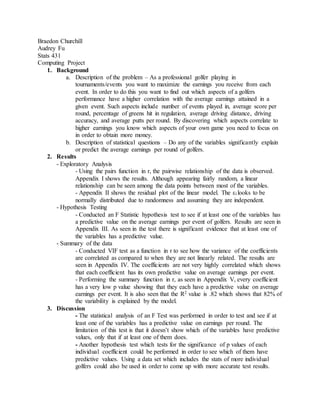
- 1. Braedon Churchill Audrey Fu Stats 431 Computing Project 1. Background a. Description of the problem – As a professional golfer playing in tournaments/events you want to maximize the earnings you receive from each event. In order to do this you want to find out which aspects of a golfers performance have a higher correlation with the average earnings attained in a given event. Such aspects include number of events played in, average score per round, percentage of greens hit in regulation, average driving distance, driving accuracy, and average putts per round. By discovering which aspects correlate to higher earnings you know which aspects of your own game you need to focus on in order to obtain more money. b. Description of statistical questions – Do any of the variables significantly explain or predict the average earnings per round of golfers. 2. Results - Exploratory Analysis - Using the pairs function in r, the pairwise relationship of the data is observed. Appendix I shows the results. Although appearing fairly random, a linear relationship can be seen among the data points between most of the variables. - Appendix II shows the residual plot of the linear model. The εi looks to be normally distributed due to randomness and assuming they are independent. - Hypothesis Testing - Conducted an F Statistic hypothesis test to see if at least one of the variables has a predictive value on the average earnings per event of golfers. Results are seen in Appendix III. As seen in the test there is significant evidence that at least one of the variables has a predictive value. - Summary of the data - Conducted VIF test as a function in r to see how the variance of the coefficients are correlated as compared to when they are not linearly related. The results are seen in Appendix IV. The coefficients are not very highly correlated which shows that each coefficient has its own predictive value on average earnings per event. - Performing the summary function in r, as seen in Appendix V, every coefficient has a very low p value showing that they each have a predictive value on average earnings per event. It is also seen that the R2 value is .82 which shows that 82% of the variability is explained by the model. 3. Discussion - The statistical analysis of an F Test was performed in order to test and see if at least one of the variables has a predictive value on earnings per round. The limitation of this test is that it doesn’t show which of the variables have predictive values, only that if at least one of them does. - Another hypothesis test which tests for the significance of p values of each individual coefficient could be performed in order to see which of them have predictive values. Using a data set which includes the stats of more individual golfers could also be used in order to come up with more accurate test results.
- 2. 4. Appendix a. Details of Statistical Analyses (Appendix I – V) Appendix I Appendix II Appendix III H0: X1=X2=X3=X4=X5=X6=0 Ha: At least one Xi ≠ 0 k = 6 n = 18 DF1 = k = 6 DF2 = n-(k+1) = 11 α = .05 F Statistic = 13.99 with Fα, DF1=6, DF2=11 = 3.09 Reject Ho if F > Fα Since 13.99 > 3.09 I reject the null hypothesis It can be concluded that at least one of the variables has a predictive value on the average earnings per event of golfers. It is shown with the residual plot that the data is normally distributed. Independence is assumed.
- 3. Appendix IV > vif(lm) X1 X2 X3 X4 X5 X6 2.937727 3.598127 1.846040 1.830498 1.742528 2.145418 Appendix V Call: lm(formula = Y ~ X1 + X2 + X3 + X4 + X5 + X6) Y = Average earnings per event X1 = Average score per round X2 = Percentage of greens in regulation X3 = Driving accuracy X4 = Average putts per round X5 = Number of events X6 = Average driving distance Residuals: Min 1Q Median 3Q Max -50215 -21877 1518 18345 37626 Coefficients: Estimate Std. Error t value Pr(>|t|) (Intercept) 1411171.4 1350234.6 1.045 0.309796 X1 -44490.9 19562.2 -2.274 0.035418 * X2 22564.0 4727.3 4.773 0.000152 *** X3 -5463.8 1453.6 -3.759 0.001437 ** X4 57686.9 23583.6 2.446 0.024946 * X5 -4751.8 1288.8 -3.687 0.001687 ** X6 -3466.1 999.3 -3.469 0.002742 ** --- Signif. codes: 0 ‘***’ 0.001 ‘**’ 0.01 ‘*’ 0.05 ‘.’ 0.1 ‘ ’ 1 Residual standard error: 29530 on 18 degrees of freedom Multiple R-squared: 0.8234, Adjusted R-squared: 0.7646 F-statistic: 13.99 on 6 and 18 DF, p-value: 6.497e-06 b. R Code #load the data set Golfstats <- read.delim("~/Golfstats.txt") > View(Golfstats) #name the variables > Y=Golfstats$Earnings.Event > X1=Golfstats$Avg..Score
- 4. > X2=Golfstats$GIR..... > X3=Golfstats$Driving.Accuracy.... > X4=Golfstats$Putts.Round > X5=Golfstats$Events > X6=Golfstats$Driving.Distance #Perform Exploratory Analysis > pairs(Data) #create linear model > lm(Y~X1+X2+X3+X4+X5+X6) > lm=lm(Y~X1+X2+X3+X4+X5+X6) #create residual plot to test the residuals > plot(lm$fitted, lm$resid) > abline(h=0, lty=2) #check the significance of the variables and find test statistics > summary(lm) #check for multicolinearity of the variables > vif(lm)