Downloaded 139 times


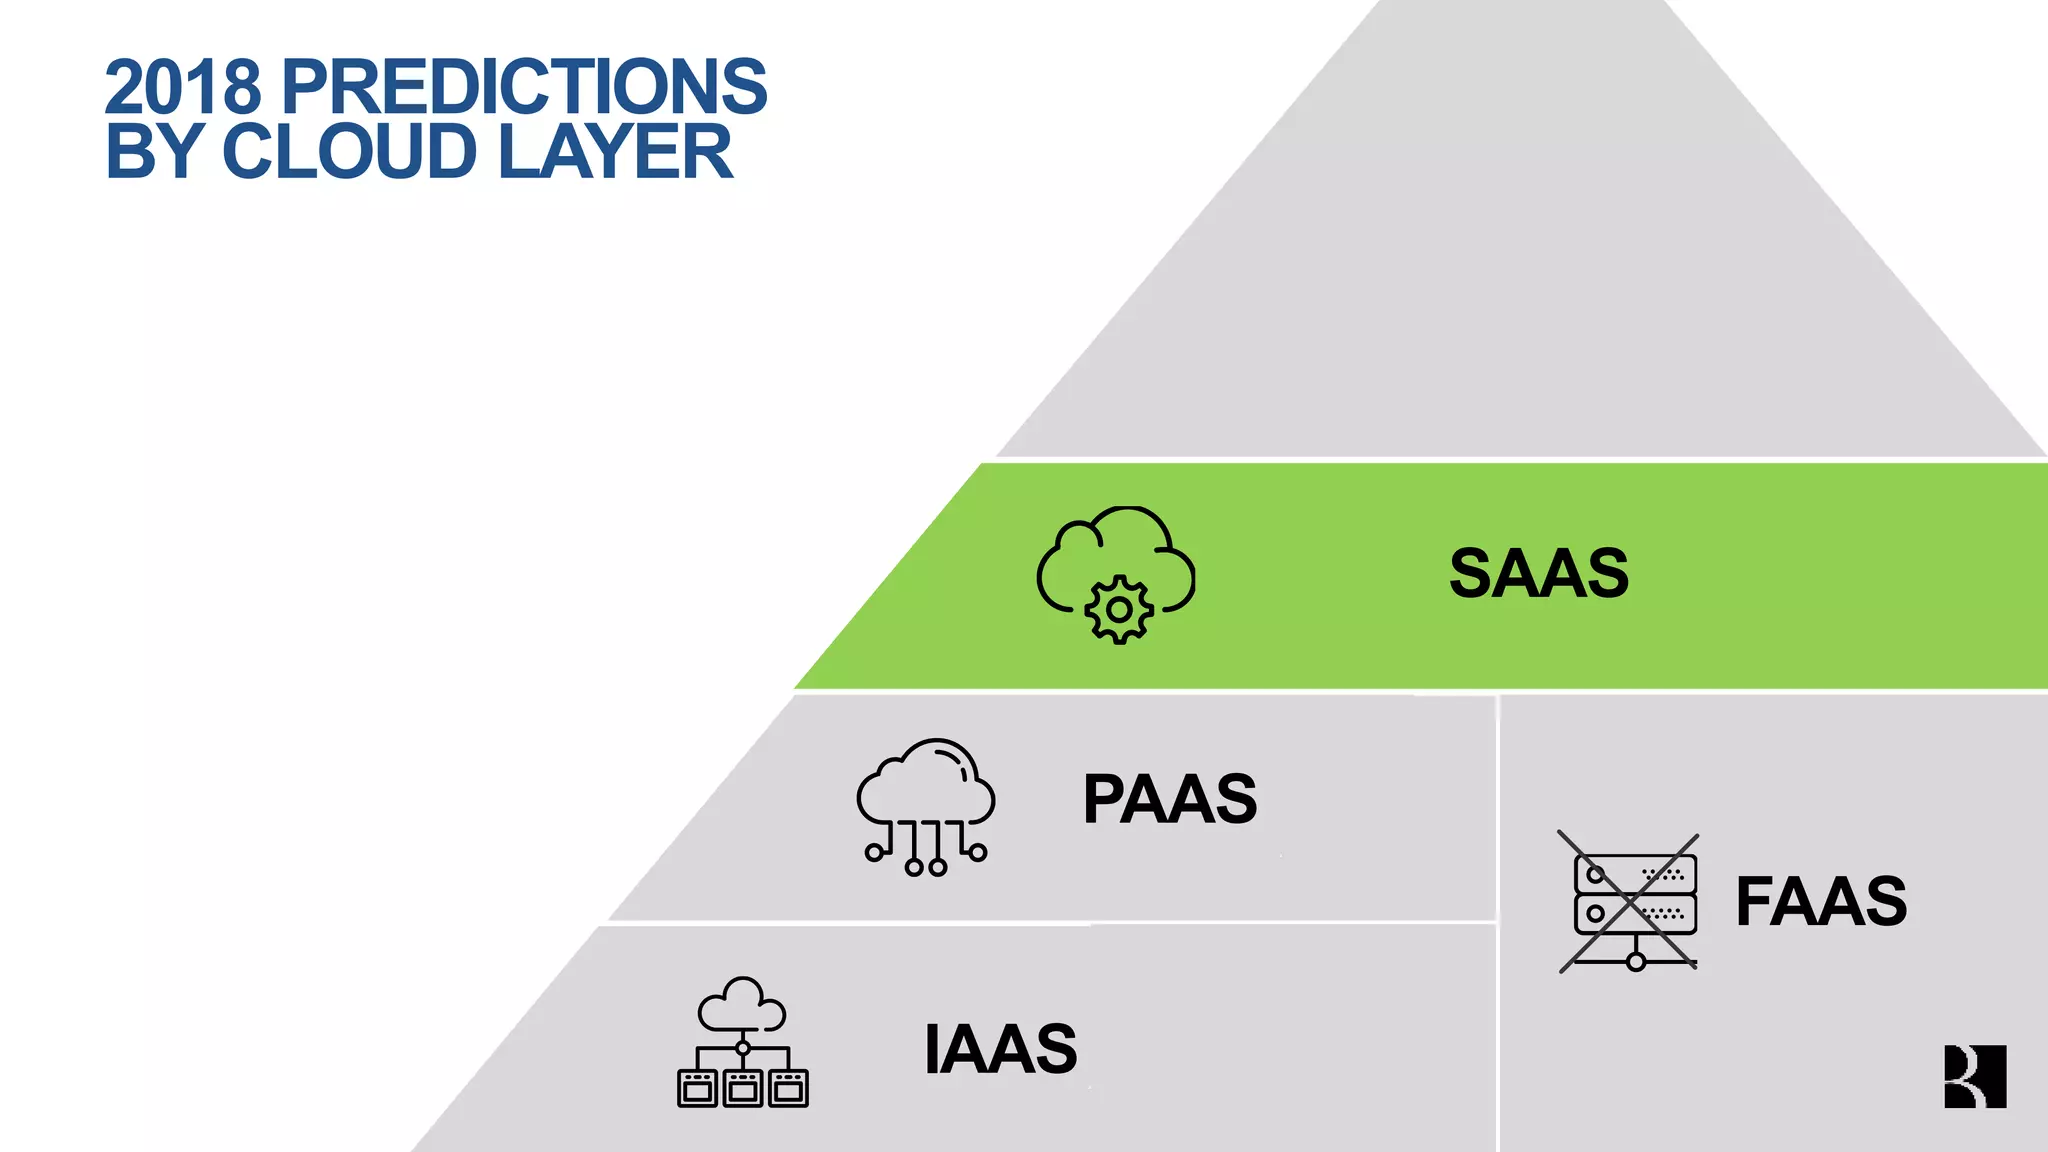


The 2018 State of the Cloud Report highlights significant growth in cloud funding and the technology sector, with the average market cap at IPO having increased notably. Private company valuations are outpacing public valuations, and there is a rising trend of unicorns in the startup ecosystem. Predictions for 2018 suggest continued advances in serverless computing and increased complexity in software development due to trends in containerization and API scalability.