Downloaded 196 times


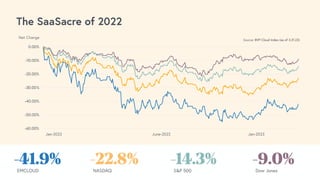

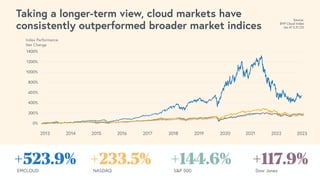
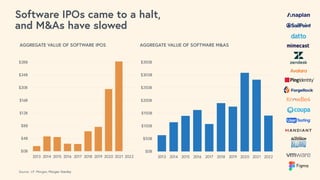

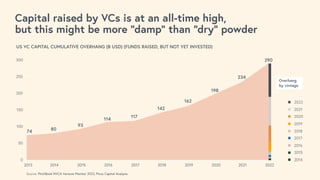


The 2023 State of the Cloud report details significant challenges in the cloud sector, including a -41.9% decline in software IPOs and a slowdown in merger and acquisition activity influenced by rising interest rates. While venture capital remains at an all-time high, the document indicates a rebalancing of focus toward profitability over growth among cloud CEOs. Additionally, it highlights transformative trends in AI technology, predicting substantial shifts in the SaaS landscape and emphasizing the importance of strategic fundraising for cloud companies.