Download as PDF, PPTX


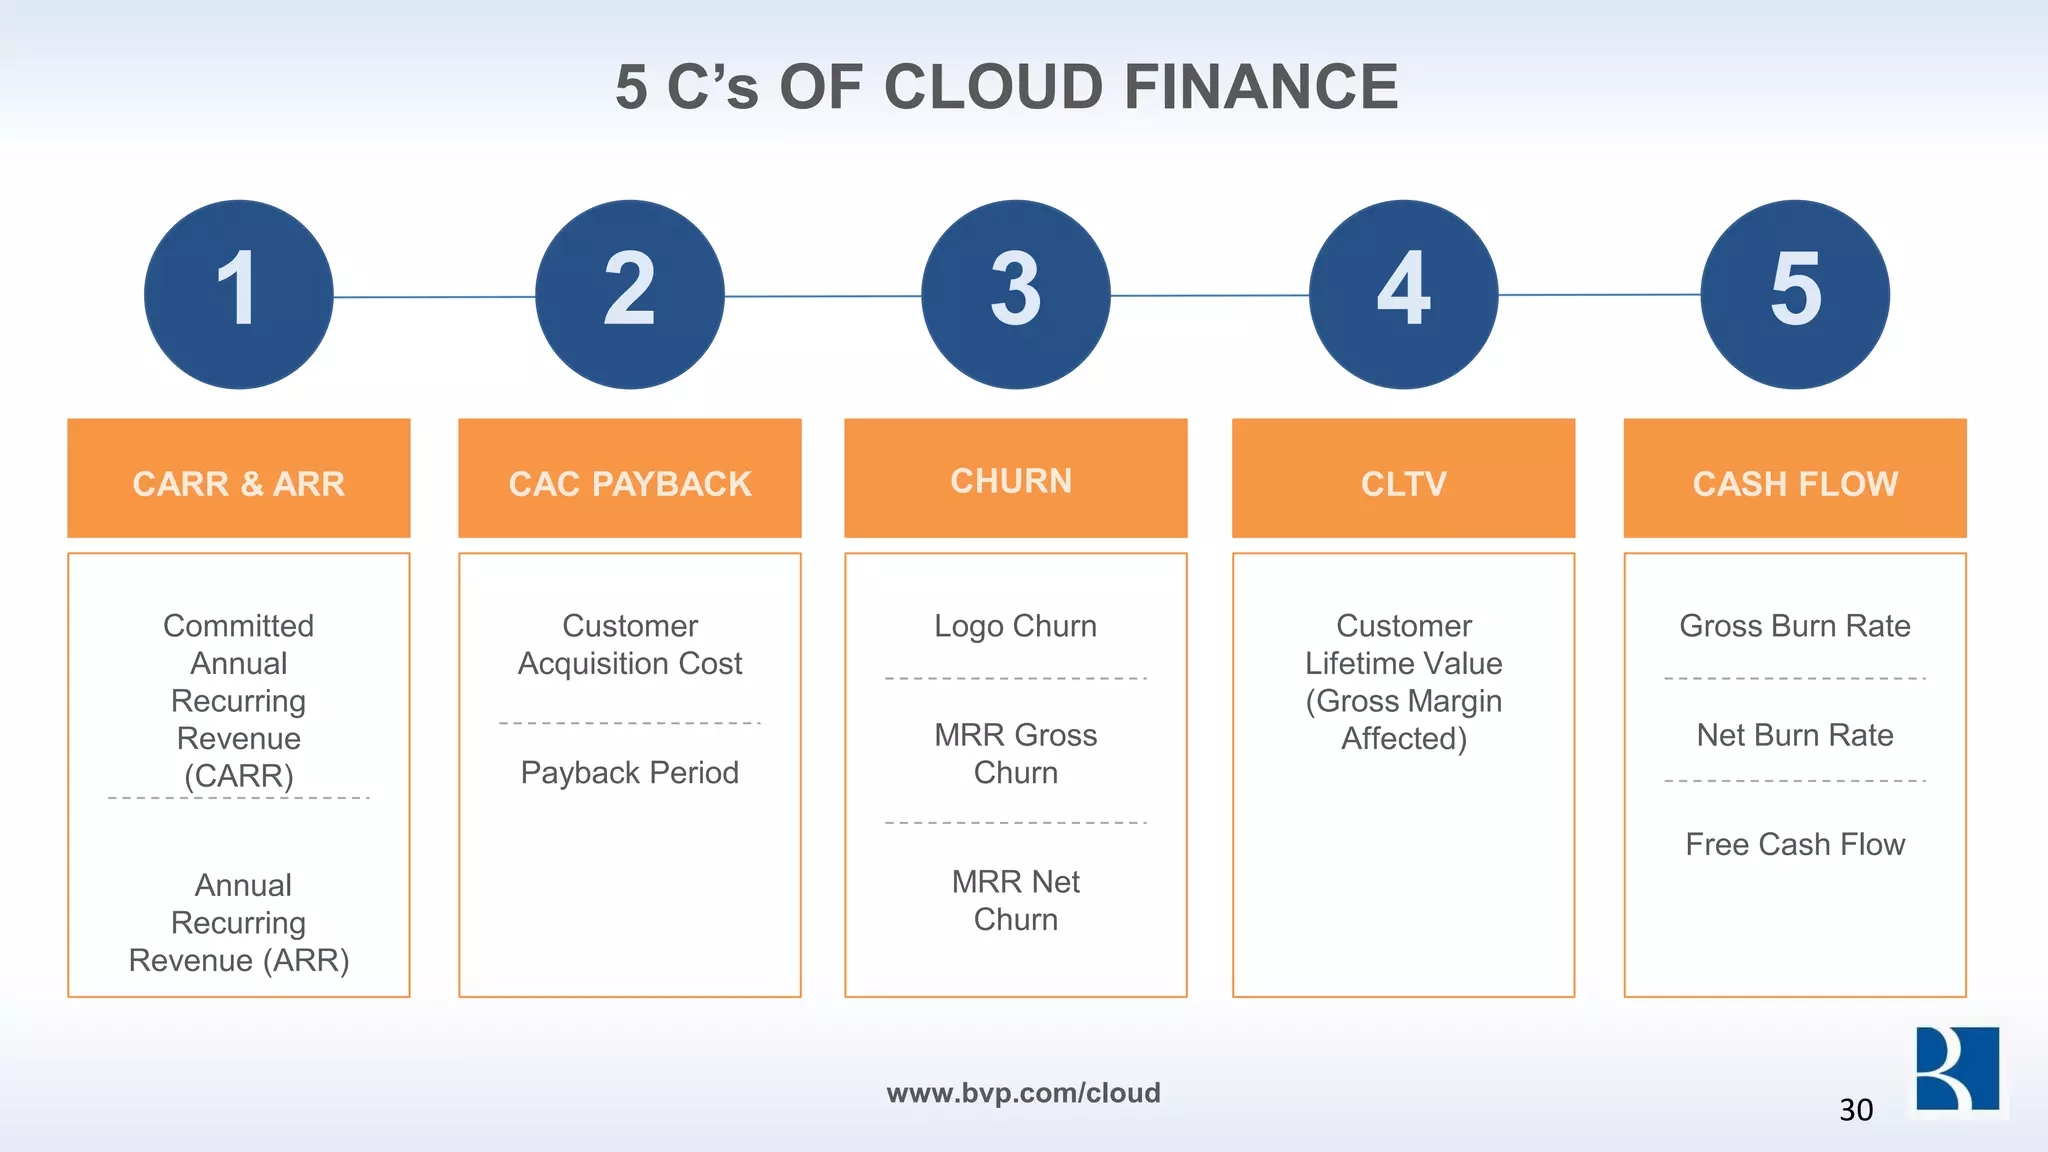


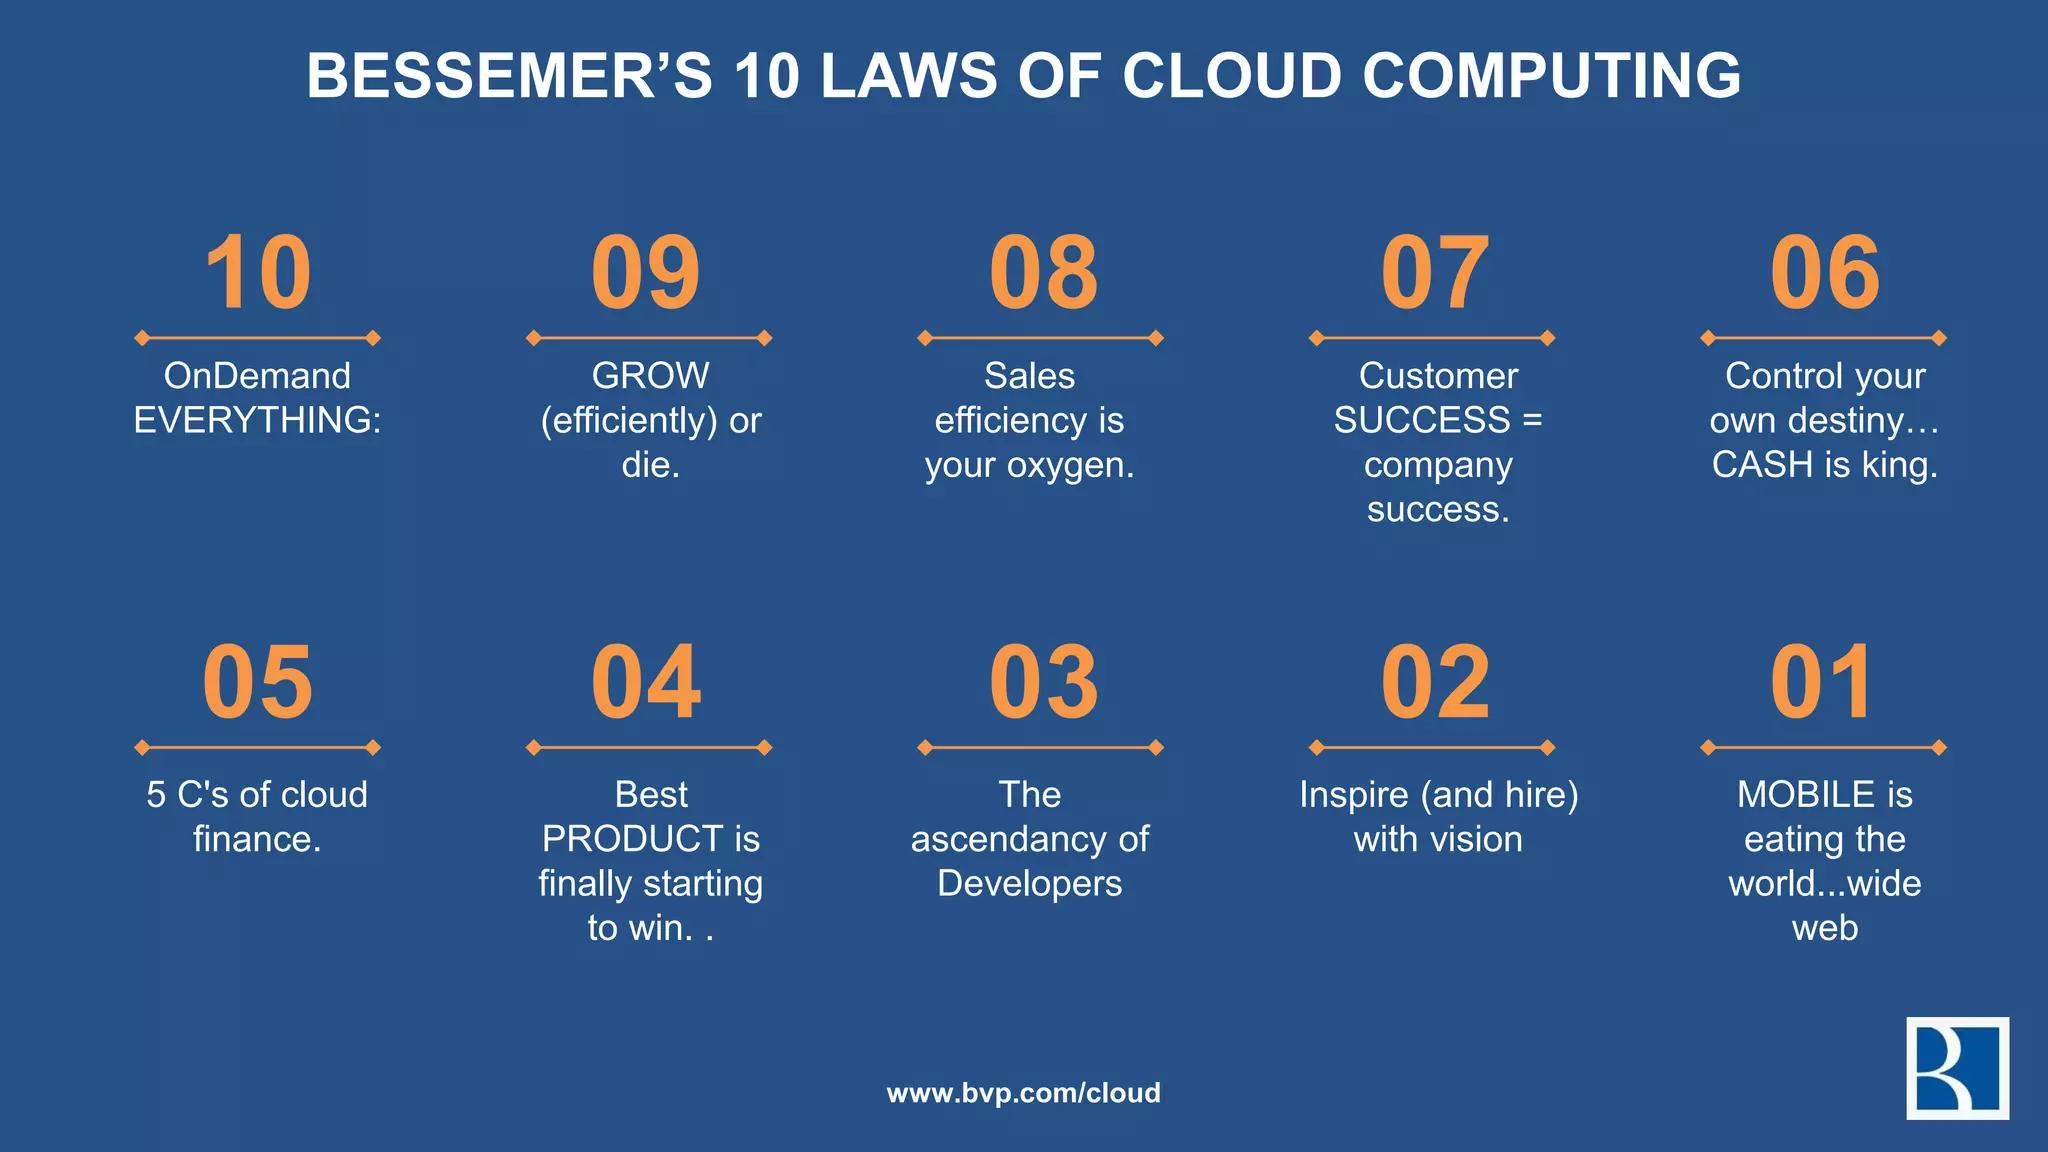


Bessemer's 10 Laws of Cloud Computing outlines key principles for success in the cloud industry, emphasizing growth efficiency, sales effectiveness, and customer success. The document highlights the importance of mobile technology and the need for companies to control their destiny, while providing metrics like customer acquisition cost and churn rates. Overall, it serves as a strategic guide for businesses aiming to thrive in the competitive cloud landscape.