Sangamon County in Illinois used Esri's Election Results Viewer template to create an interactive web and mobile application to map election results in real-time. The application allows users to select a precinct and view results for each race as well as compare to overall county results. It also shows new precinct boundaries from redistricting. The county can now update results every two minutes, much faster than previous methods. The easy-to-use application gives citizens a visual understanding of results and new precincts. Seeing its benefits, the county plans to create additional GIS applications like a tax parcel viewer.
Esri News for Electric & Gas Utilities -- Fall 2012Esri
Esri News for Electric & Gas Utilities keeps you informed with software news, events, and user stories showing how GIS brings the geographic advantage to electric and gas utilities worldwide.
Stories in this issue showcase how GIS helps utilities prepare for electric vehicles, improve billing accuracy, and manage network outages.
Lifeguards are trained and certified professionals responsible for overseeing safety at bodies of water like swimming pools. They are qualified swimmers trained in water rescue using various aids and equipment. There are many water sports that involve swimming or parts related to swimming, including scuba diving where divers can explore underwater for extended periods while breathing from oxygen tanks on their backs and maneuvering with swim fins. Payment details are provided at the end.
This document discusses a workflow for managing bathymetric data using Esri's ArcGIS software in partnership with IVS 3D. It allows hydrographic surveyors to directly import bathymetric data collected using multibeam sonar systems into a GIS environment. This integration streamlines the data management process, enabling users to map ocean floors, perform analysis and visualization, and update nautical charts more efficiently. It also supports the development of marine spatial data infrastructures.
Esri News for Federal Government -- Summer 2012Esri
Esri News for Federal Government keeps you informed with software news, events, and user stories showing how GIS brings the geographic advantage to federal agencies.
Stories in this issue showcase how GIS helps federal agencies manage and share recovery spending and highlights the accuracy of Esri's demographic data in a recent study.
Esri News for Business keeps you informed with software news, events, and user stories showing how GIS brings the geographic advantage to businesses worldwide.
Stories in this issue showcase how GIS helps businesses make sense of big data and provides insight on the power of location analytics.
Esri News for Electric & Gas Utillities—Spring 2012Esri
Esri News for Electric & Gas Utilities keeps you informed with software news, events, and user stories showing how GIS brings the geographic advantage to electric and gas utilities worldwide.
Stories in this issue showcase how GIS helps utilities develop enterprise dashboards, renewable energy plans, and mobile applications for field inspections.
Esri News for Health & Human Services -- Summer 2012Esri
Esri News for Health & Human Services keeps you informed with software news, events, and user stories showing how GIS brings the geographic advantage to health organizations worldwide.
Stories in this issue showcase how agencies use GIS for vector control and disease monitoring, promoting and ensuring access to healthcare, and managing epidemic outbreaks.
The University of Calgary uses GIS technology from Esri to manage its large campus. As the university undertakes a $1.5 billion expansion project, the largest in its history, planners are relying on ArcGIS and geodesign principles to analyze design alternatives. The university maintains facilities data in a central data warehouse, with ArcGIS for Server pulling data from ARCHIBUS to enable users to visualize and analyze spatial and facilities information. Going forward, the university aims to fully leverage GIS for additional facilities management tasks like space planning, energy management, and predictive maintenance of infrastructure assets.
Esri News for Water & Wastewater -- Summer 2012Esri
Esri News for Water & Wastewater keeps you informed with software news, events, and user stories showing how GIS brings the geographic advantage to water and wastewater utilities worldwide.
Stories in this issue showcase how GIS helps utilities manage stormwater runoff, improve billing and customer service, and mitigate flooding.
Citizen engagement applications using GIS allow governments to receive real-time feedback from citizens on smartphones. This helps governments understand community needs and improve services. Smart cities recognize citizens as sensors, making it easy for public to report issues online or on mobile devices. The City of Glendale collaborated on an app for citizens to report issues like potholes with photos and locations sent to the city for tracking and resolution. Incorporating citizen data helps governments operate more smoothly and responsively to community needs.
This document discusses how geographic information systems (GIS) can help electric transmission utilities manage assets and infrastructure, analyze planning and vulnerabilities, automate workforces, and provide situational awareness. GIS allows utilities to view, organize, and understand large amounts of spatial and asset data for transmission lines, facilities, and customers. It enables utilities to model routes, ensure regulatory compliance, dispatch crews efficiently, and communicate system operations and investments to regulators and the public. The document promotes Esri GIS software and services for electric transmission applications.
Esri News for Federal Government Winter 2012/2013 issueEsri
The United States Environmental Protection Agency (EPA) has built a map service called EPA GeoPlatform on Esri's ArcGIS Online for Organizations to make geospatial data and tools more accessible to EPA staff. EPA GeoPlatform includes public and private cloud components to share internal and external data. It supports EPA activities like enforcement targeting and environmental justice screening. EPA sees benefits like increased access to decision-making tools and cost savings from standardization. EPA GeoPlatform serves as the agency's centralized hub for hosted map services.
Geographic information systems (GIS) integrate hardware, software, and data to capture, manage, analyze and display geographically referenced information. Utilities worldwide use GIS to manage the location of millions of miles of infrastructure assets and link this data to customer information systems. GIS enables utilities to identify vulnerabilities, plan new infrastructure investments, and understand customer satisfaction through spatial analysis tools. GIS also supports workforce automation and situational awareness to more efficiently dispatch crews and communicate with regulators.
Esri News for State and Local Government Spring 2013 issueEsri
The US population continued to grow more diverse in 2012, with rising racial/ethnic diversity and changes in household composition. While the housing market recovery remained slow overall, signs of recovery were seen in some areas. Housing growth varied across the country, driven by factors like military presence in some areas and economic growth in others. Traditional husband-wife families with children continued to decline as a share of households.
Esri News for State and Local Government Winter 2012/2013 issueEsri
The document discusses how Utah County, Utah updated its GIS data model using the ArcGIS for Local Government Information Model. Patrick Wawro, the GIS manager, decided to abandon his individual efforts to update the data model and instead model the data on the information model, which is built on best practices from governments around the US. This standardized and modernized the county's work. Using the information model also makes it easier for cities to take advantage of ArcGIS for Local Government templates and allows the county to easily adopt new technologies. The county is now taking advantage of templates for applications like an election polling places app and developing other apps based on templates.
GIS technology provides utilities with a geographic approach to implementing a smart grid by helping to manage data, plan infrastructure, and automate workforce operations. GIS captures smart grid data like customer behavior and device locations, analyzes factors like demand response, and monitors projects through maps and reports. By integrating accurate location data, GIS enables utilities to efficiently build and operate a smart grid network.
The Esri Nonprofit Program provides GIS software to qualified nonprofit organizations like Save the Children Italia, Direct Relief International, and Habitat for Humanity.
Esri provides the ArcGIS software platform to help organizations manage their water systems. ArcGIS allows users to integrate data from various systems, collaborate across departments, visualize information through maps and reports, and analyze data for planning, maintenance, and compliance. It offers solutions for asset management, planning and analysis, field mobility, operational awareness, and stakeholder engagement to support managing all aspects of a water utility.
This document summarizes Esri's water resource management software solutions. It describes how Esri allows users to understand water resource problems by integrating diverse data types into visualizations. Esri's tools also enable users to simulate scenarios, design management plans, and implement solutions. The software works across devices and with other systems. Esri aims to provide geographic expertise to help communities address water challenges.
The document discusses how geographic information system (GIS) technology helps community leaders make more informed decisions and take real-time action. It provides four key ways GIS does this: 1) Real-time dashboards visualize real-time data to help allocate resources efficiently during emergencies; 2) Story maps improve communication and understanding with stakeholders; 3) Map analysis helps communities understand and combat issues like the opioid epidemic; 4) Field accessibility allows workers to make better remote decisions and assign help without delay.
An Esri enterprise license agreement (ELA) provides federal agencies with unlimited access to Esri's latest GIS software and tools. This streamlines procurement and allows all staff to use applications that improve services, data analysis, planning, and collaboration. Several federal agencies have implemented ELAs to drive innovation through location-based insights and engagement with citizens.
Esri US Market Potential Database Methodology StatementEsri
Esri calculates market potential by combining Tapestry segmentation data with consumer survey data to determine consumption rates by demographic segment. They estimate the number of potential consumers in an area and compare it to national averages to calculate a Market Potential Index. Esri's data development team, led by a chief demographer, has decades of experience creating market intelligence datasets including demographic, consumer spending, and market potential data used as industry benchmarks.
The Los Angeles Unified School District uses a smartphone app integrated with its GIS to allow students and faculty to report maintenance issues like graffiti or broken equipment. When an issue is reported, details are sent to the district's asset management system to generate a work order. The app is part of the district's effort to expand GIS use and involve the community in facility upkeep.
This document discusses the four main goals of a successful utility company according to the former president of a utility company: 1) make money, 2) keep customers happy, 3) keep employees safe and happy, and 4) stay out of trouble. It explains how location analytics can help utilities better understand the relationships between various key performance indicators (KPIs) that measure how well a utility is meeting these goals, in order to gain business insights and address issues like pockets of poor reliability.
2014 Esri US Business Locations and Business Summary Data: Methodology StatementEsri
This document summarizes Esri's methodology for its 2014 US business locations and business summary data. It obtains business data from Dun & Bradstreet, including names, locations, industries, employees and sales for over 24 million US businesses. Dun & Bradstreet collects this data from various public and private sources. Esri geocodes over 96% of business addresses and assigns geographic codes. It then aggregates the business data by geographic areas and reports industry, employment and sales information. Esri's experienced data development team oversees the process of compiling, analyzing and creating market segmentation from the business data.
Wendy's, Arby's, and Culver's restaurants all use Esri location analytics software and data to optimize site selection for new locations and evaluate existing locations.
Wendy's implemented a new Esri-based solution to streamline site screening and market assessment. It allows viewing sales records, demographics, and reports on a map.
Culver's uses Esri Business Analyst data and maps to compare potential new sites to existing successful locations and evaluate customer demographics. This helps franchisees succeed.
Arby's uses Esri Business Analyst to more accurately assess trade areas and perform spatial analysis to guide decisions around growing locations and remodels
INIA- CISA: Análisis de las amenazas en la fauna silvestreEsri
El documento describe cómo un centro de investigación utilizó herramientas SIG para analizar datos sobre animales silvestres ingresados en un centro de recuperación con el fin de identificar especies, áreas y períodos con mayor riesgo de amenazas y sus relaciones con factores humanos y ambientales. Esto permitió enfocar medidas correctivas de manera más eficiente para conservar la fauna silvestre y prevenir amenazas. En particular, se analizó el riesgo de colisión de rapaces nocturnas con vehículos, identificando las zonas de mayor
Aena Aeropuerto Adolfo Suárez-Barajas crea potentes aplicaciones para sus cli...Esri
Aena Aeropuerto Adolfo Suárez-Barajas creó aplicaciones personalizadas para sus clientes internos utilizando ArcGIS, aprovechando su experiencia previa. Estas nuevas aplicaciones son fáciles de usar y gestionar, y permiten responder más rápidamente a las necesidades de los usuarios. Ahora los usuarios internos y externos tienen acceso a herramientas de mapeo actualizadas que mejoran la eficiencia de las operaciones en el aeropuerto.
More Related Content
Similar to Esri News for State and Local Government -- Summer 2012
The University of Calgary uses GIS technology from Esri to manage its large campus. As the university undertakes a $1.5 billion expansion project, the largest in its history, planners are relying on ArcGIS and geodesign principles to analyze design alternatives. The university maintains facilities data in a central data warehouse, with ArcGIS for Server pulling data from ARCHIBUS to enable users to visualize and analyze spatial and facilities information. Going forward, the university aims to fully leverage GIS for additional facilities management tasks like space planning, energy management, and predictive maintenance of infrastructure assets.
Esri News for Water & Wastewater -- Summer 2012Esri
Esri News for Water & Wastewater keeps you informed with software news, events, and user stories showing how GIS brings the geographic advantage to water and wastewater utilities worldwide.
Stories in this issue showcase how GIS helps utilities manage stormwater runoff, improve billing and customer service, and mitigate flooding.
Citizen engagement applications using GIS allow governments to receive real-time feedback from citizens on smartphones. This helps governments understand community needs and improve services. Smart cities recognize citizens as sensors, making it easy for public to report issues online or on mobile devices. The City of Glendale collaborated on an app for citizens to report issues like potholes with photos and locations sent to the city for tracking and resolution. Incorporating citizen data helps governments operate more smoothly and responsively to community needs.
This document discusses how geographic information systems (GIS) can help electric transmission utilities manage assets and infrastructure, analyze planning and vulnerabilities, automate workforces, and provide situational awareness. GIS allows utilities to view, organize, and understand large amounts of spatial and asset data for transmission lines, facilities, and customers. It enables utilities to model routes, ensure regulatory compliance, dispatch crews efficiently, and communicate system operations and investments to regulators and the public. The document promotes Esri GIS software and services for electric transmission applications.
Esri News for Federal Government Winter 2012/2013 issueEsri
The United States Environmental Protection Agency (EPA) has built a map service called EPA GeoPlatform on Esri's ArcGIS Online for Organizations to make geospatial data and tools more accessible to EPA staff. EPA GeoPlatform includes public and private cloud components to share internal and external data. It supports EPA activities like enforcement targeting and environmental justice screening. EPA sees benefits like increased access to decision-making tools and cost savings from standardization. EPA GeoPlatform serves as the agency's centralized hub for hosted map services.
Geographic information systems (GIS) integrate hardware, software, and data to capture, manage, analyze and display geographically referenced information. Utilities worldwide use GIS to manage the location of millions of miles of infrastructure assets and link this data to customer information systems. GIS enables utilities to identify vulnerabilities, plan new infrastructure investments, and understand customer satisfaction through spatial analysis tools. GIS also supports workforce automation and situational awareness to more efficiently dispatch crews and communicate with regulators.
Esri News for State and Local Government Spring 2013 issueEsri
The US population continued to grow more diverse in 2012, with rising racial/ethnic diversity and changes in household composition. While the housing market recovery remained slow overall, signs of recovery were seen in some areas. Housing growth varied across the country, driven by factors like military presence in some areas and economic growth in others. Traditional husband-wife families with children continued to decline as a share of households.
Esri News for State and Local Government Winter 2012/2013 issueEsri
The document discusses how Utah County, Utah updated its GIS data model using the ArcGIS for Local Government Information Model. Patrick Wawro, the GIS manager, decided to abandon his individual efforts to update the data model and instead model the data on the information model, which is built on best practices from governments around the US. This standardized and modernized the county's work. Using the information model also makes it easier for cities to take advantage of ArcGIS for Local Government templates and allows the county to easily adopt new technologies. The county is now taking advantage of templates for applications like an election polling places app and developing other apps based on templates.
GIS technology provides utilities with a geographic approach to implementing a smart grid by helping to manage data, plan infrastructure, and automate workforce operations. GIS captures smart grid data like customer behavior and device locations, analyzes factors like demand response, and monitors projects through maps and reports. By integrating accurate location data, GIS enables utilities to efficiently build and operate a smart grid network.
The Esri Nonprofit Program provides GIS software to qualified nonprofit organizations like Save the Children Italia, Direct Relief International, and Habitat for Humanity.
Esri provides the ArcGIS software platform to help organizations manage their water systems. ArcGIS allows users to integrate data from various systems, collaborate across departments, visualize information through maps and reports, and analyze data for planning, maintenance, and compliance. It offers solutions for asset management, planning and analysis, field mobility, operational awareness, and stakeholder engagement to support managing all aspects of a water utility.
This document summarizes Esri's water resource management software solutions. It describes how Esri allows users to understand water resource problems by integrating diverse data types into visualizations. Esri's tools also enable users to simulate scenarios, design management plans, and implement solutions. The software works across devices and with other systems. Esri aims to provide geographic expertise to help communities address water challenges.
The document discusses how geographic information system (GIS) technology helps community leaders make more informed decisions and take real-time action. It provides four key ways GIS does this: 1) Real-time dashboards visualize real-time data to help allocate resources efficiently during emergencies; 2) Story maps improve communication and understanding with stakeholders; 3) Map analysis helps communities understand and combat issues like the opioid epidemic; 4) Field accessibility allows workers to make better remote decisions and assign help without delay.
An Esri enterprise license agreement (ELA) provides federal agencies with unlimited access to Esri's latest GIS software and tools. This streamlines procurement and allows all staff to use applications that improve services, data analysis, planning, and collaboration. Several federal agencies have implemented ELAs to drive innovation through location-based insights and engagement with citizens.
Esri US Market Potential Database Methodology StatementEsri
Esri calculates market potential by combining Tapestry segmentation data with consumer survey data to determine consumption rates by demographic segment. They estimate the number of potential consumers in an area and compare it to national averages to calculate a Market Potential Index. Esri's data development team, led by a chief demographer, has decades of experience creating market intelligence datasets including demographic, consumer spending, and market potential data used as industry benchmarks.
The Los Angeles Unified School District uses a smartphone app integrated with its GIS to allow students and faculty to report maintenance issues like graffiti or broken equipment. When an issue is reported, details are sent to the district's asset management system to generate a work order. The app is part of the district's effort to expand GIS use and involve the community in facility upkeep.
This document discusses the four main goals of a successful utility company according to the former president of a utility company: 1) make money, 2) keep customers happy, 3) keep employees safe and happy, and 4) stay out of trouble. It explains how location analytics can help utilities better understand the relationships between various key performance indicators (KPIs) that measure how well a utility is meeting these goals, in order to gain business insights and address issues like pockets of poor reliability.
2014 Esri US Business Locations and Business Summary Data: Methodology StatementEsri
This document summarizes Esri's methodology for its 2014 US business locations and business summary data. It obtains business data from Dun & Bradstreet, including names, locations, industries, employees and sales for over 24 million US businesses. Dun & Bradstreet collects this data from various public and private sources. Esri geocodes over 96% of business addresses and assigns geographic codes. It then aggregates the business data by geographic areas and reports industry, employment and sales information. Esri's experienced data development team oversees the process of compiling, analyzing and creating market segmentation from the business data.
Wendy's, Arby's, and Culver's restaurants all use Esri location analytics software and data to optimize site selection for new locations and evaluate existing locations.
Wendy's implemented a new Esri-based solution to streamline site screening and market assessment. It allows viewing sales records, demographics, and reports on a map.
Culver's uses Esri Business Analyst data and maps to compare potential new sites to existing successful locations and evaluate customer demographics. This helps franchisees succeed.
Arby's uses Esri Business Analyst to more accurately assess trade areas and perform spatial analysis to guide decisions around growing locations and remodels
Similar to Esri News for State and Local Government -- Summer 2012 (20)
INIA- CISA: Análisis de las amenazas en la fauna silvestreEsri
El documento describe cómo un centro de investigación utilizó herramientas SIG para analizar datos sobre animales silvestres ingresados en un centro de recuperación con el fin de identificar especies, áreas y períodos con mayor riesgo de amenazas y sus relaciones con factores humanos y ambientales. Esto permitió enfocar medidas correctivas de manera más eficiente para conservar la fauna silvestre y prevenir amenazas. En particular, se analizó el riesgo de colisión de rapaces nocturnas con vehículos, identificando las zonas de mayor
Aena Aeropuerto Adolfo Suárez-Barajas crea potentes aplicaciones para sus cli...Esri
Aena Aeropuerto Adolfo Suárez-Barajas creó aplicaciones personalizadas para sus clientes internos utilizando ArcGIS, aprovechando su experiencia previa. Estas nuevas aplicaciones son fáciles de usar y gestionar, y permiten responder más rápidamente a las necesidades de los usuarios. Ahora los usuarios internos y externos tienen acceso a herramientas de mapeo actualizadas que mejoran la eficiencia de las operaciones en el aeropuerto.
El Ayuntamiento de Móstoles implementó una plataforma Smart City utilizando ArcGIS para mejorar la eficiencia, permitir la participación ciudadana y gestionar los activos municipales en tiempo real. La solución integró toda la información municipal en una sola plataforma e incorporó sensores para supervisar servicios como el alumbrado público. Además, una aplicación permite a los ciudadanos reportar incidencias y el ayuntamiento responder más rápido, ahorrando costos.
ArcGIS Online es una plataforma en la nube que permite crear y compartir mapas, aplicaciones y datos geográficos. Los usuarios pueden publicar y almacenar servicios web en la nube, crear mapas interactivos a partir de datos como hojas de cálculo, y colaborar y compartir contenido con otros mediante grupos privados o públicos.
Portal for ArcGIS is a content management system that provides a framework to easily manage and secure geographic assets within an organization. It extends the reach of GIS to everyone in an organization, enabling better decision making. Portal for ArcGIS can be used to implement web GIS on-premises or in the cloud for organizations with specialized security requirements. It will be included with ArcGIS for Server Standard and Advanced starting at version 10.3.
GIS-Based Web Services Provide Rapid Analysis and Dissemination of Maritime DataEsri
The Royal Australian Navy's Hydrography, Meteorology and Oceanography Branch is responsible for collecting, managing, analyzing, and disseminating meteorological and oceanographic data to enable defense users to properly consider environmental impacts. This data comes in large volumes and various formats. Using ArcGIS for Server and custom scripts, the branch can serve this data as OGC web services, including nautical charts and bathymetry as WMS and netCDF weather data as WMS and WCS. This allows for rapid analysis and dissemination of data to gain knowledge of the battlespace and environment.
An Effective Tool for Drinking Water ProtectionEsri
The document discusses ICWater, a tool developed by Leidos to predict the spread and impact of hazardous material releases in river systems. ICWater forecasts (1) where contaminants will travel, (2) if they will reach drinking water intakes, (3) when they will arrive, and (4) if concentrations will threaten human health. It interfaces with USGS stream gauges and databases on infrastructure to provide timely information to decision makers. ICWater successfully modeled the 2014 Elk River chemical spill in West Virginia to advise authorities and protect drinking water.
GeoCollector for ArcPad is a mobile GIS solution that combines Esri's ArcPad software with Trimble GPS hardware to improve the accuracy of collected location data. It provides field workers with a rugged tablet equipped with an integrated GPS receiver and ArcPad software for mapping and data collection. This solution allows organizations to make timely decisions based on reliable location information gathered by field staff.
GeoCollector for ArcGIS for Windows Mobile is a mobile GIS solution that combines Esri's GIS software with Trimble's GPS hardware to improve the accuracy of collected data. It allows field workers to visualize maps, collect geo-located data, and integrate accurate location information into organizational decision making. The solution includes a Trimble Geo 7X handheld device with integrated GPS receiver and ArcGIS for Windows Mobile software for mobile field mapping and data collection with minimal training.
Data Appliance for ArcGIS is an enterprise solution that provides high performance and secure access to terabytes of preloaded geospatial data stored on a network-attached storage device. It includes global basemaps that allow users to immediately build mapping applications. Organizations can publish maps and build apps to share securely behind their firewall. A server bundle is also available for organizations that do not have ArcGIS for Server.
This document describes new premium imagery services from Esri and BlackBridge that provide continuously updated 5-band, 5-meter imagery for use in ArcGIS. The services include a Living Image Basemap service sourced from BlackBridge's RapidEye constellation, regional Mosaics services with virtually cloud-free hand-picked images, and a Living Image Multispectral service providing temporal multispectral imagery through online services.
GeoPlanner for ArcGIS is a web-based app that helps users create, assess, and share planning designs using the geographic knowledge and tools of the ArcGIS platform. It allows users to bring in their own planning data, sketch design plans, compare alternative designs using dashboards, and enable collaboration throughout the planning process. GeoPlanner incorporates each aspect of a geodesign workflow into a single app so that designers, evaluators, and the public can assess the impacts of various scenarios. The app runs on both desktop and mobile devices with touch-enabled tools, supporting planning and design access from anywhere.
This document summarizes an Esri and AccuWeather partnership that provides weather data and warnings through ArcGIS Online. It allows key personnel to access real-time weather reports and warnings to communicate updates. The partnership protects people, property, and assets from severe weather threats with AccuWeather warnings developed by meteorologists. ArcGIS tools can analyze weather data to understand weather impacts and help determine emergency procedures. AccuWeather aims to provide the earliest warnings to enact procedures and save lives.
Esri and Airbus Defense & Space provide imagery products and services including thematic imagery layers with region-specific basemaps and fresh 50cm resolution orthorectified imagery. Their site monitoring service analyzes changes at targeted sites on a daily, weekly or monthly basis and delivers a detailed change detection report as an ArcGIS image service and Story Map app. Their satellite tasking and archive app allows users to task Airbus Defense & Space satellites to acquire new imagery over areas of interest or order images from the archive, with images delivered as an ArcGIS image service.
This document provides a summary of various US demographic and business data sources available from Esri, including descriptions, frequencies of updates, and data vintages. It describes datasets covering topics such as population, households, income, businesses, retail sales, crime, banking and demographics. The data comes from sources including the US Census Bureau, Bureau of Labor Statistics, Dun & Bradstreet and other public and private organizations. Most datasets are updated annually, with some updated decennially, quarterly or semiannually.
ArcGIS for Server on Microsoft Azure JumpstartEsri
This document discusses ArcGIS for Server on Microsoft Azure and the ArcGIS for Server on Microsoft Azure Jumpstart offering from Esri. It provides an overview of deploying ArcGIS for Server in the Microsoft Azure cloud, including advantages such as lower hardware costs, automatic scaling, and leveraging the Azure management portal. It then describes the Jumpstart as providing on-site support and training to help customers get started with ArcGIS Server on Azure, including orientation, VM setup, data loading, service creation, and custom VM configuration. It notes that Esri Professional Services can determine if the Jumpstart is a good fit or provide custom services if additional needs exist. The Jumpstart can be purchased through Esri Professional Services or a customer's
ArcGIS provides tools and capabilities to enable naval units to operate self-sufficiently in remote locations with limited bandwidth. It allows warfighters to access and analyze geospatial data through familiar applications like dashboards and Microsoft Office. The ArcGIS platform delivers low-cost and interoperable solutions to support maritime operations and command and control decisions. It helps transform raw data into actionable intelligence through geoanalytics and visualization.
Esri Geoportal Server is an open source product that enables discovery and use of geospatial resources like datasets, rasters, and web services. It helps organizations manage and publish metadata for their geospatial resources so users can discover and connect to those resources. Key features include supporting international standards, cataloging GIS resources regardless of location or type, and facilitating discovery through a customizable geoportal web interface.
GeoEvent Extension for Server allows users to connect streaming sensor data to GIS applications in real time to monitor assets and alert personnel of specified conditions. It can process and filter multiple data streams using user-defined rules, and includes connectors for common sensors. Key benefits include incorporating real-time data into existing GIS systems to show updated information and detect important spatial or attribute events. The software can be integrated with various monitoring applications and deployed on-premises or in the cloud.
Esri News for State and Local Government -- Summer 2012
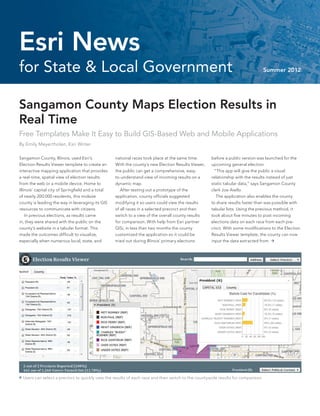
1. Esri News
for State & Local Government Summer 2012
Sangamon County Maps Election Results in
Real Time
Free Templates Make It Easy to Build GIS-Based Web and Mobile Applications
By Emily Meyertholen, Esri Writer
Sangamon County, Illinois, used Esri’s national races took place at the same time. before a public version was launched for the
Election Results Viewer template to create an With the county’s new Election Results Viewer, upcoming general election.
interactive mapping application that provides the public can get a comprehensive, easy- “This app will give the public a visual
a real-time, spatial view of election results to-understand view of incoming results on a relationship with the results instead of just
from the web or a mobile device. Home to dynamic map. static tabular data,” says Sangamon County
Illinois’ capital city of Springfield and a total After testing out a prototype of the clerk Joe Aiello.
of nearly 200,000 residents, this midsize application, county officials suggested The application also enables the county
county is leading the way in leveraging its GIS modifying it so users could view the results to share results faster than was possible with
resources to communicate with citizens. of all races in a selected precinct and then tabular lists. Using the previous method, it
In previous elections, as results came switch to a view of the overall county results took about five minutes to post incoming
in, they were shared with the public on the for comparison. With help from Esri partner elections data on each race from each pre-
county’s website in a tabular format. This GISi, in less than two months the county cinct. With some modifications to the Election
made the outcomes difficult to visualize, customized the application so it could be Results Viewer template, the county can now
especially when numerous local, state, and tried out during Illinois’ primary elections input the data extracted from
Users can select a precinct to quickly view the results of each race and then switch to the countywide results for comparison.
3. Sangamon County Maps Election Results in Real Time continued from page 1
hard-copy ballots directly into the map- them of the new boundaries is an added
For more information,
ping application within two minutes. benefit of the app,” says Sangamon County
The application also gives citizens the first GIS manager Tracy Garrison. contact Michael
detailed look at new precinct boundaries, After seeing how easy it is to use Esri’s web
Healander, state and
which were adjusted in the recent decennial mapping application templates to extend
redistricting process. Though the county the value of its GIS, the county is considering local government general
offers a basic map of the new precincts building additional applications, starting with
manager, Geographic
online, the application provides a more user- a tax parcel viewer.
friendly way to view the exact locations of new “Anyone, any county can do this,” says Information Services, Inc.,
boundaries and the names of local candidates Garrison.
at 205-941-0442, ext. 150,
who are competing to represent each one. To browse all free mapping application
“Most people are familiar with the old templates for local government, visit esri.com or mhealander@gisinc.com.
precincts, so the fact that this helps us inform /arcgisforlocalgov.
Sangamon
County’s elections
application may
be viewed from
a smartphone,
allowing citizens
to track incoming
results from any
location
“Anyone, any county can
do this.”
Tracy Garrison, GIS manager, Sangamon
County
Summer 2012 esri.com/localgov 3
4. Thought Leadership
Voting: The Original Form of
Citizen Engagement
There’s a considerable amount of discussion Over the past year, I have performed
these days on improving citizen engage- exhaustive research as to how governments
ment. Hardly a day goes by that a person have progressed in supporting the voter.
Christopher Thomas, doesn’t see or hear the word transparency or Admittedly, I was a bit shocked to find that in
Director, Government accountability. And it’s great to know that GIS this age of smart devices and web applica-
Markets is playing an important role in improving the tions, the voter is often limited to PDF maps
Federal, State, and relationship between citizens and govern- of polling places, clunky polling place locators
Local ment. In fact, each day I am made aware of with no driving directions, cryptic voting
mapcentric applications designed to make life result information, and downloadable historic
a little easier. voter turnout data.
It strikes me funny, though, that we appear The results of this research showed that
to have forgotten to focus on the ultimate form governments and the GIS profession have
of civic engagement—voting. While GIS finds not kept pace with the emerging trends of
its way into the elections process in four-year applications for the mobile citizen or paid sig-
cycles, it begs the question, Why is GIS not a nificant attention to the most important form
continuous part of voter engagement? If you of civic engagement. Before I receive calls and
don’t believe me, simply query your favorite e-mails, I fully recognize there are a handful of
search engine on GIS and elections and you’ll states, cities, and counties that have stepped
see a spike in references that follow these up to this engagement. However, we’ve defi-
four-year cycles. nitely not reached Angry Birds popularity in
These spikes definitely highlight the value meeting the demands of voters. And let’s not
of GIS support of the elections process. For forget that these voters care more about civic
the upcoming election, counties such as engagement than the average citizen.
Vanderburgh County, Indiana, have success-
fully created lightweight smartphone ap- Finding the Right Resources
plications to support voters. In Vanderburgh, In addition to supporting elections on the
the application helps people find newly front end, GIS can support many business
consolidated voting centers, which will save processes of elections management including
the county $80,000 per election. But why address validation, polling place siting and
does this kind of GIS support come every four optimization, routing of elections volunteers
years, when elections happen year in and year and personnel, mapping of voter turnout for
out? Wouldn’t a map viewer of historic data planning and decision support, development
offer transparency into the actions of voters? of precinct maps, redistricting, and genera-
I have my own suspicions as to why this cycle tion of real-time election results.
happens, but I’ll leave that discussion for Esri and our developer partners recognize
another day. that using GIS for elections is a critical compo-
nent of citizen engagement. Together we are
Keeping Up with Citizen working hard to deliver applications that will
Expectations help modernize the voting process. A way to
In my days as a GIS administrator, I was made jump-start this modernization of civic engage-
aware of the opportunity for GIS to support ment is to take advantage of the Esri ArcGIS
the voting process. I was shocked to learn that for Local Government initiative. You’ll find free
hundreds of citizens would call the county application templates that you can customize
clerk’s office and the library to find out the or simply use with some geographic localiza-
location of their polling place. I am dating tion. Check out the application templates on
myself here, but my first ArcView 1.0 applica- Esri’s election page at esri.com/elections. If
tion for citizen support was an application that you need a little help getting started, Esri can
provided phone support for such inquiries. also provide consulting through a network
Fast forward to 2012, and the need to connect of experts who can get your project off to a
citizens to the voting process still exists. good start.
4 Esri News for State & Local Government Summer 2012
5.
6. Data
Identify and Reach Senior Voters
Marketing Tools and Segmentation Data Reveal the Answers for Elected Officials
Target Your Message to Senior Voters Because being senior no longer means spending days rocking
Like it or not, we’re all aging. In 2000, the US median age was 35.3 years. on the front porch, how can campaigns identify, understand, and
By 2010, this number had increased to 37.1 years. Today, seniors rep- reach the different groups of senior voters with the right messaging?
resent 25.2 percent of the total US population, a proportion expected Segmentation can help campaigns resolve this challenge.
to increase to almost 27.6 percent by 2016. More people are reaching Segmentation systems operate on the theory that people with
their seventies, eighties, and beyond, and the jump in median age similar tastes, lifestyles, and behaviors seek and live near others with
is also due to aging baby boomers. Approximately 78 million baby the same tastes. When seniors are segmented by affluence, education,
boomers were born between 1946 and 1964, constituting one of the employment, and lifestyle, differences in their preferences become
largest US demographic cohorts. According to the US Census Bureau, more apparent. Their behaviors, including product, leisure, and media
another American turns 65 every 13 seconds; approximately 10,000 preferences, can be measured, predicted, and targeted.
baby boomers retire every day. The interests, social influences, goals, Using proven segmentation methodology introduced more than
and preferences of boomers and other seniors vary within the cohort 30 years ago, Esri’s Tapestry Segmentation system classifies US neigh-
and differ from those of previous generations. borhoods into 65 unique segments based on their socioeconomic and
demographic composition. Tapestry combines the who of lifestyle
Seniors Stay Informed, Donate, Volunteer—and Vote demography with the where of local geography to create detailed
Seniors are truly a force to be reckoned with, both in terms of their neighborhood lifestyle segments with distinct consumer behaviors.
numbers and also for their interest in politics and current events; they Tapestry adds valuable lifestyle information to basic demograph-
stay informed, donate, raise funds, volunteer, and, most important, ics such as identifying people who are likely to work on a political
vote. Seniors also have unique concerns during elections, such as campaign, donate to a campaign, or vote in an election, and attitudinal
retirement and Medicare. data such as people who consider themselves somewhat liberal or
somewhat conservative.
7. Esri News
New and Noteworthy
Tapestry recognizes the demographic and lifestyle differences
among seniors and classifies them into nine distinct lifestyle segments:
• Prosperous Empty Nesters: Active, affluent married couples with no
children at home are transitioning from child rearing into retirement.
They will help with fund-raising, write to a newspaper editor or radio Ride Amigos is a new Esri partner that specializes in
station, and volunteer. helping people find more productive ways to commute,
• Silver and Gold: These wealthy, educated seniors have retired from given their personal lifestyle choices. In Century City,
professional occupations. They participate in local civic issues and California, its commuter map is used to find car pools or
write to newspaper and magazine editors.
vanpools or determine times and routes for biking
• Rustbelt Retirees: Singles or married couples with no children are
and public transportation. Ride Amigos leverages live
staying put in Rustbelt industrial cities. These settled, hardworking,
traffic data; locations of facilities such as bike racks,
politically conservative folks help with fund-raising, visit elected
officials, and work for political parties or candidates.
charging stations, and bus stops; and the time, money,
• Retirement Communities: Older, educated singles who live alone and CO2 saved by taking various modes of alternative
in multiunit buildings or assisted-living facilities. They are politi- transportation. Individuals compete for prizes and provide
cally active, are “joiners,” and belong to civic clubs and charitable valuable data to cities by logging their trips and earning
organizations. points for themselves, their companies, and their cities. Visit
• The Elders: Informed, independent, and involved, these retirees http://rideamigoscorp.com for more information. To see the
live in senior communities. They’re members of veterans’ clubs and Century City application, visit www.Commute90067.com.
fraternal orders.
• Senior Sun Seekers: In fast-growing southern and western areas,
these retired or soon-to-retire residents join veterans’ clubs and
fraternal orders and perform charity work with these organizations.
• Heartland Communities: Part of life in small-town midwestern and
southern neighborhoods with a country lifestyle, some residents join
fraternal orders or religious clubs, and some become involved with
local politics.
• Simple Living: Life for these seniors is restricted by low incomes.
Community activities are very important; they join fraternal orders
and veterans’ clubs. Cable television is a must for information and
entertainment; they’re big fans of daytime TV.
• Social Security Set: Seniors with very low fixed incomes live in cheap
high-rise apartments in large cities. They read two or more newspa-
pers to keep up with the news.
Ride Amigos technology helps commuters in Century City find
Strengthen Outreach Efforts the best way to travel.
Campaigns can take advantage of valuable segmentation information
by adding Tapestry codes to voter address records—they are a gold
mine of information. Campaigns can then identify their best opportuni-
ties to target volunteers, donations, fund-raising, and other activities.
Messages about concerns and issues can be tailored to resonate with
each audience and be conveyed by preferred media for maximum
reach.
Tapestry Segmentation data is available in 2010 geography as a da-
tabase in multiple formats and geographic levels. The data is also avail-
able in reports and maps on Esri Business Analyst Online (esri.com/ba)
and Community Analyst (esri.com/ca). Business Analyst Desktop and
Business Analyst Server users can access and integrate the data and
reports instantly via the Business Analyst Online APIs. To learn more,
visit esri.com/demographicdata or call 1-800-447-9778.
For more information about Tapestry
Segmentation, visit esri.com/tapestry.
Summer 2012 esri.com/localgov 7
8.
9. Esri News
Solutions for Elections Esri Online
GIS supports mobile polling place locators and interactive maps of Keep Up with Esri UC News
election results to improve the voting experience. Create your own As the annual Esri International User Conference (Esri UC)
helpful apps with Esri’s Election Polling Places app template and the approaches, stay up-to-date on the latest conference infor-
Esri Election Results application template. Visit esri.com mation. The Esri UC blog (esri.com/ucnews) features all of
/engagingcitizens to download the templates.
the news and highlights you need, such as restaurant recom-
mendations, details on area attractions, special events, and
more. You can also get updates on Facebook (facebook
.com/esriuc) and Twitter (twitter.com/esriuc).
Join GIS
colleagues from
around the world
at the Esri UC.
Find Dev Meet Ups
Spain’s El Mundo newspaper maps election results across the country.
Esri is hosting Dev Meet Ups across the United States. These
events give you an opportunity to demonstrate applications,
present interesting concepts or ideas, and connect with
other developers. To find one in your area, check out esri
.com/devmeetups or #devmeetup on Twitter.
Use GIS When You’re Off the Clock
Esri’s ArcGIS for Home Use Program supports ArcGIS users
who want to use GIS technology for things like non-work-
related research or volunteering projects. A $100 annual fee
provides a 12-month license. Learn more about the program
at esri.com/arcgis-for-home.
Polling Place Locations in the City of Naperville, Illinois (Credit: City of
Naperville, Illinois).
Summer 2012 esri.com/localgov 9
10. The City of Salem, Oregon, Broadens
the Reach of GIS
With more than 178,000 users and almost ArcGIS Online for organizations can help them
300,000 public and private items, ArcGIS do exactly that.
Online has grown quickly over the past two The City of Salem’s long-standing GIS
“[ArcGIS Online] brings years. GIS professionals around the world goes back almost 20 years. Managing legacy
use the freely available Software as a Service systems and keeping up with the latest
together everything that platform for discovering, creating, and sharing technology while still maintaining the best
we’ve been hoping to do maps, data, and applications. ArcGIS Online service possible has proved very challenging.
has now been expanded into a subscription- ArcGIS Online is seen as a great product that
in terms of distributing based service that is completing beta testing. can make it easy to migrate from a legacy GIS
the value of GIS.” More than 700 organizations have partici- desktop viewer system by providing Software
pated in the beta program to get a first look at as a Service that is easily accessible to all
Susan Blohm, IT Supervisor how ArcGIS Online for organizations can make in-house GIS users with minimal training. With
their maps and data more accessible and ArcGIS Online, managing and sharing the
extend the reach of their GIS. city’s GIS information becomes a lot easier,
One such organization is the City of Salem, and that aspect alone has had a positive
Oregon, which Esri invited to participate in impact on overcoming internal concerns.
the beta program. Located 47 miles south of ArcGIS Online allows all users to create and
Portland, Salem is Oregon’s capital and the share web maps and take advantage of the
second-largest city in the state. The city has products created by ArcGIS for Desktop
about 1,200 employees and 11 departments, power users, who share them through ArcGIS
with GIS users in nearly every department and Online with others in the organization.
GIS staff distributed throughout 3 departments. Reducing the amount of resources spent
The enterprise GIS is managed from within the on maintaining legacy systems is not the only
Department of Information Technology, and advantage ArcGIS Online can provide to the
citywide GIS activities are coordinated by the city. One city goal has been to improve how
GIS Advisory and Planning team. A primary GIS information is delivered to the public.
objective of Salem GIS is to provide services Most of the resources at the city have been fo-
to GIS users within the city, both power and cused on building internal maps and applica-
casual users; maintain and manage the GIS tions that are accessible only within the city’s
resources; and develop more efficient ways to firewall. Budgetary and resource constraints
provide GIS-based services to the public. have made it very difficult to stand up services
Doing more with less is the common mantra outside the firewall that would have to include
for local governments of all sizes across the a database, web software, and a map viewer.
United States. When city employees Susan With the introduction of ArcGIS Online, these
Blohm, IT supervisor, and Daniel Brown, are no longer restrictions. ArcGIS Online is
senior GIS programmer/analyst, attended hosted by Esri, and all the City of Salem maps
Esri’s Extend the Reach of Your GIS seminar and items created reside in Esri’s secure cloud
several months ago, they were introduced to infrastructure. In addition, ArcGIS Online
ArcGIS Online for organizations and were very includes a built-in map viewer. Users start with
impressed with what they saw. “It brings to- a basemap gallery to which they can quickly
gether everything that we’ve been hoping to add data files and web services to create
do in terms of distributing the value of GIS,” their own maps. This is an ideal solution for
notes Blohm. “Extend Your Reach is a perfect the City of Salem to better serve the public
title for the seminar because that’s exactly and provide more self-serve options. The city
what ArcGIS Online does.” Participating in the has downloaded the freely available public
beta program gave them the opportunity to Map Gallery template and created a group
try it out for themselves. For years, Blohm and on ArcGIS Online where all the maps that
Brown have been talking about how to get can be viewed through the public gallery are
more value from their city’s GIS by distributing shared. Residents can browse the gallery and
it across the enterprise. The capabilities of interact with maps that provide convenient
10 Esri News for State & Local Government Summer 2012
11. Case Studies
The City of Salem’s GIS users
have a central location for
accessing city maps and other
GIS resources.
information about zoning, recreation, trans- development maps, mobile code enforce-
For more information,
portation, and more. They no longer need to ment, mobile graffiti mapping, and mapping
call the city for all this information. out public works projects, among others. The contact Daniel Brown,
The advantage that ArcGIS Online delivers city has also taken advantage of being able to
City of Salem, Oregon,
is seen in the efficiency it provides for seam- customize the ArcGIS Online for organizations
lessly disseminating information created by home page. It added the Salem GIS logo and IT Department (e-mail:
the city’s internal GIS professionals using designed the look and feel of the map icons
dbrown@cityofsalem.net),
ArcGIS for Desktop. These power users can to reinforce the city’s brand. The Map Gallery
now share their information and products with and Featured Maps sections display city or visit esri.com/agol.
non-power users who still need GIS as part maps, and users can choose from the city’s
of their day-to-day work by uploading maps own basemaps. “With ArcGIS Online, what we
and data to ArcGIS Online through a simple, have now is a better catalog of our maps, data,
wizard-driven interface. This means that the and apps,” says Brown. “It’s a nice gateway that
city now has a way to expose feature services the city was missing and a destination for both
as hosted services, and these can be provided our internal users and the public that will help
to the public in addition to the map services. us improve customer service.”
To get the most out of testing ArcGIS Online ArcGIS Online for organizations will be
for organizations beta, the City of Salem has available in the summer of 2012. Organizations
created a small, cross-departmental test will be able to purchase a subscription that
group. This group collects and provides feed- includes flexible data storage capabilities and
back by going through all the major processes administrative controls for managing user
in ArcGIS Online: publishing maps and hosted accounts and access.
services; creating groups; and sharing maps
through private, organizational, and public
groups. To give more meaning to the ArcGIS
Online beta project, each member of the beta
testing group has committed to create some
type of product that can be shared at the
end. This includes employment and economic
Summer 2012 esri.com/localgov 11
12. Southfield, Michigan, Brings GIS to the Public
via a Cloud-Based Application Portal
Thanks to the cloud and Esri’s ArcGIS for Local Government templates, The polling place locator was one of the first applications the city
the City of Southfield, Michigan, is making its GIS resources available offered, and it has become one of the most beneficial resources for
to citizens through practical, easy-to-use web mapping applications. citizens. Besides providing polling place information, the application
The city worked with Esri partner GISi to create and quickly launch its displays details about state elected officials.
Destination Southfield web map portal. Hosting it in the cloud elimi- “That’s the benefit of using the app templates—we didn’t have to do
nated the need for additional hardware investments. the programming ourselves. We just added our own data,” says Price.
The portal features a growing collection of public applications When city officials suggested adding details about the attorney
created with Esri templates, including a parks and recreation finder; general, secretary of state, and local officials, GISi was able to custom-
a polling place locator; and a campus place finder that helps citizens ize the application to make that possible.
navigate licensing offices, courts, and other facilities commonly used The city plans to further leverage Esri application templates to
for city business. The site also offers a customized city viewer that create tools for internal city use, such as a land-use public notification
includes data on tax parcels, zoning, recycling centers, school districts, viewer and a tool for coordinating city projects with its engineering
and more than a dozen other factors. Each of these applications and public works departments. Though password protected for use
enables citizens to search for locations and view details on an item of only by city employees, the internal applications would be part of the
interest, such as polling place hours or park offerings like hiking trails Destination Southfield portal to take advantage of the cost savings of
and picnic areas. the cloud platform.
“We already had the benefit of our ArcGIS infrastructure in the To view the Destination Southfield portal, visit http://maps
cloud, so that made it easier to push it out to the public via mapping .cityofsouthfield.com/destinationsouthfield. For more information,
apps,” says Sally Price, GIS coordinator for the City of Southfield. “The contact Michael Healander, state and local government general man-
cloud was really the best route for us. It was the least expensive option ager, Geographic Information Services, Inc., at 205-941-0442, ext. 150,
and didn’t require any extra hardware. When Esri released the new or mhealander@gisinc.com.
maps and apps for local government, that seemed like the best way to
The Destination Southfield website gives citizens easy access to a
get this information out to the public. It also ensures compatibility with
variety of web mapping tools.
future ArcGIS software releases.”
Southfield’s polling place locator enables the public to find voting locations, hours, accessibility, and upcoming
registration deadlines and election dates.
12 Esri News for State & Local Government Summer 2012
13.
14. Mobile Application Directs Voters to Shortest
Lines on Election Day
By moving from traditional polling places to
vote centers, Vanderburgh County, Indiana,
saves $85,000 each year. Vote centers allow
citizens to cast their votes at the most
convenient locations instead of only in their
designated precincts. To make voting even
easier, the county offers a free mobile applica-
tion that provides immediate details on the
nearest vote centers, including poll hours, wait
times, and directions. Over 300 citizens have
downloaded the application on their iPhones
or Android phones, and the county expects
use to grow significantly as the word spreads
and major elections approach.
The county leveraged its existing geo-
graphic information system, which is based
on Esri technology, to create a map service
that shows all vote centers. A custom mobile
application was then built using Esri’s ArcGIS
API for Flex to support deployment on both
the iPhone and Android platforms.
To promote public use of the application,
the county works with local media and offers
free downloads from Apple’s App Store and
Android Market. Visit vanderburghvotecenters
.com to access the application or view the vote
centers map online.
Mobile mapping applications based on Esri
technology help local governments worldwide
improve operations and services to citizens.
Esri technology provides a common plat-
form for data sharing to enhance workflows,
improve decision making, and facilitate
communication.
“It’s simple, it’s easy, and it does what we
need. This app is going to become more
and more useful and popular as we ramp up
for a busy election season,” says Susan Kirk,
Vanderburgh County clerk.
A free mobile application directs voters to the nearest vote center.
14 Esri News for State & Local Government Summer 2012
15.
16. Presorted
380 New York Street Standard
Redlands, California 92373-8100 USA US Postage
Paid
Esri
130266 QUAD137M6/12kp