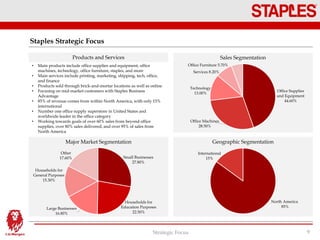
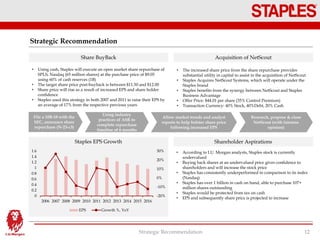
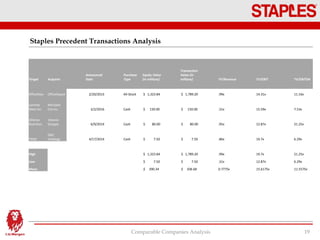
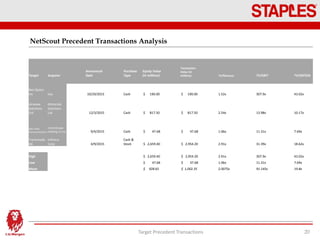
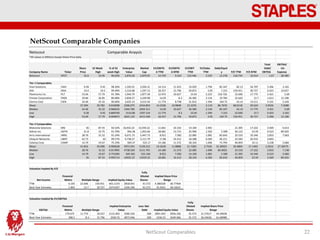
Staples is considering acquiring NetScout Systems to expand into the growing IT services market. The recommendation is for Staples to first repurchase $1 billion of its own shares to increase EPS and share price. Then, Staples would acquire NetScout for $44.01 per share, using 40% stock, 40% debt, and 20% cash. The acquisition would allow Staples to significantly bolster the technology portion of its Business Advantage services and diversify its revenues beyond office supplies.

![Staples Comparable Companies
Staples Comparables 21
Staples Comparable Anaysis
*All values in Millions Except Share Price Data
Company Name Ticker
Share
Price
52 Week
High
% of 52
week High
Enterprise
Value
Market
Cap
EV/EBITD
A TTM
EV/EBITD
A NTM
EV/EBIT
TTM
EV/Sales
TTM
Debt/Equit
y P/E TTM P/E NTM
Total
Debt/
EBITDA
EBITDA/
Int.
Expense
Staples SPLS 9.02 11.37 79% 5,872.95 5,893.95 4.335 4.298 6.47 0.284 19.224 9.208 10.249 0.751 9.921
Tier 1 Comparables
Office Depot ODP 4.34 7.91 54.87% 2,608.95 3,073.95 3.511 2.922 5.672 0.18 94.136 13.525 10.914 2.031 7.989
Essendant ESND 20.77 34.99 59.36% 1,897.57 1,211.23 7.751 7.505 9.674 0.354 98.975 17.75 10.973 2.926 11.897
Micheals Cos Inc MIK 20.02 31.36 63.84% 6,916.56 4,556.11 8.253 8.308 9.562 1.408 9.53 11.45 3.305 6.012
Williams-Sonoma Inc] WSM 47.72 61.97 77.01% 4,433.18 4,626.83 6.709 6.521 8.993 0.891 0.161 15.191 14.249 0
Dicks Sporting Goods DKS 50.71 62.88 80.65% 4,254.70 4,367.25 5.776 7.846 7.834 0.585 0.357 13.614 16.723 0.009 183.617
Mean 28.712 39.822 0.671434 4022.192 3567.074 6.4 6.6204 8.347 0.6836 48.40725 13.922 12.8618 1.6542 52.37875
Median 20.77 34.99 0.638393 4254.7 4367.249 6.709 7.505 8.993 0.585 47.2465 13.614 11.45 2.031 9.943
Low 4.34 7.91 0.548673 1897.565 1211.233 3.511 2.922 5.672 0.18 0.161 9.53 10.914 0 6.012
High 50.71 62.88 0.806457 6916.564 4626.825 8.253 8.308 9.674 1.408 98.975 17.75 16.723 3.305 183.617
Tier 2 Comparables
Cabellas Inc CAB 54.26 63.3 85.72% 8,405.02 3,169.17 18.097 20.305 25.335 2.102 308.135 16.173 19.729 12.132 20.289
Autonation Inc AN 51.77 54.15 95.60% 12,630.17 6,610.57 12.657 11.409 14.509 0.605 259.384 15.349 12.993 6.107 7
Bed Bath and Beyond BBBY 40.04 52.71 75.96% 8,574.47 7,676.24 5.123 4.895 6.126 0.708 58.604 9.882 8.788 0.896 19.136
GNC GNC 8.63 35.9 24.04% 3,762.07 2,366.08 7.651 5.566 8.659 1.425 309.982 10.613 3.733 2.954 11.458
Best Buy Co BBY 44.31 49.4 89.70% 7,541.15 9,043.15 3.55 5.071 5.141 0.191 40.635 10.784 13.307 0.838 26.55
Mean 39.802 51.092 0.742044 8182.576 5773.042 9.4156 9.4492 11.954 1.0062 195.348 12.5602 11.71 4.5854 16.8866
Median 44.31 52.71 0.857188 8405.016 6610.57 7.651 5.566 8.659 0.708 259.384 10.784 12.993 2.954 19.136
Low 8.63 35.9 0.24039 3762.074 2366.082 3.55 4.895 5.141 0.191 40.635 9.882 3.733 0.838 7
High 54.26 63.3 0.956048 12630.17 9043.147 18.097 20.305 25.335 2.102 309.982 16.173 19.729 12.132 26.55
Valuation implied By P/E
Net Income
Financial
Metric
Fully
Diluted
Shares
TTM 0.93 9.53 17.75 5765.76 10738.95 650.55 8.8629 16.5075
Next Year Estmates 0.88 10.914 16.723 6248.09 9573.65 650.55 9.60432 14.71624
Valuation Implied By EV/EBITDA
EBITDA
Financial
Metric
Less: Net
Debt
Fully
Diluted
Shares
TTM 1369 3.511 8.253 4806.559 11298.36 1047 4835.559 11327.36 650.55 7.433032 17.41197
Next Year Estmates 1366.45 2.922 8.308 3992.767 11352.47 1047 4021.767 11381.47 650.55 6.182103 17.49515
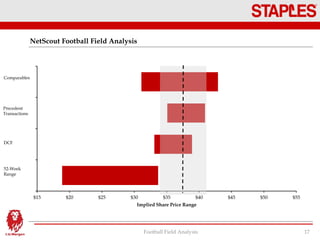
Multiple Range
Implied Share Price
Range
Multiple Range
Implied Share Price
Range
Implied Equity Value
Implied Equity Value
Implied Enterprise
Value](https://image.slidesharecdn.com/2017freshmancasecompstaples-170224032442/85/Staples-Inc-Pitch-Book-21-320.jpg)


![Nibc 2016 [graduate] - [pepper waves] - ppt](https://cdn.slidesharecdn.com/ss_thumbnails/nibc2016-graduate-pepperwaves-ppt-160730071721-thumbnail.jpg?width=640&height=640&fit=bounds)


