Download to read offline


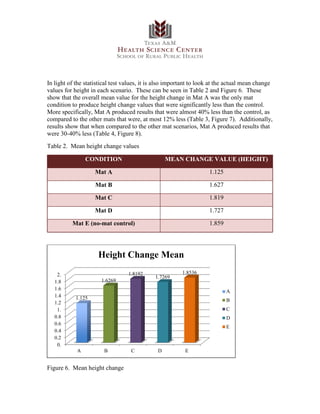
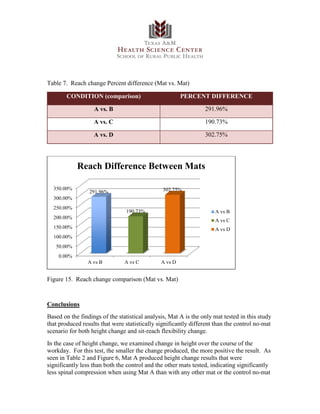
![different than the no-mat control scenario is Mat A (Let’s Gel). The other mats produced
height results that were no different than the no-mat control scenario, or at least not
statistically significantly different.
Comparing Means [ t-test assuming equal variances (homoscedastic) ]
Descriptive Statistics
VAR Sample size Mean Variance
A 28 1.125 0.30269
E 28 1.85357 0.19665
Summary
Degrees Of
Freedom 54
Hypothesized Mean
Difference 0.E+0
Test Statistics 5.45574 Pooled Variance 0.24967
Two-tailed distribution
p-level 0.00000125 t Critical Value (5%) 2.00488
Figure 2. Statistical comparison of conditions A and E (no-mat control)
Comparing Means [ t-test assuming equal variances
(homoscedastic) ]
Descriptive Statistics
VAR
Sample
size Mean Variance
B 26 1.6269 0.28764
E 28 1.85357 0.19665
Summary
Degrees Of
Freedom 52
Hypothesized Mean
Difference 0.E+0
Test Statistics 0.4287 Pooled Variance 0.22124
Two-tailed distribution
p-level 0.67063 t Critical Value (5%) 2.02619
Figure 3. Statistical comparison of conditions B and E (no-mat control)](https://image.slidesharecdn.com/standing-mat-study-texas-am-university-2013-210419194504/85/Standing-mat-study-texas-am-university-2013-4-320.jpg)
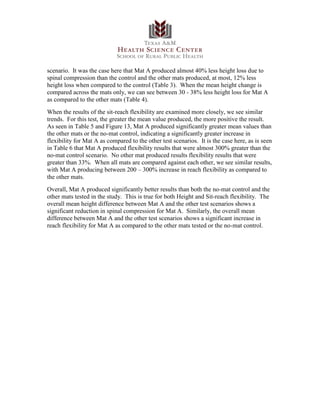
![Comparing Means [ t-test assuming equal variances
(homoscedastic) ]
Descriptive Statistics
VAR
Sample
size Mean Variance
C 26 1.8192 0.28833
E 28 1.85357 0.19665
Summary
Degrees Of
Freedom 52
Hypothesized Mean
Difference 0.E+0
Test Statistics 0.92008 Pooled Variance 0.22486
Two-tailed distribution
p-level 0.36319 t Critical Value (5%) 2.02269
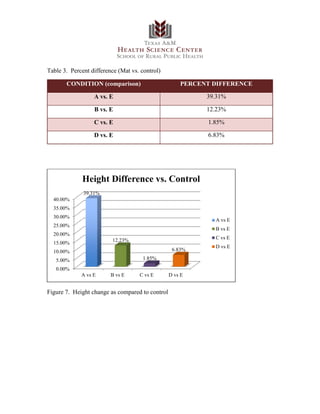
Figure 4. Statistical comparison of conditions C and E (no-mat control)
Comparing Means [ t-test assuming equal variances
(homoscedastic) ]
Descriptive Statistics
VAR
Sample
size Mean Variance
D 26 1.7269 0.14265
E 28 1.85357 0.19665
Summary
Degrees Of
Freedom 52
Hypothesized Mean
Difference 0.E+0
Test Statistics 0.03244 Pooled Variance 0.18102
Two-tailed distribution
p-level 0.97429 t Critical Value (5%) 2.02439
Figure 5. Statistical comparison of conditions D and E (no-mat control)](https://image.slidesharecdn.com/standing-mat-study-texas-am-university-2013-210419194504/85/Standing-mat-study-texas-am-university-2013-5-320.jpg)

![Comparing Means [ t-test assuming equal variances
(homoscedastic) ]
Descriptive Statistics
VAR
Sample
size Mean Variance
A 28 3.13571 4.31868
E 27 0.81071 3.64247
Summary
Degrees Of
Freedom 53
Hypothesized Mean
Difference 0.E+0
Test Statistics 4.36028 Pooled Variance 3.98058
Two-tailed distribution
p-level 0.00006 t Critical Value (5%) 2.00488
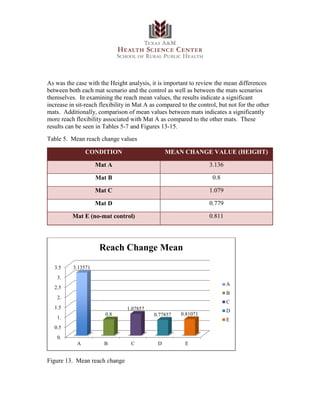
Figure 9. Statistical comparison of conditions A and E (no-mat control)
Comparing Means [ t-test assuming equal variances
(homoscedastic) ]
Descriptive Statistics
VAR
Sample
size Mean Variance
B 27 0.8 5.61556
E 27 0.81071 3.64247
Summary
Degrees Of
Freedom 52
Hypothesized Mean
Difference 0.E+0
Test Statistics 0.01863 Pooled Variance 4.62901
Two-tailed distribution
p-level 0.9852 t Critical Value (5%) 2.00488
Figure 10. Statistical comparison of conditions B and E (no-mat control)](https://image.slidesharecdn.com/standing-mat-study-texas-am-university-2013-210419194504/85/Standing-mat-study-texas-am-university-2013-9-320.jpg)
![Comparing Means [ t-test assuming equal variances
(homoscedastic) ]
Descriptive Statistics
VAR
Sample
size Mean Variance
C 26 1.07857 4.66841
E 27 0.81071 3.64247
Summary
Degrees Of
Freedom 51
Hypothesized Mean
Difference 0.E+0
Test Statistics 0.49165 Pooled Variance 4.15544
Two-tailed distribution
p-level 0.62496 t Critical Value (5%) 2.00488
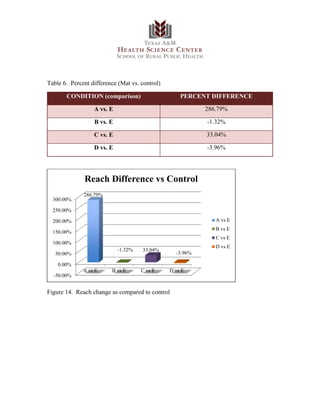
Figure 11. Statistical comparison of conditions C and E (no-mat control)
Comparing Means [ t-test assuming equal variances
(homoscedastic) ]
Descriptive Statistics
VAR
Sample
size Mean Variance
D 27 0.77857 3.65434
E 27 0.81071 3.64247
Summary
Degrees Of
Freedom 52
Hypothesized Mean
Difference 0.E+0
Test Statistics 0.06296 Pooled Variance 3.64841
Two-tailed distribution
p-level 0.95003 t Critical Value (5%) 2.00488
Figure 12. Statistical comparison of conditions D and E (no-mat control)](https://image.slidesharecdn.com/standing-mat-study-texas-am-university-2013-210419194504/85/Standing-mat-study-texas-am-university-2013-10-320.jpg)

The study evaluated 4 anti-fatigue mats (Mats A-D) and a no-mat control for their effects on worker height loss and flexibility changes over an 8-hour workday. Eighteen subjects were recruited from two industrial sites and used each mat/control for 5 days. Height and flexibility measurements were taken before and after each workday. Statistical analysis found that only Mat A (Let's Gel) produced significantly less height loss and greater flexibility increases compared to the no-mat control. The other mats were not significantly different than the control for either measurement. Mat A appears to be the most effective mat at reducing spinal compression and maintaining flexibility over an 8-hour workday.