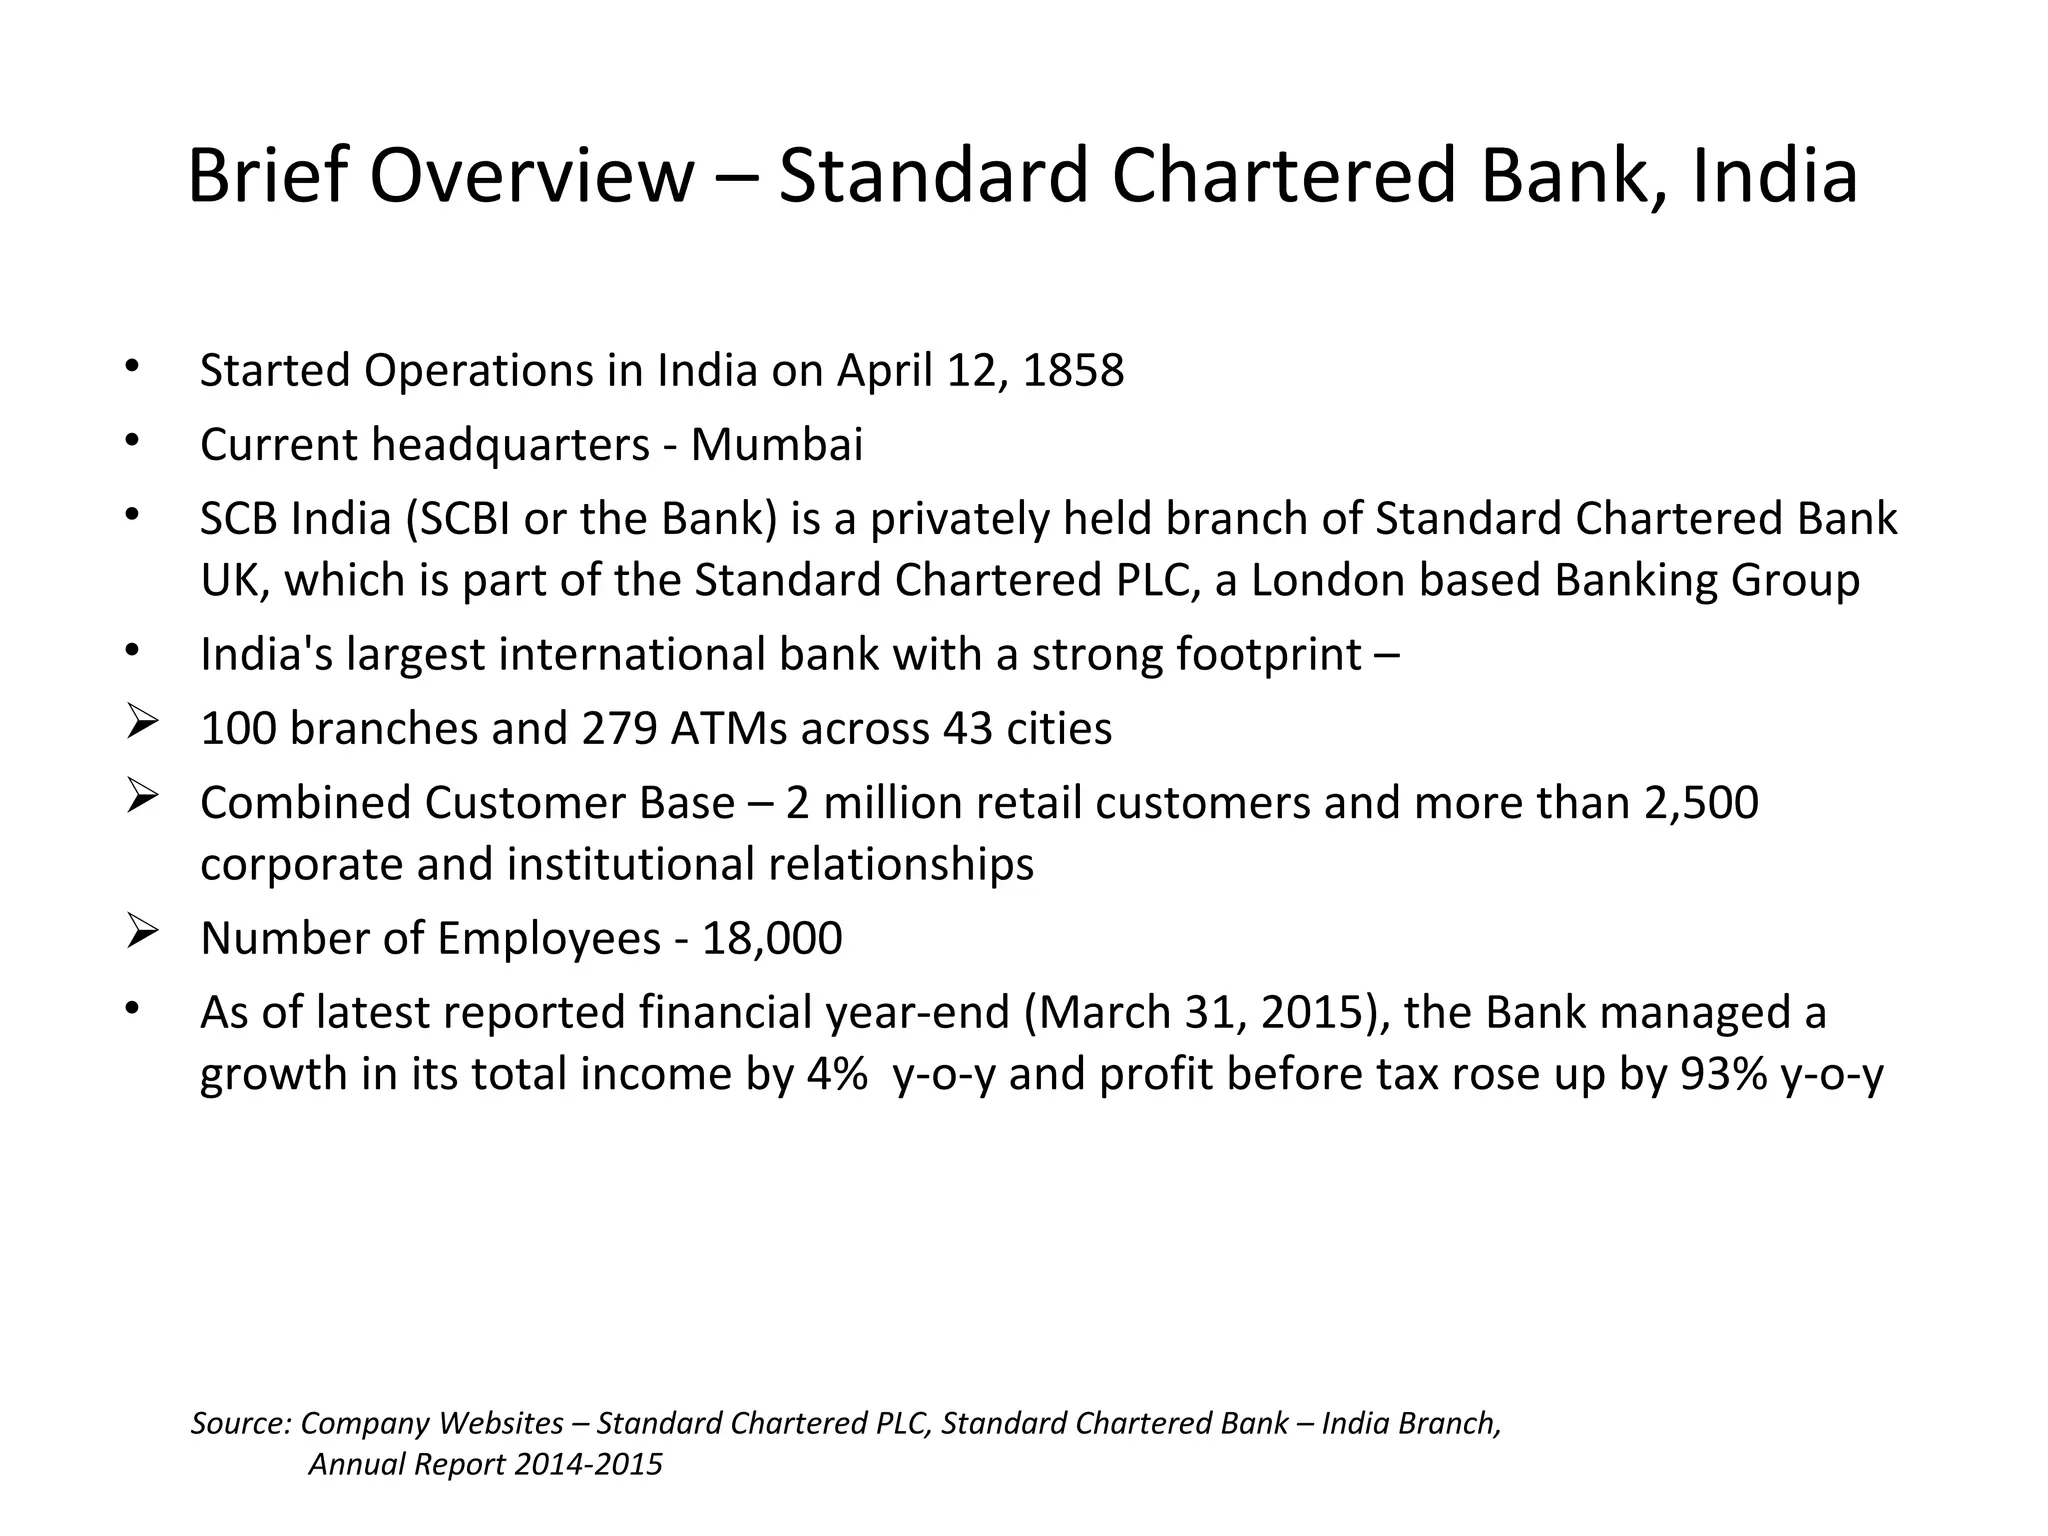
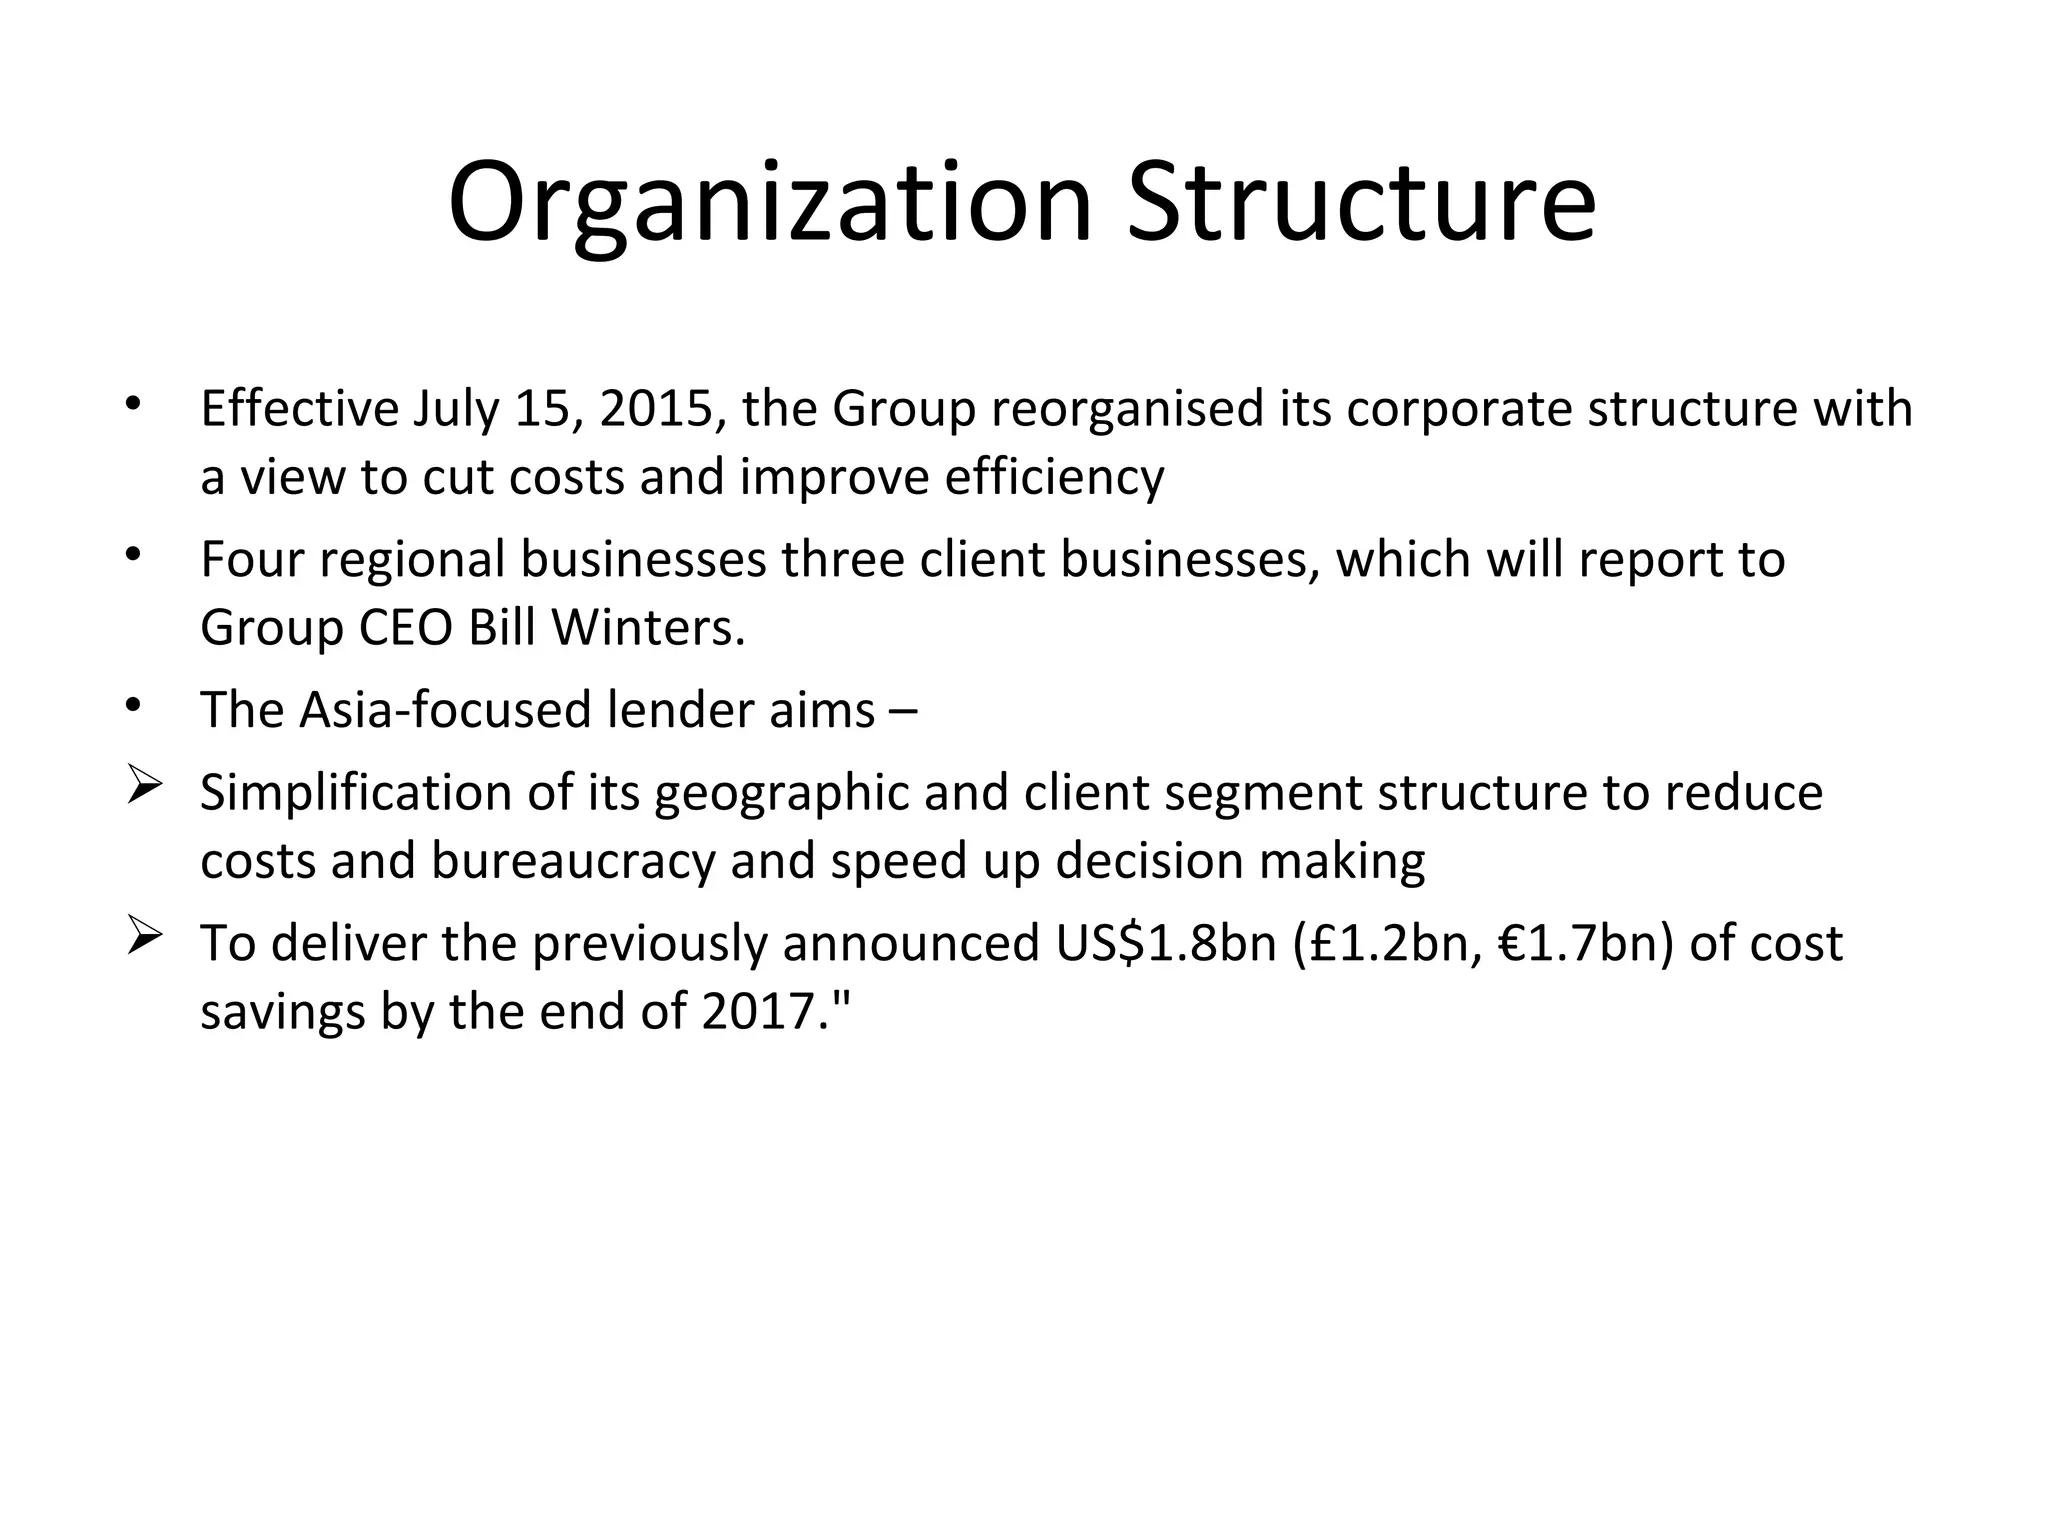
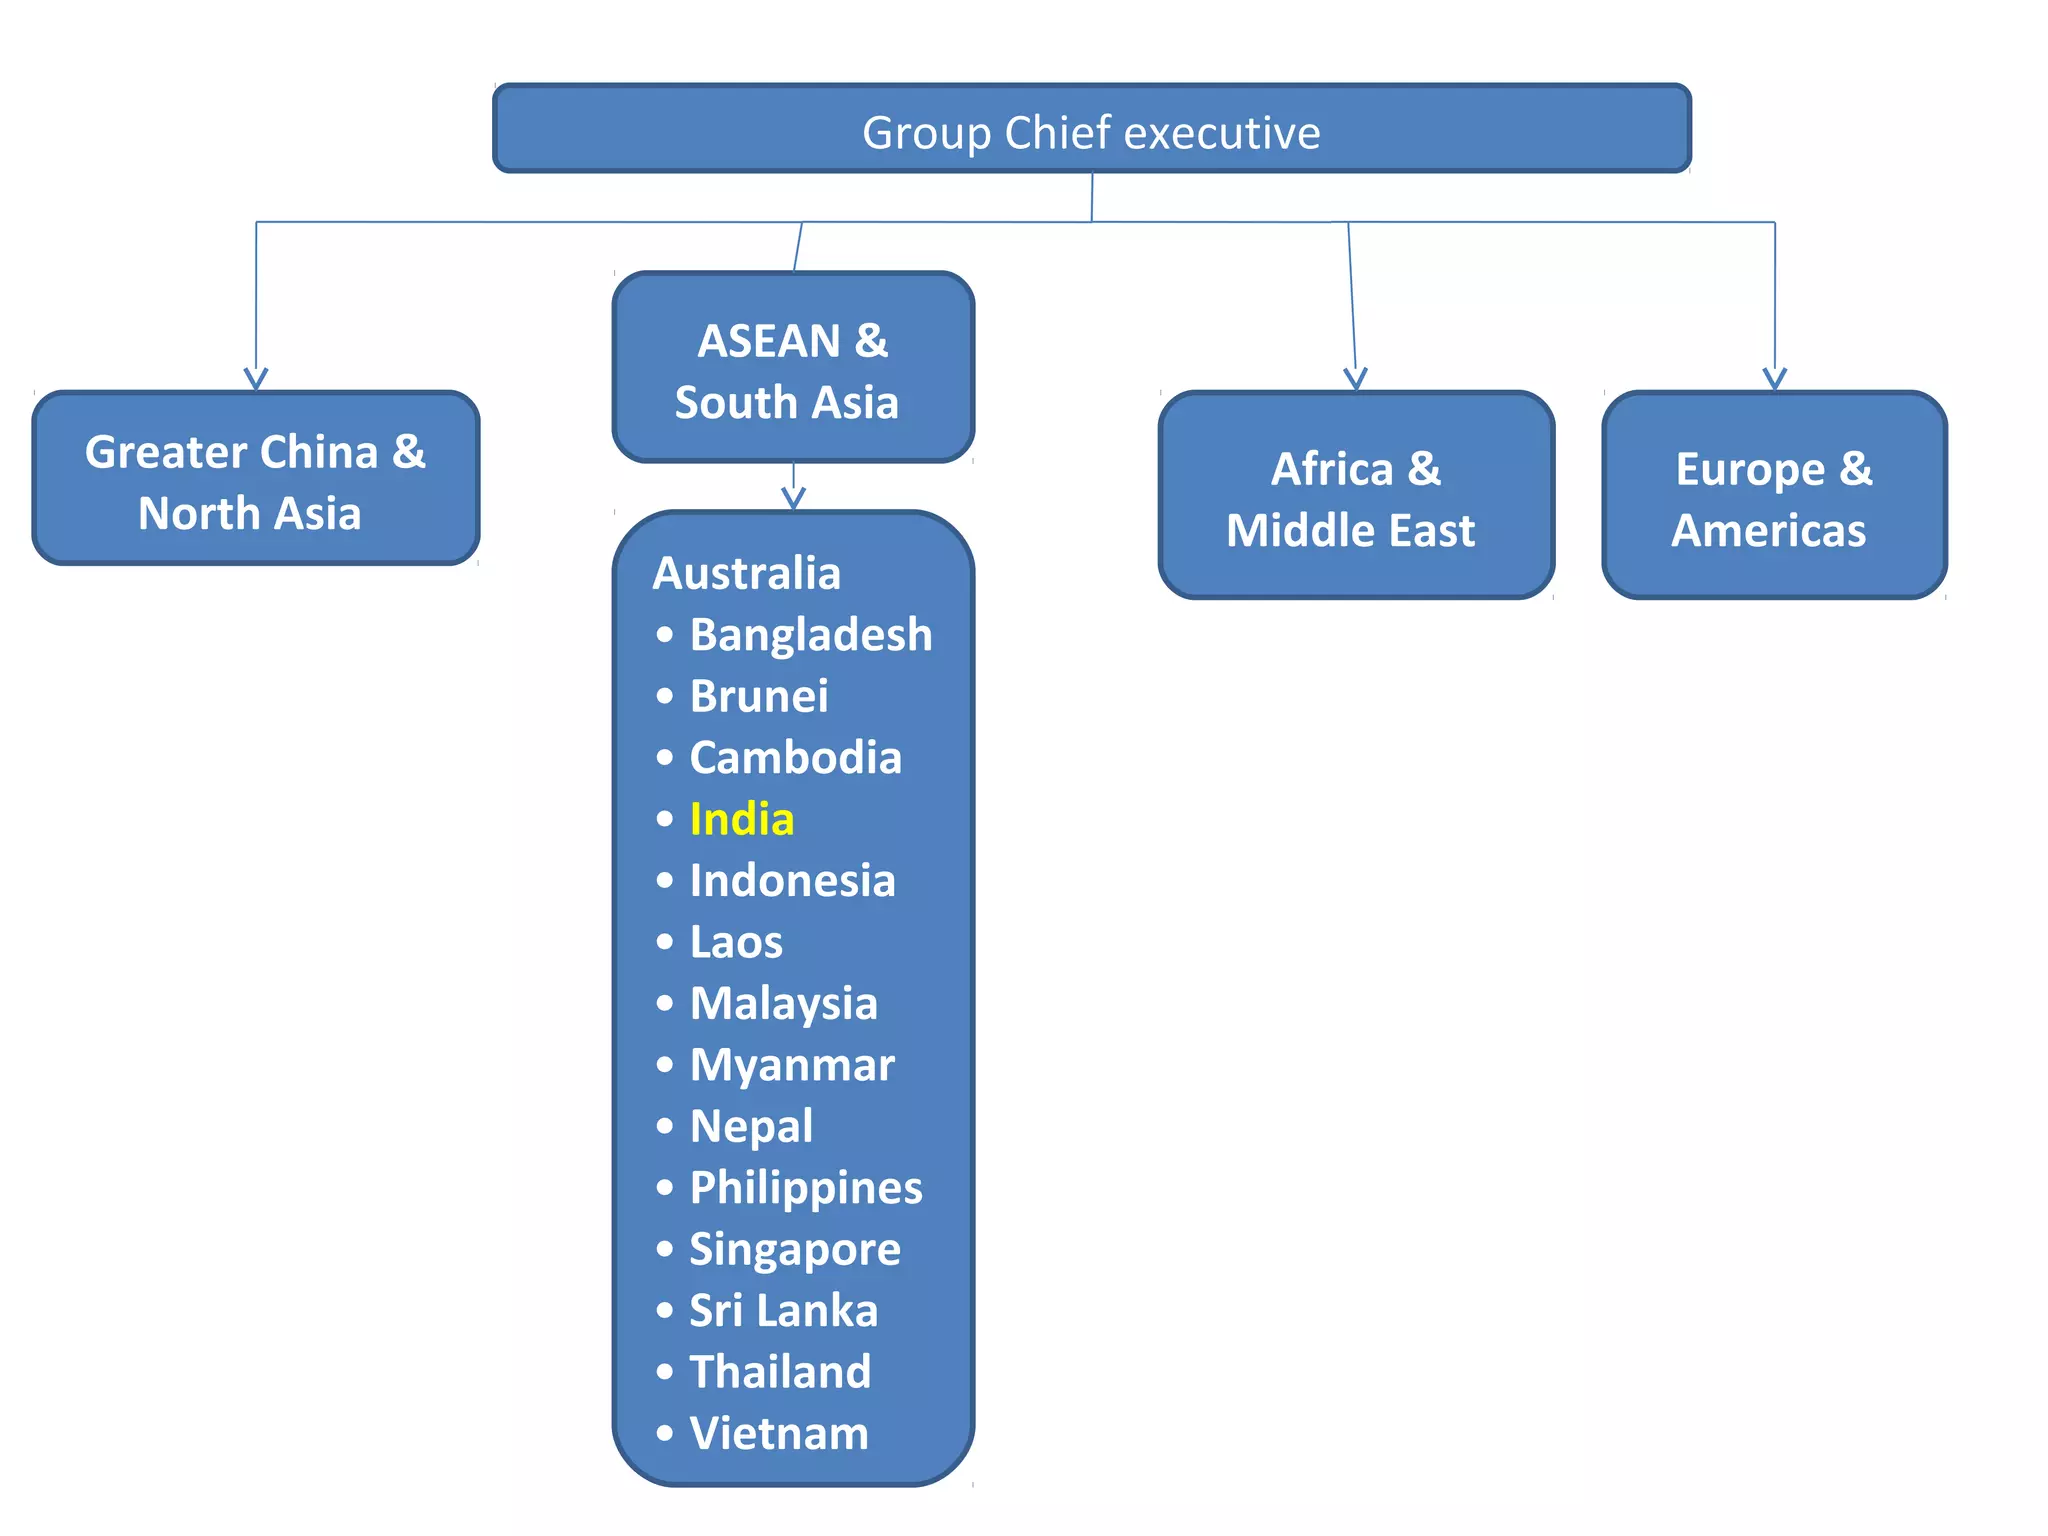
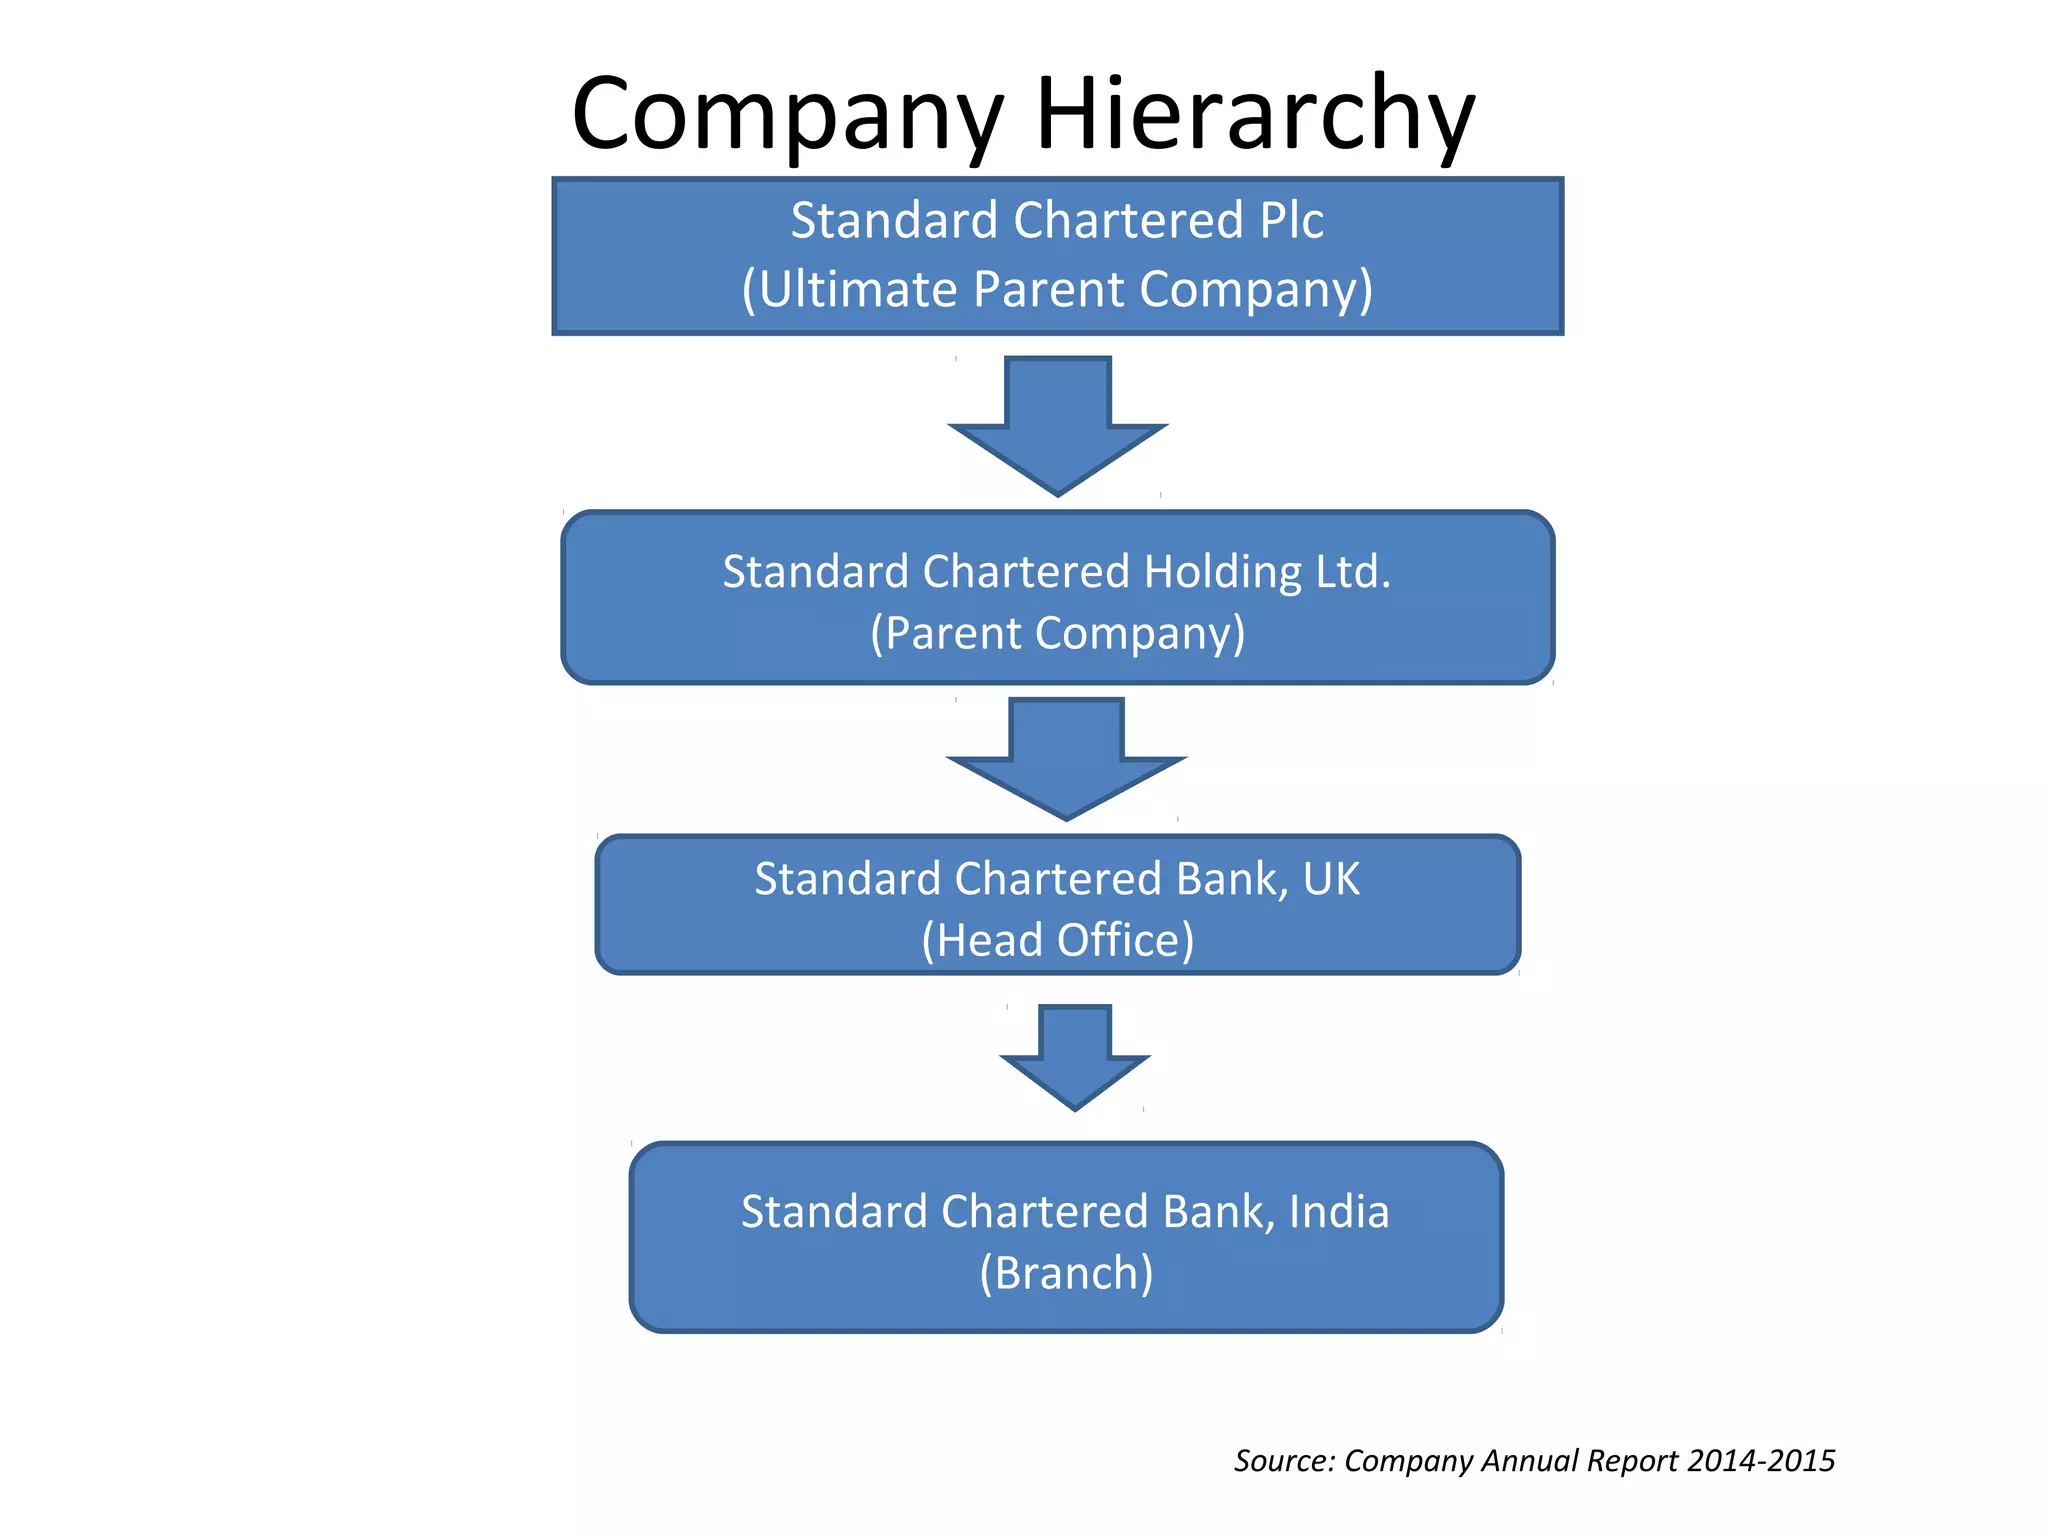
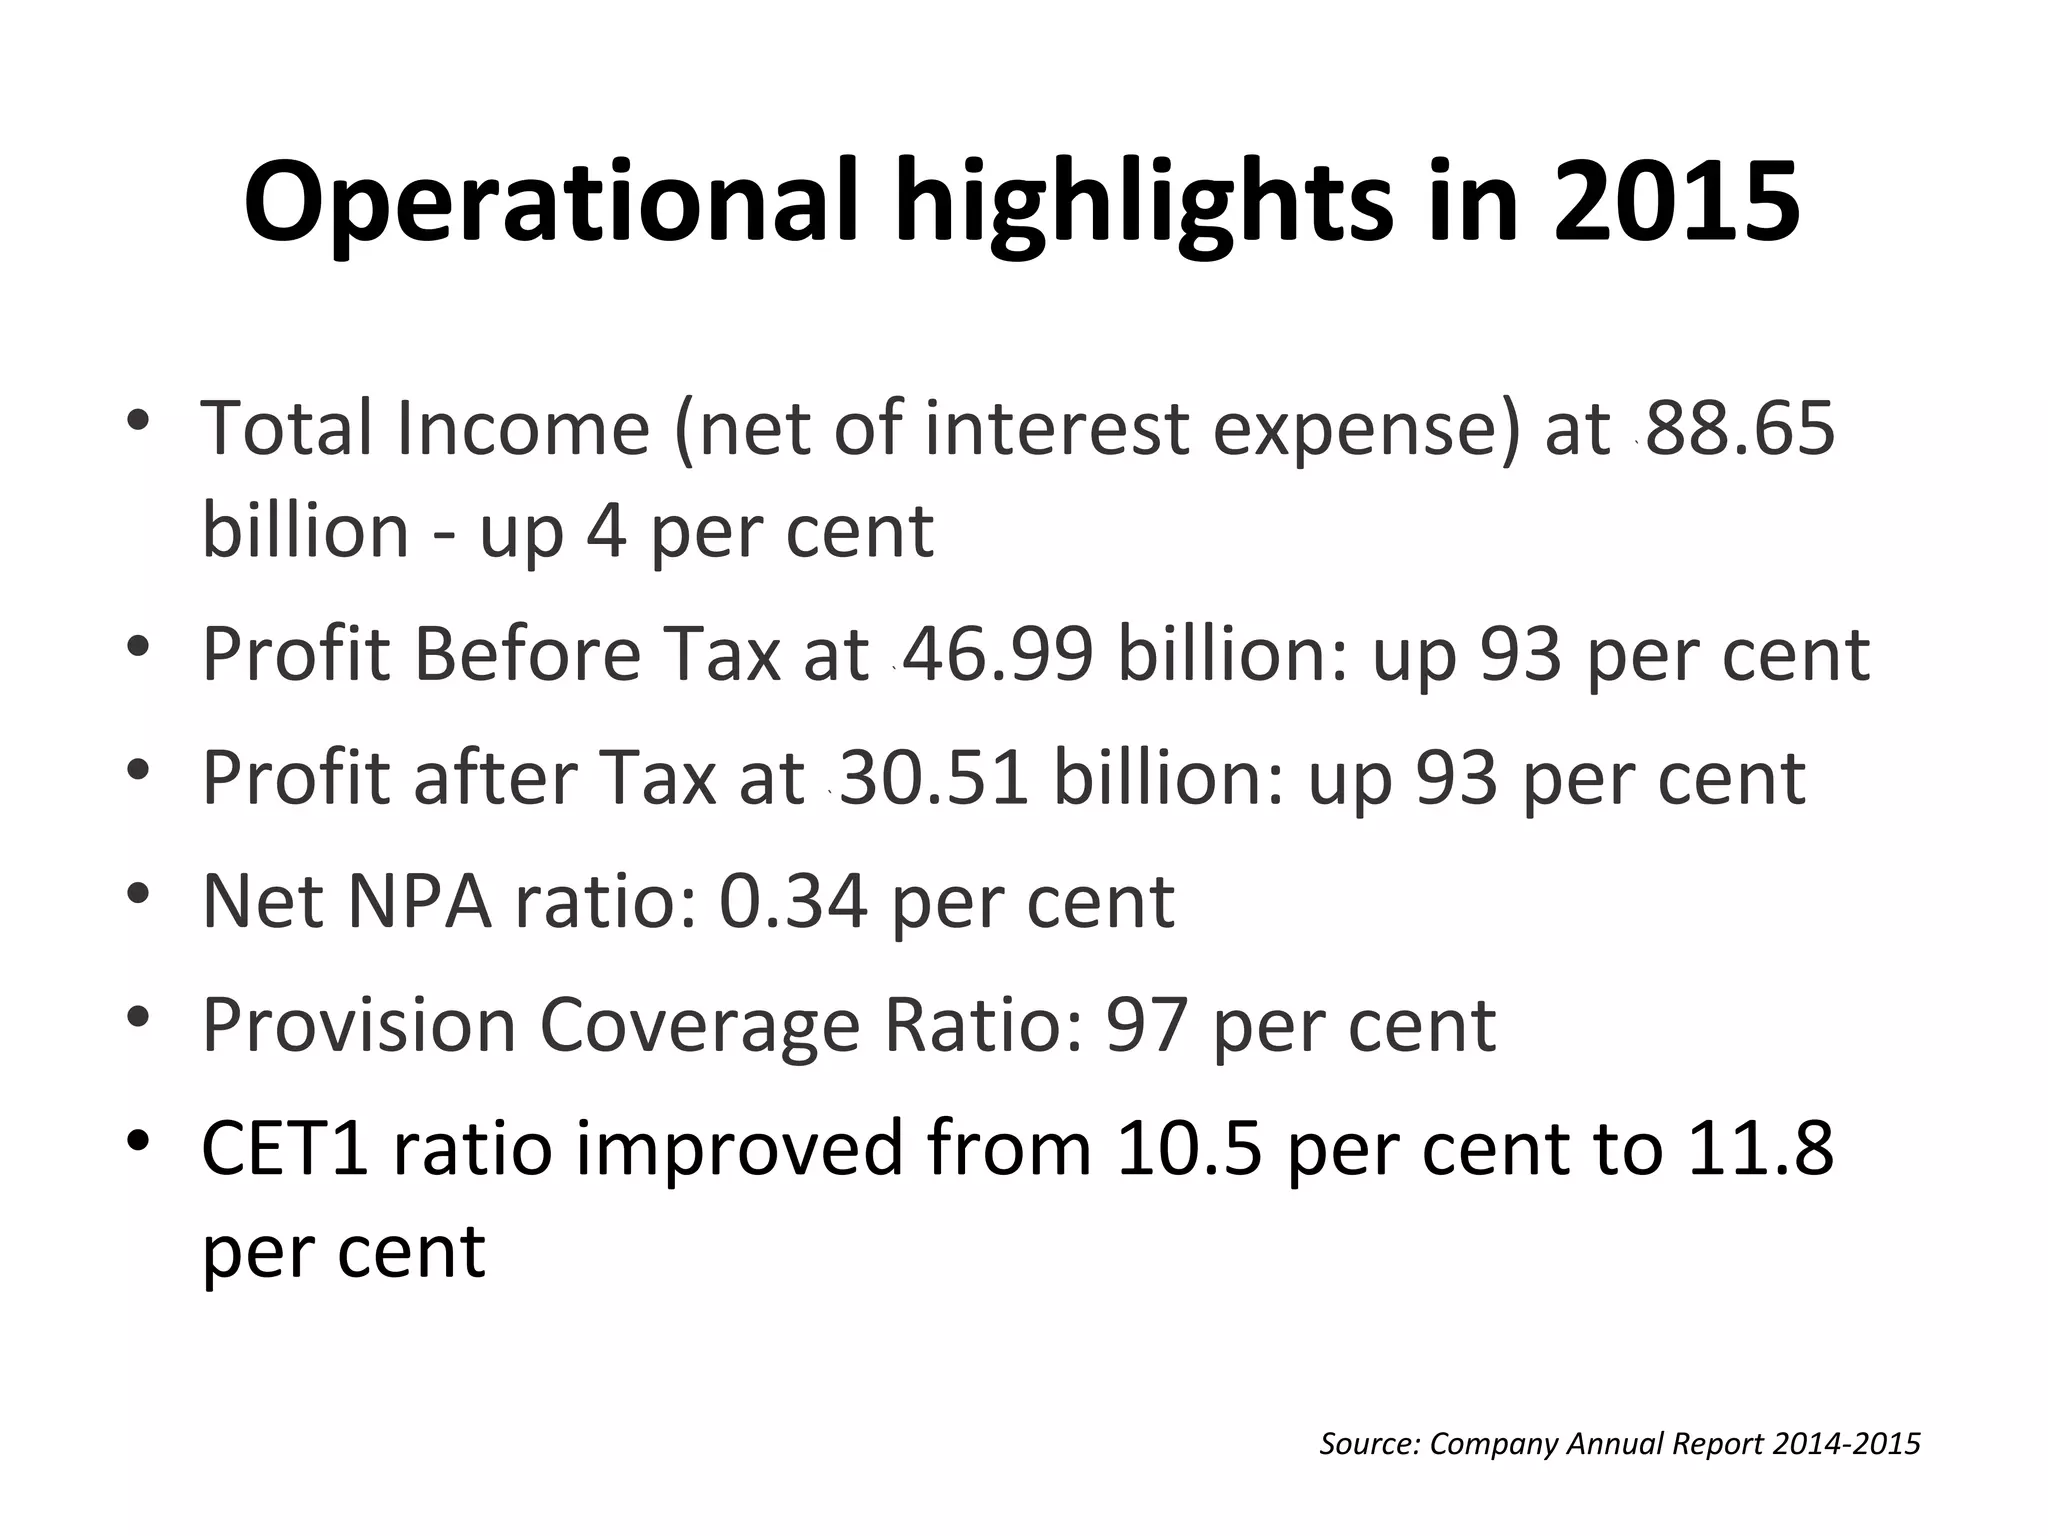
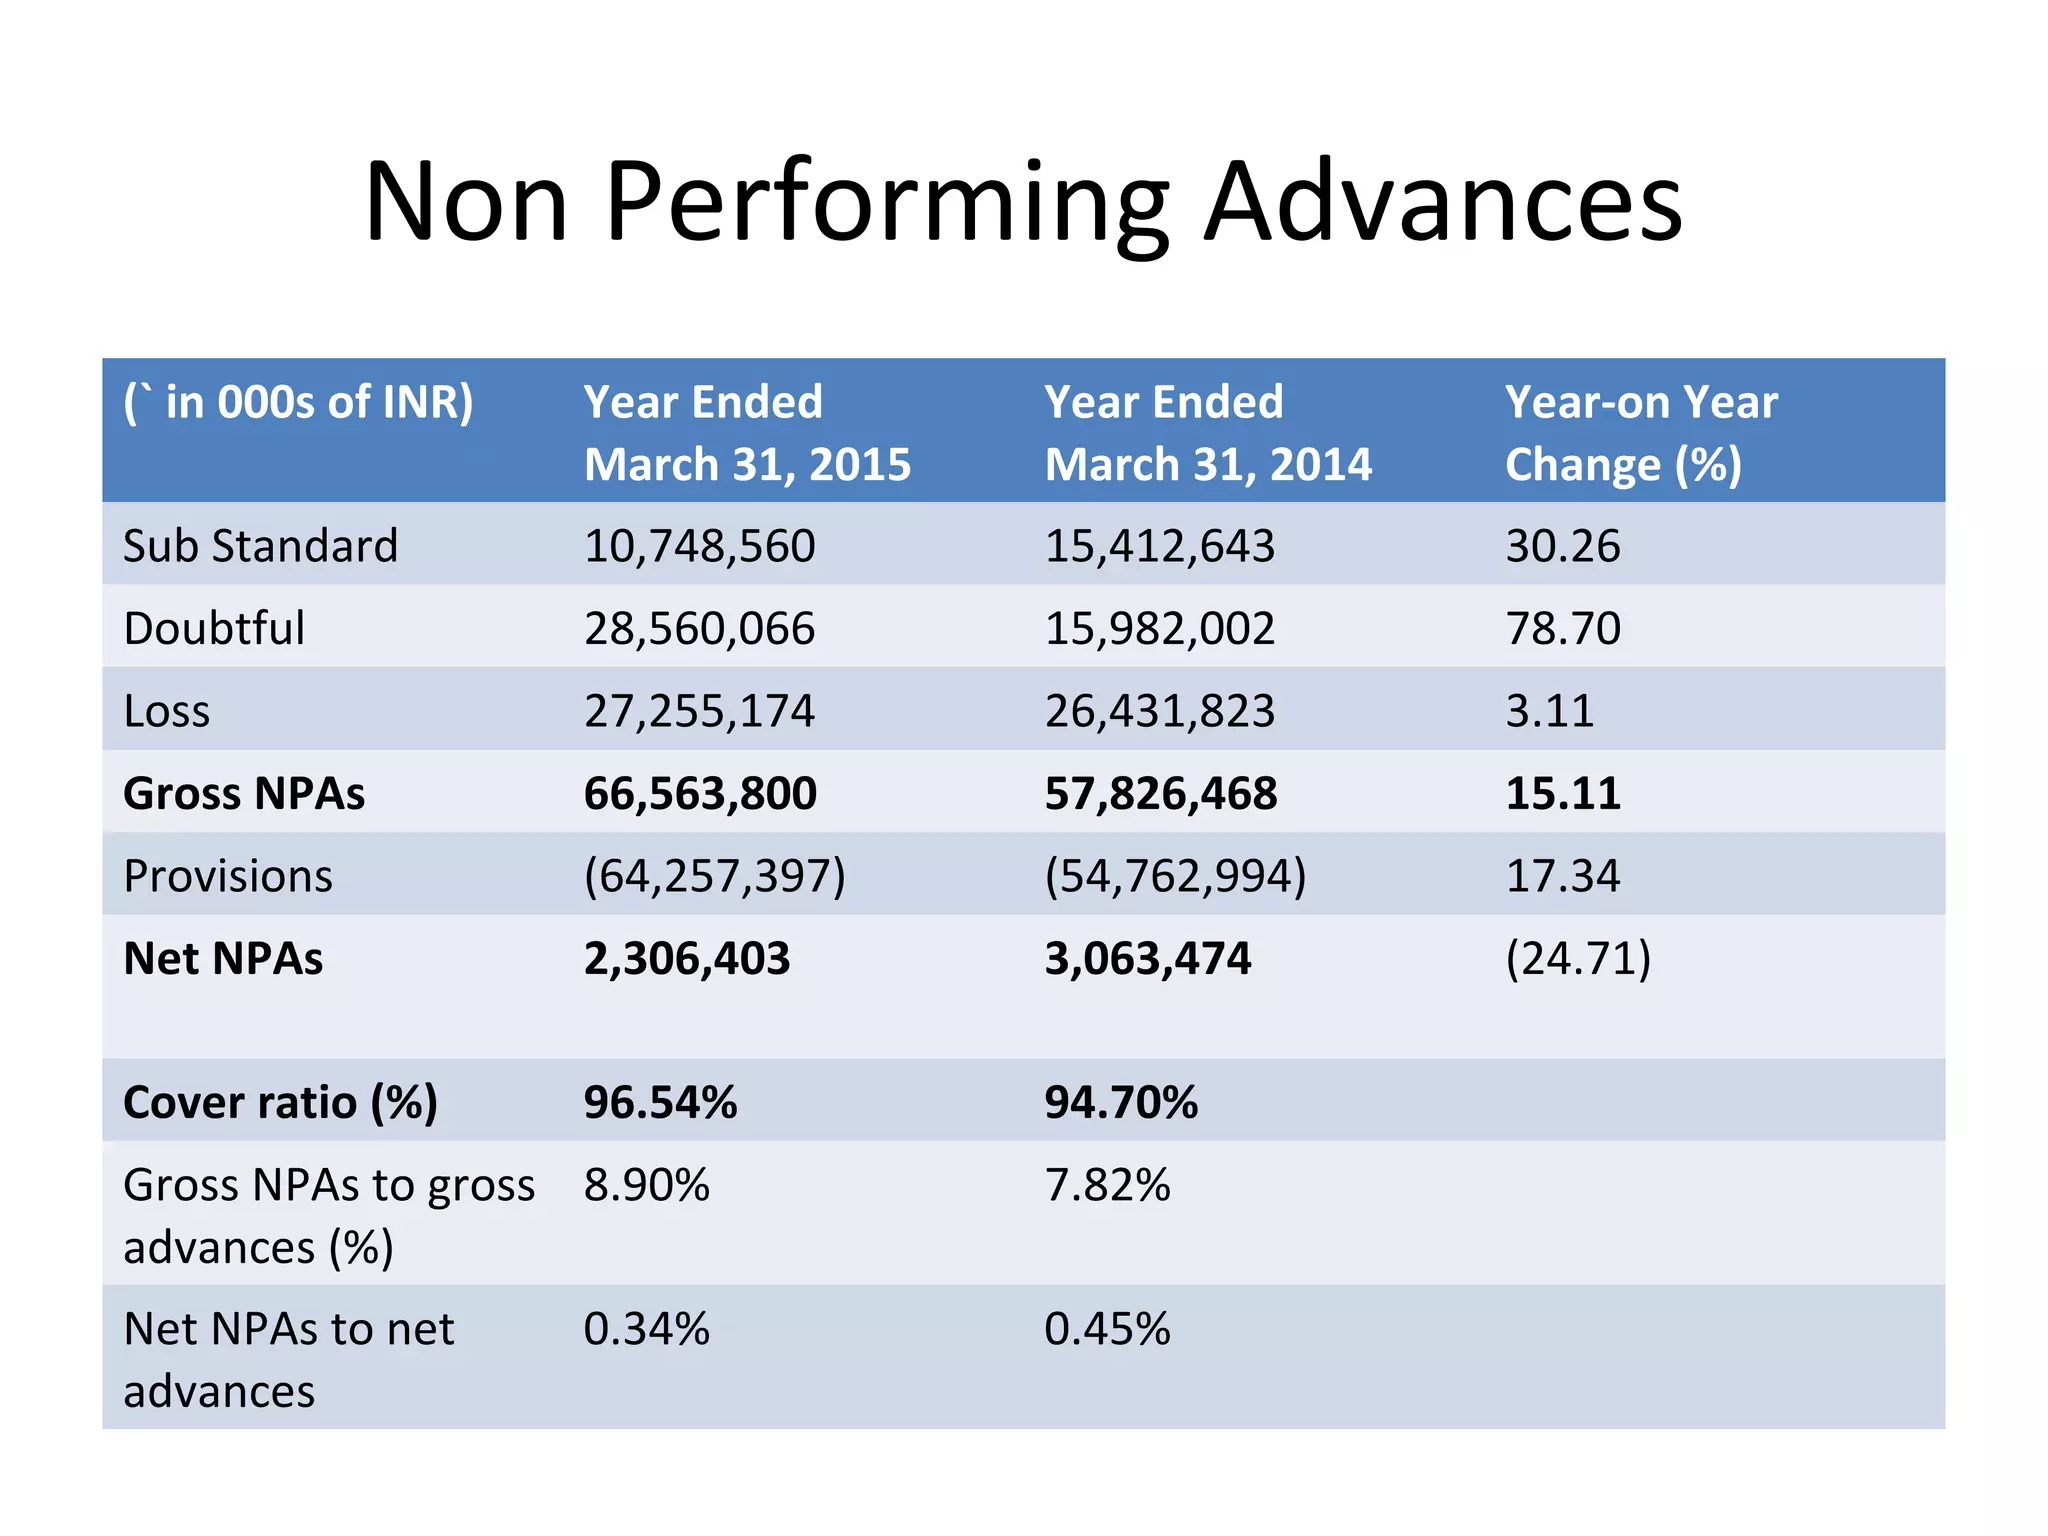
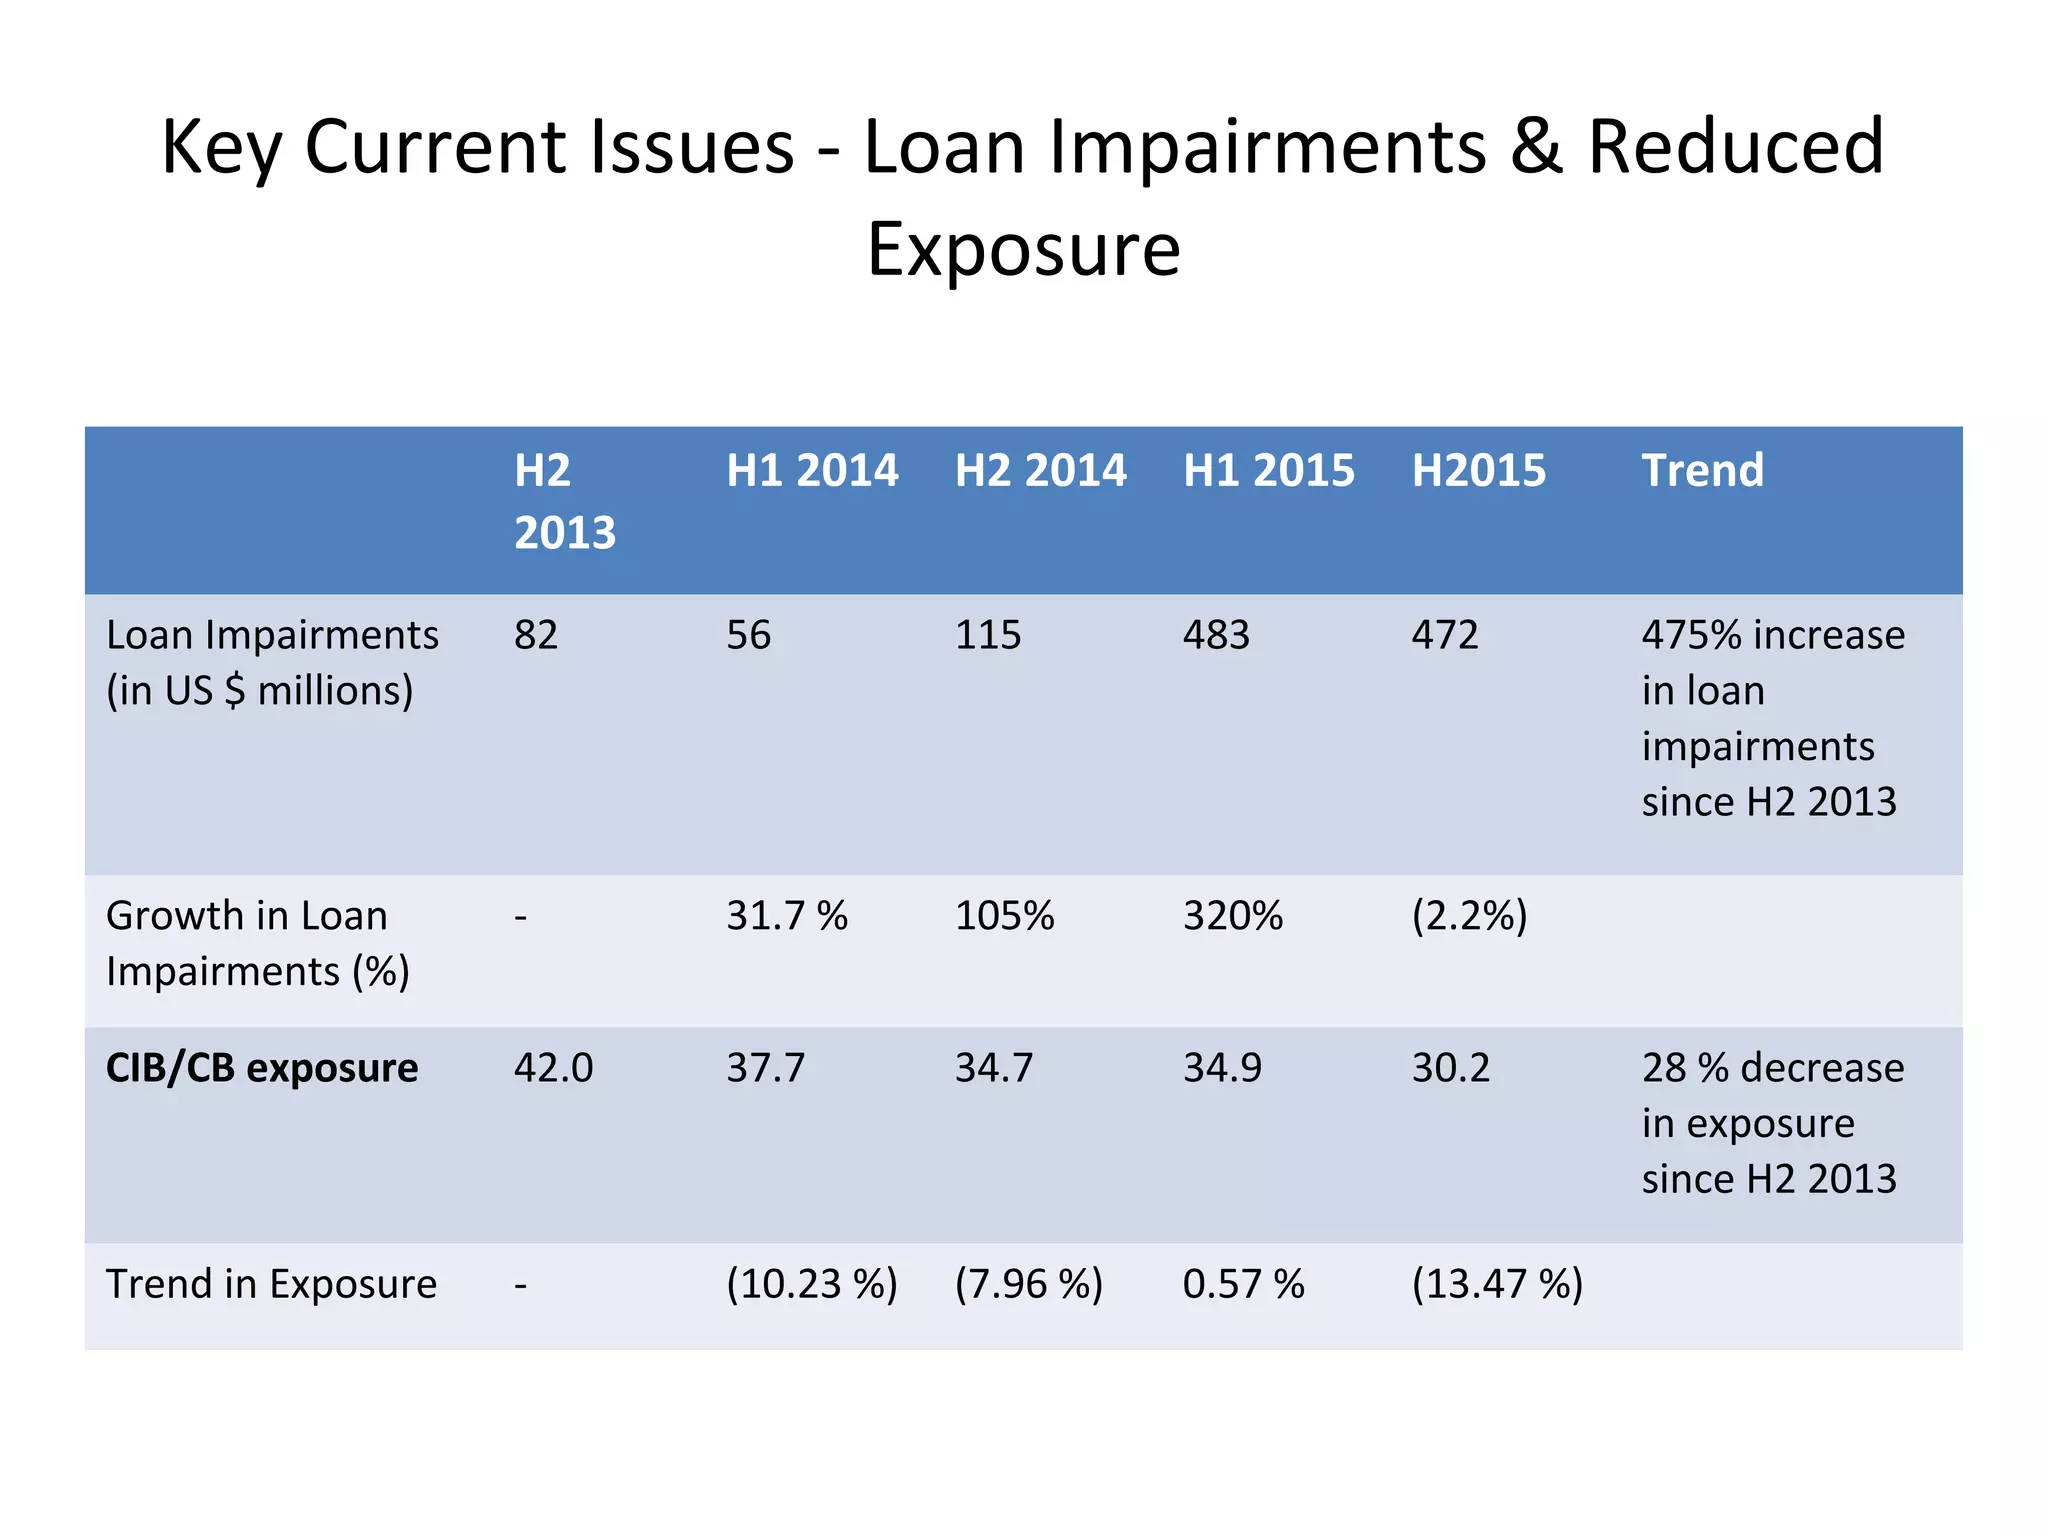
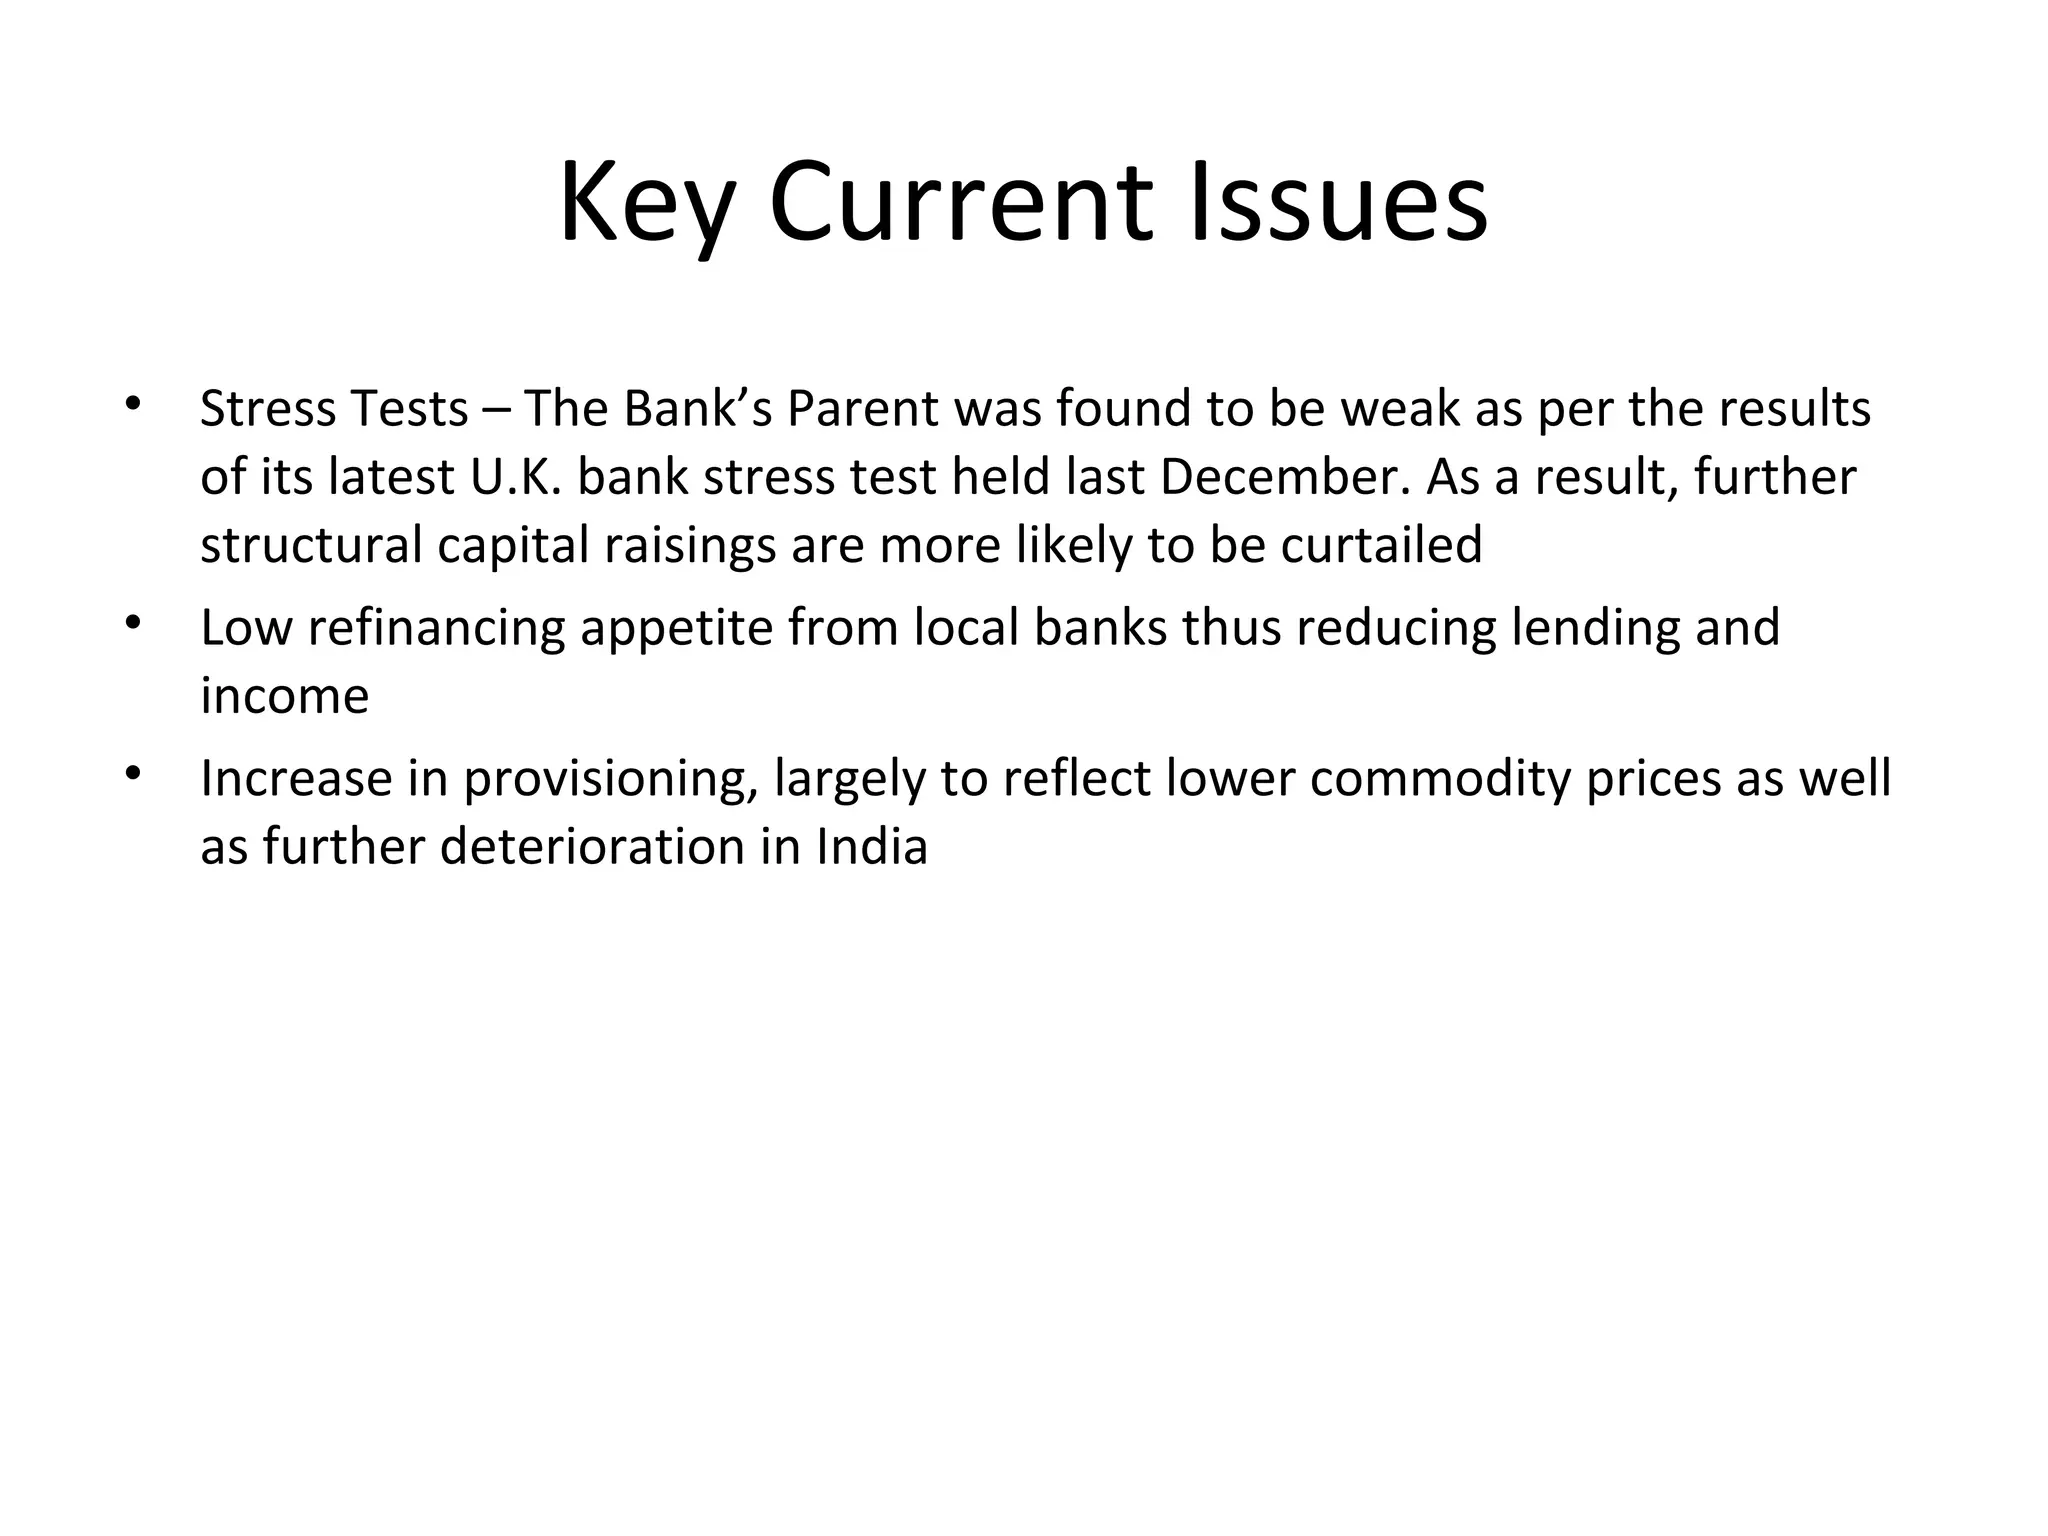
Company Profile
Standard Chartered Bank – India
Operations
Brief Overview – Standard Chartered Bank, India
• Started Operations in India on April 12, 1858
• Current headquarters - Mumbai
• SCB India (SCBI or the Bank) is a privately held branch of Standard Chartered Bank
UK, which is part of the Standard Chartered PLC, a London based Banking Group
• India's largest international bank with a strong footprint –
 100 branches and 279 ATMs across 43 cities
 Combined Customer Base – 2 million retail customers and more than 2,500
corporate and institutional relationships
 Number of Employees - 18,000
• As of latest reported financial year-end (March 31, 2015), the Bank managed a
growth in its total income by 4% y-o-y and profit before tax rose up by 93% y-o-y
Source: Company Websites – Standard Chartered PLC, Standard Chartered Bank – India Branch,
Annual Report 2014-2015
Board and Management
Zarin Daruwala,
Chief Executive Officer,
Standard Chartered Bank, India
Anurag Adlakha,
Chief Financial Officer/Acting CEO,
India
Ajay Kanwal,
Chief Executive Officer,
ASEAN & South Asia Region,
Standard Chartered Bank, UK
Source: Company Website - Standard Chartered Bank – India Branch,
Organization Structure
• Effective July 15, 2015, the Group reorganised its corporate structure with
a view to cut costs and improve efficiency
• Four regional businesses three client businesses, which will report to
Group CEO Bill Winters.
• The Asia-focused lender aims –
 Simplification of its geographic and client segment structure to reduce
costs and bureaucracy and speed up decision making
 To deliver the previously announced US$1.8bn (£1.2bn, €1.7bn) of cost
savings by the end of 2017."
Group Chief executive
Greater China &
North Asia
ASEAN &
South Asia
Africa &
Middle East
Europe &
Americas
Australia
• Bangladesh
• Brunei
• Cambodia
• India
• Indonesia
• Laos
• Malaysia
• Myanmar
• Nepal
• Philippines
• Singapore
• Sri Lanka
• Thailand
• Vietnam
Company Hierarchy
Standard Chartered Plc
(Ultimate Parent Company)
Standard Chartered Holding Ltd.
(Parent Company)
Standard Chartered Bank, UK
(Head Office)
Standard Chartered Bank, India
(Branch)
Source: Company Annual Report 2014-2015
Subsidiaries
Standard Chartered Bank,
India
Standard Chartered
Securities (India) Ltd
Standard Chartered
Private Equity Advisory
(India) Private Limited
Standard Chartered
Investments and
Loans (India) Limited.
Source: Company Annual Report 2014-2015
Operations & Segments
Operational highlights in 2015
• Total Income (net of interest expense) at ` 88.65
billion - up 4 per cent
• Profit Before Tax at ` 46.99 billion: up 93 per cent
• Profit after Tax at ` 30.51 billion: up 93 per cent
• Net NPA ratio: 0.34 per cent
• Provision Coverage Ratio: 97 per cent
• CET1 ratio improved from 10.5 per cent to 11.8
per cent
Source: Company Annual Report 2014-2015
Group Financial Performance
(` in 000s)
(Figures in Rupees)
Year Ended
March 31, 2015
Year Ended
March 31, 2014
Year-on Year
Change (%)
Interest Earned 101,420,187 99,790,881 1.63
Other Income 32,819,620 31,454,003 4.34
Gross Revenue 134,239,807 131,244,884 2.28
Interest Expended 45,588,921 45,925,233 (0.73)
Operating Expenses 29,519,457 32,050,639 (7.8)
Operating Profit 46,993,948 24,339,215 93.08
Income Taxes (16,479,475) (8,498,085) 93.91
Net Profit 30,514,473 15,841,130 92.63
Total Assets 1,317,396,763 1,310,009,638 0.56
Total Liabilities 1,317,396,763 1,310,009,638 0.56
Depreciation 863,100 995,129 (13.27)
Net Interest Margin 55831266 53865648 18.39
Non Performing Advances
(` in 000s of INR) Year Ended
March 31, 2015
Year Ended
March 31, 2014
Year-on Year
Change (%)
Sub Standard 10,748,560 15,412,643 30.26
Doubtful 28,560,066 15,982,002 78.70
Loss 27,255,174 26,431,823 3.11
Gross NPAs 66,563,800 57,826,468 15.11
Provisions (64,257,397) (54,762,994) 17.34
Net NPAs 2,306,403 3,063,474 (24.71)
Cover ratio (%) 96.54% 94.70%
Gross NPAs to gross
advances (%)
8.90% 7.82%
Net NPAs to net
advances
0.34% 0.45%
Risk weighted assets and
contingents
(` in 000s)
(Figures in Rupees)
Year Ended
March 31, 2015
Year Ended
March 31, 2014
Year-on Year
Change (%)
Credit risk 1,465,920,821 1,249,157,572 17.35
Market risk (including
counterparty/settlem
ent risks)
110,610,068 92,558,872 19.50
Operational risk -
Basic indicator
approach
133,350,593 121,726,154 9.55
Total Risk weighted
assets and
contingents
1,709,881,482 1,463,442,598 16.84
Capital ratios
Ratios (in %) Year Ended
March 31, 2015
Year Ended
March 31, 2014
Common Equity Tier 1
capital
12.6 10.52
Tier 1 capital 14.1 11.4
Tier 2 capital 5.4 5.3
Total capital 19.5 16.7
Key Client Segments
• Corporate & Institutional Clients –
 Leverage our geographic spread to capture cross-border flows into and out of
the country
 Enhance client cross-sell by expanding the products offered
 Focus on flow business & Balance sheet management
• Commercial & Private Banking Clients
 6,000 client relationships in Commercial Banking
 Largest foreign bank in India in this space
 Facilitate projects and assist in Social-funding (Brij Healthcare and Research
centre and Kolkata Comprehensive Eye Care Project)
• Retail Clients
Since April 1, 2014, The Group’s two businesses, Wholesale Banking and
Consumer Banking, have integrated to form one business, organized into the
following three customer segment groups and serviced by five global product
groups -
Product Offerings
• Retail
 Deposits
 Savings
 Mortgages
 Credit cards
and personal
loans
 Other retail
banking
products
• Wealth Management
 Managed investments
 Insurance
 Currency
 Securities
• Transaction Banking
Cash management (Payments
& Collections)
Trade Solutions & Money
Transfers
Securities holdings products
Trade finance products
• Corporate Finance
 Financing
 Strategic Advice
 Mergers and Acquisitions
 Equity and principal financing
• Financial Markets
 Investment services
 Risk management
 Debt capital services
End Markets Served by
Product
Transaction Banking -
Insurance, Pharma,
Electronics, Aerospace,
Corporate Finance -
Beverages, Utilities,
Food Processing
Commercial Clients –
Chemicals, Auto
Components, Commercial
Real Estate, Infrastructure,
Pharma, Construction & Engg
and Electricals
Private Banking –
Provides tailored services
around 1400 families and
4200 clients across
Mumbai, Delhi, Bangalore,
Kolkata and Chennai
Recent Corporate & Institutional
Client (CIC) Coverage
Segmental Performance
As per the latest financial year-end annual figures, the
financial data have been reported into the following 4
segments –
•Treasury Services
•Wholesale Banking
•Retail Banking
•Others
Treasury Services
Treasury activities include foreign exchange, fixed income, money market and
derivative transactions
(` in 000s of INR) Year Ended
March 31, 2015
Year Ended
March 31, 2014
Year-on Year
Change (%)
Gross Segment
Revenue 42,521,009 36,664,273
15.97
Net Segment
Revenue 39,357,477 35,350,156
11.34
Net Segment
Results 35,577,962
29,814,689 19.33
Segment Assets 570,971,472 586,368,083 (2.62)
Segment Liabilities 372,368,699 380,498,971 (2.14)
Wholesale Banking
• Includes Local corporate financing
• Corporate Advisory
• All advances to trusts, partnership firms companies and statutory bodies, which
are not included under the “Retail Banking” segment
(` in 000s) Year Ended
March 31, 2015
Year Ended
March 31, 2014
Gross Segment Revenue
Net Segment Revenue
Net Segment Results
Segment Assets
Segment Liabilities
(` in 000s of INR) Year Ended
March 31, 2015
Year Ended
March 31, 2014
Year-on Year
Change (%)
Gross Segment
Revenue
66,706,255 64,676,706 3.14
Net Segment
Revenue
32,418,033 27,173,002 19.30
Net Segment
Results 8,616,462
(9,346,645) 192.19
Segment Assets 528,104,651 497,735,423 6.10
Segment Liabilities 479,561,186 446,004,532 7.52
Retail Banking
• Serving retail customers through the branch network and other delivery channels.
• Raising deposits from customers and makes loans and provides other services to
such customers
• Activities relating to credit cards, debit cards, mortgage loans, third party product
distribution and their associated costs
(` in 000s of INR) Year Ended
March 31, 2015
Year Ended
March 31, 2014
Year-on Year
Change (%)
Gross Segment
Revenue
24,968,123 28,071,683 (11.06)
Net Segment
Revenue
18,158,319 21,679,614 (16.24)
Net Segment
Results 3,274,332
4,612,147 (29.01)
Segment Assets 166,454,474 178,528,912 (6.76)
Segment Liabilities 458,635,988 476,781,527 (3.80)
Other Operations
(` in 000s of INR) Year Ended
March 31, 2015
Year Ended
March 31, 2014
Year-on Year
Change (%)
Gross Segment
Revenue
44,420 1,832,222 (97.58)
Net Segment
Revenue
(1,282,943) 1,116,879 (214.86)
Net Segment
Results (474,808)
740,976 (164.08)
Income Taxes (16,479,475) (8,498,085) 93.92
Segment Assets 51,866,166 47,377,220 9.47
Segment Liabilities 6,830,890 6,724,608 (3.80)
Capex to
acquire Fixed
Assets
676,256 686,810 (1.54)
Depreciation 863,100 995,129 (13.26)
Others include Corporate Real Estate Services and other items not allocable in
the aforementioned segments
Key Current Issues
• Large Credit Risk – $5 billion of domestic lending classified as
at risk of defaulting
• Lower Income in the Retail Banking owing to reduction in
interest rates by Reserve Bank of India (RBI)
• Rising loan impairments - (a 475 % increase since H2 2013) as
shown below (excluding restructuring charge)
• Reduced Portfolio Exposure in Corporate & Institutional and
Commercial Banking (Total exposure US$30bn, down 13%
YoY)
Key Current Issues - Loan Impairments & Reduced
Exposure
H2
2013
H1 2014 H2 2014 H1 2015 H2015 Trend
Loan Impairments
(in US $ millions)
82 56 115 483 472 475% increase
in loan
impairments
since H2 2013
Growth in Loan
Impairments (%)
- 31.7 % 105% 320% (2.2%)
CIB/CB exposure 42.0 37.7 34.7 34.9 30.2 28 % decrease
in exposure
since H2 2013
Trend in Exposure - (10.23 %) (7.96 %) 0.57 % (13.47 %)
Key Current Issues
• Stress Tests – The Bank’s Parent was found to be weak as per the results
of its latest U.K. bank stress test held last December. As a result, further
structural capital raisings are more likely to be curtailed
• Low refinancing appetite from local banks thus reducing lending and
income
• Increase in provisioning, largely to reflect lower commodity prices as well
as further deterioration in India
Website Link Citations
• https://www.sc.com/in/about-us/en/about-us.html
• https://www.sc.com/en/about-us/standard-chartered-worldwide/asia/india.htm
• https://www.sc.com/uk/contact-us/
• https://www.sc.com/en/news-and-media/news/asia/2015-10-17-Zarin-
Daruwala-appointed-CEO-India.html
• http://www.ibtimes.co.uk/standard-chartered-rejigs-organisation-
structure-cut-down-regions-4-1511613
• http://www.livemint.com/Companies/RPIgMyNZ6WnLbrihkoOt7I/Standar
d-Chartered-names-Zarin-Daruwala-as-new-India-CEO.html
• https://www.sc.com/en/news-and-media/news/global/09-01-2014-
reorganisation-and-changes.html

Standard Chartered Bank, India Operations - Company Profile

  • 1.
    Company Profile Standard CharteredBank – India Operations
  • 2.
    Brief Overview –Standard Chartered Bank, India • Started Operations in India on April 12, 1858 • Current headquarters - Mumbai • SCB India (SCBI or the Bank) is a privately held branch of Standard Chartered Bank UK, which is part of the Standard Chartered PLC, a London based Banking Group • India's largest international bank with a strong footprint –  100 branches and 279 ATMs across 43 cities  Combined Customer Base – 2 million retail customers and more than 2,500 corporate and institutional relationships  Number of Employees - 18,000 • As of latest reported financial year-end (March 31, 2015), the Bank managed a growth in its total income by 4% y-o-y and profit before tax rose up by 93% y-o-y Source: Company Websites – Standard Chartered PLC, Standard Chartered Bank – India Branch, Annual Report 2014-2015
  • 3.
    Board and Management ZarinDaruwala, Chief Executive Officer, Standard Chartered Bank, India Anurag Adlakha, Chief Financial Officer/Acting CEO, India Ajay Kanwal, Chief Executive Officer, ASEAN & South Asia Region, Standard Chartered Bank, UK Source: Company Website - Standard Chartered Bank – India Branch,
  • 4.
    Organization Structure • EffectiveJuly 15, 2015, the Group reorganised its corporate structure with a view to cut costs and improve efficiency • Four regional businesses three client businesses, which will report to Group CEO Bill Winters. • The Asia-focused lender aims –  Simplification of its geographic and client segment structure to reduce costs and bureaucracy and speed up decision making  To deliver the previously announced US$1.8bn (£1.2bn, €1.7bn) of cost savings by the end of 2017."
  • 5.
    Group Chief executive GreaterChina & North Asia ASEAN & South Asia Africa & Middle East Europe & Americas Australia • Bangladesh • Brunei • Cambodia • India • Indonesia • Laos • Malaysia • Myanmar • Nepal • Philippines • Singapore • Sri Lanka • Thailand • Vietnam
  • 6.
    Company Hierarchy Standard CharteredPlc (Ultimate Parent Company) Standard Chartered Holding Ltd. (Parent Company) Standard Chartered Bank, UK (Head Office) Standard Chartered Bank, India (Branch) Source: Company Annual Report 2014-2015
  • 7.
    Subsidiaries Standard Chartered Bank, India StandardChartered Securities (India) Ltd Standard Chartered Private Equity Advisory (India) Private Limited Standard Chartered Investments and Loans (India) Limited. Source: Company Annual Report 2014-2015
  • 8.
  • 9.
    Operational highlights in2015 • Total Income (net of interest expense) at ` 88.65 billion - up 4 per cent • Profit Before Tax at ` 46.99 billion: up 93 per cent • Profit after Tax at ` 30.51 billion: up 93 per cent • Net NPA ratio: 0.34 per cent • Provision Coverage Ratio: 97 per cent • CET1 ratio improved from 10.5 per cent to 11.8 per cent Source: Company Annual Report 2014-2015
  • 10.
    Group Financial Performance (`in 000s) (Figures in Rupees) Year Ended March 31, 2015 Year Ended March 31, 2014 Year-on Year Change (%) Interest Earned 101,420,187 99,790,881 1.63 Other Income 32,819,620 31,454,003 4.34 Gross Revenue 134,239,807 131,244,884 2.28 Interest Expended 45,588,921 45,925,233 (0.73) Operating Expenses 29,519,457 32,050,639 (7.8) Operating Profit 46,993,948 24,339,215 93.08 Income Taxes (16,479,475) (8,498,085) 93.91 Net Profit 30,514,473 15,841,130 92.63 Total Assets 1,317,396,763 1,310,009,638 0.56 Total Liabilities 1,317,396,763 1,310,009,638 0.56 Depreciation 863,100 995,129 (13.27) Net Interest Margin 55831266 53865648 18.39
  • 11.
    Non Performing Advances (`in 000s of INR) Year Ended March 31, 2015 Year Ended March 31, 2014 Year-on Year Change (%) Sub Standard 10,748,560 15,412,643 30.26 Doubtful 28,560,066 15,982,002 78.70 Loss 27,255,174 26,431,823 3.11 Gross NPAs 66,563,800 57,826,468 15.11 Provisions (64,257,397) (54,762,994) 17.34 Net NPAs 2,306,403 3,063,474 (24.71) Cover ratio (%) 96.54% 94.70% Gross NPAs to gross advances (%) 8.90% 7.82% Net NPAs to net advances 0.34% 0.45%
  • 12.
    Risk weighted assetsand contingents (` in 000s) (Figures in Rupees) Year Ended March 31, 2015 Year Ended March 31, 2014 Year-on Year Change (%) Credit risk 1,465,920,821 1,249,157,572 17.35 Market risk (including counterparty/settlem ent risks) 110,610,068 92,558,872 19.50 Operational risk - Basic indicator approach 133,350,593 121,726,154 9.55 Total Risk weighted assets and contingents 1,709,881,482 1,463,442,598 16.84
  • 13.
    Capital ratios Ratios (in%) Year Ended March 31, 2015 Year Ended March 31, 2014 Common Equity Tier 1 capital 12.6 10.52 Tier 1 capital 14.1 11.4 Tier 2 capital 5.4 5.3 Total capital 19.5 16.7
  • 14.
    Key Client Segments •Corporate & Institutional Clients –  Leverage our geographic spread to capture cross-border flows into and out of the country  Enhance client cross-sell by expanding the products offered  Focus on flow business & Balance sheet management • Commercial & Private Banking Clients  6,000 client relationships in Commercial Banking  Largest foreign bank in India in this space  Facilitate projects and assist in Social-funding (Brij Healthcare and Research centre and Kolkata Comprehensive Eye Care Project) • Retail Clients Since April 1, 2014, The Group’s two businesses, Wholesale Banking and Consumer Banking, have integrated to form one business, organized into the following three customer segment groups and serviced by five global product groups -
  • 15.
    Product Offerings • Retail Deposits  Savings  Mortgages  Credit cards and personal loans  Other retail banking products • Wealth Management  Managed investments  Insurance  Currency  Securities • Transaction Banking Cash management (Payments & Collections) Trade Solutions & Money Transfers Securities holdings products Trade finance products • Corporate Finance  Financing  Strategic Advice  Mergers and Acquisitions  Equity and principal financing • Financial Markets  Investment services  Risk management  Debt capital services
  • 16.
    End Markets Servedby Product Transaction Banking - Insurance, Pharma, Electronics, Aerospace, Corporate Finance - Beverages, Utilities, Food Processing Commercial Clients – Chemicals, Auto Components, Commercial Real Estate, Infrastructure, Pharma, Construction & Engg and Electricals Private Banking – Provides tailored services around 1400 families and 4200 clients across Mumbai, Delhi, Bangalore, Kolkata and Chennai
  • 17.
    Recent Corporate &Institutional Client (CIC) Coverage
  • 18.
    Segmental Performance As perthe latest financial year-end annual figures, the financial data have been reported into the following 4 segments – •Treasury Services •Wholesale Banking •Retail Banking •Others
  • 19.
    Treasury Services Treasury activitiesinclude foreign exchange, fixed income, money market and derivative transactions (` in 000s of INR) Year Ended March 31, 2015 Year Ended March 31, 2014 Year-on Year Change (%) Gross Segment Revenue 42,521,009 36,664,273 15.97 Net Segment Revenue 39,357,477 35,350,156 11.34 Net Segment Results 35,577,962 29,814,689 19.33 Segment Assets 570,971,472 586,368,083 (2.62) Segment Liabilities 372,368,699 380,498,971 (2.14)
  • 20.
    Wholesale Banking • IncludesLocal corporate financing • Corporate Advisory • All advances to trusts, partnership firms companies and statutory bodies, which are not included under the “Retail Banking” segment (` in 000s) Year Ended March 31, 2015 Year Ended March 31, 2014 Gross Segment Revenue Net Segment Revenue Net Segment Results Segment Assets Segment Liabilities (` in 000s of INR) Year Ended March 31, 2015 Year Ended March 31, 2014 Year-on Year Change (%) Gross Segment Revenue 66,706,255 64,676,706 3.14 Net Segment Revenue 32,418,033 27,173,002 19.30 Net Segment Results 8,616,462 (9,346,645) 192.19 Segment Assets 528,104,651 497,735,423 6.10 Segment Liabilities 479,561,186 446,004,532 7.52
  • 21.
    Retail Banking • Servingretail customers through the branch network and other delivery channels. • Raising deposits from customers and makes loans and provides other services to such customers • Activities relating to credit cards, debit cards, mortgage loans, third party product distribution and their associated costs (` in 000s of INR) Year Ended March 31, 2015 Year Ended March 31, 2014 Year-on Year Change (%) Gross Segment Revenue 24,968,123 28,071,683 (11.06) Net Segment Revenue 18,158,319 21,679,614 (16.24) Net Segment Results 3,274,332 4,612,147 (29.01) Segment Assets 166,454,474 178,528,912 (6.76) Segment Liabilities 458,635,988 476,781,527 (3.80)
  • 22.
    Other Operations (` in000s of INR) Year Ended March 31, 2015 Year Ended March 31, 2014 Year-on Year Change (%) Gross Segment Revenue 44,420 1,832,222 (97.58) Net Segment Revenue (1,282,943) 1,116,879 (214.86) Net Segment Results (474,808) 740,976 (164.08) Income Taxes (16,479,475) (8,498,085) 93.92 Segment Assets 51,866,166 47,377,220 9.47 Segment Liabilities 6,830,890 6,724,608 (3.80) Capex to acquire Fixed Assets 676,256 686,810 (1.54) Depreciation 863,100 995,129 (13.26) Others include Corporate Real Estate Services and other items not allocable in the aforementioned segments
  • 23.
    Key Current Issues •Large Credit Risk – $5 billion of domestic lending classified as at risk of defaulting • Lower Income in the Retail Banking owing to reduction in interest rates by Reserve Bank of India (RBI) • Rising loan impairments - (a 475 % increase since H2 2013) as shown below (excluding restructuring charge) • Reduced Portfolio Exposure in Corporate & Institutional and Commercial Banking (Total exposure US$30bn, down 13% YoY)
  • 24.
    Key Current Issues- Loan Impairments & Reduced Exposure H2 2013 H1 2014 H2 2014 H1 2015 H2015 Trend Loan Impairments (in US $ millions) 82 56 115 483 472 475% increase in loan impairments since H2 2013 Growth in Loan Impairments (%) - 31.7 % 105% 320% (2.2%) CIB/CB exposure 42.0 37.7 34.7 34.9 30.2 28 % decrease in exposure since H2 2013 Trend in Exposure - (10.23 %) (7.96 %) 0.57 % (13.47 %)
  • 25.
    Key Current Issues •Stress Tests – The Bank’s Parent was found to be weak as per the results of its latest U.K. bank stress test held last December. As a result, further structural capital raisings are more likely to be curtailed • Low refinancing appetite from local banks thus reducing lending and income • Increase in provisioning, largely to reflect lower commodity prices as well as further deterioration in India
  • 26.
    Website Link Citations •https://www.sc.com/in/about-us/en/about-us.html • https://www.sc.com/en/about-us/standard-chartered-worldwide/asia/india.htm • https://www.sc.com/uk/contact-us/ • https://www.sc.com/en/news-and-media/news/asia/2015-10-17-Zarin- Daruwala-appointed-CEO-India.html • http://www.ibtimes.co.uk/standard-chartered-rejigs-organisation- structure-cut-down-regions-4-1511613 • http://www.livemint.com/Companies/RPIgMyNZ6WnLbrihkoOt7I/Standar d-Chartered-names-Zarin-Daruwala-as-new-India-CEO.html • https://www.sc.com/en/news-and-media/news/global/09-01-2014- reorganisation-and-changes.html