This corporate presentation discusses the financial performance and strategy of IndusInd Bank. Some key points:
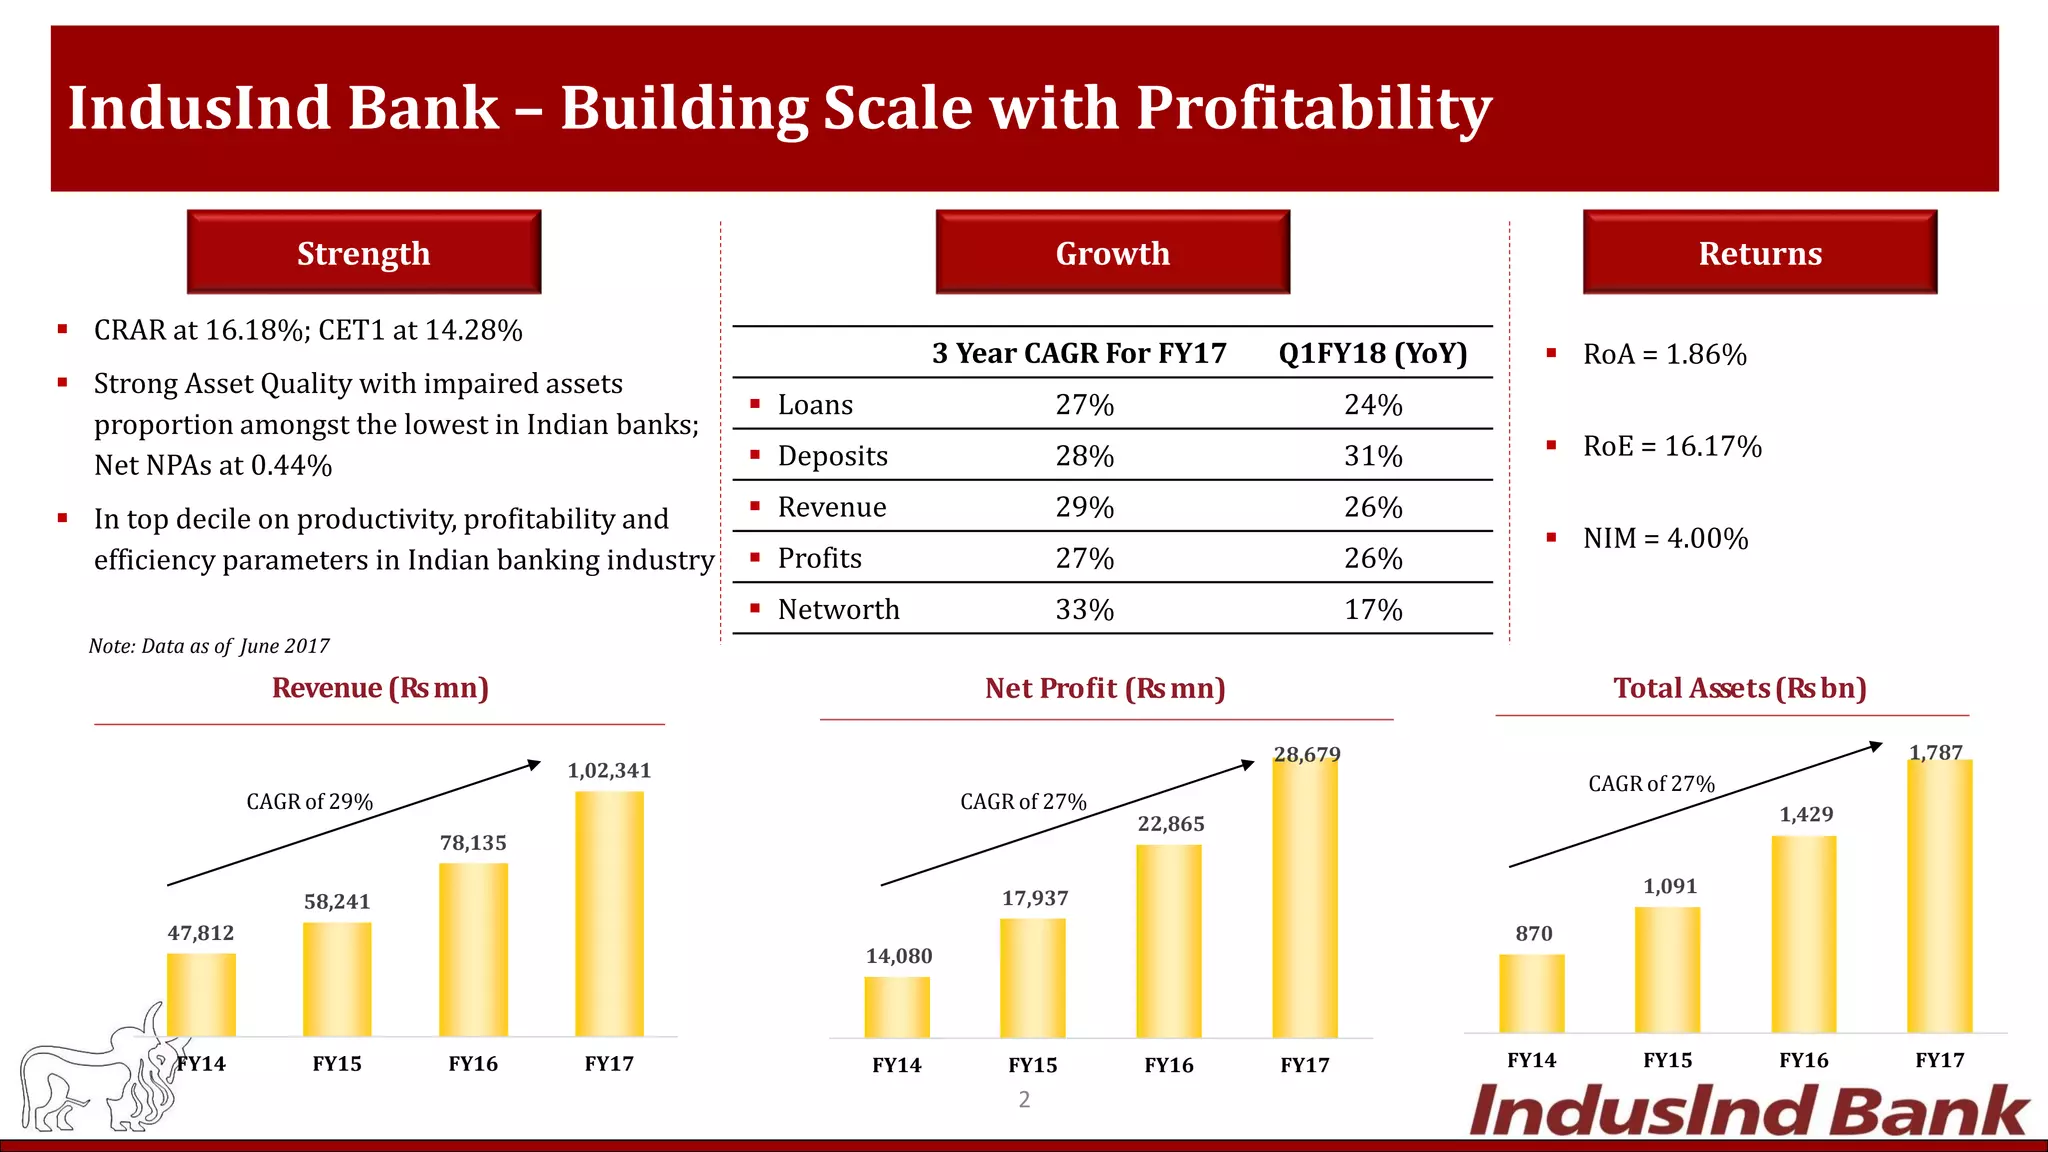
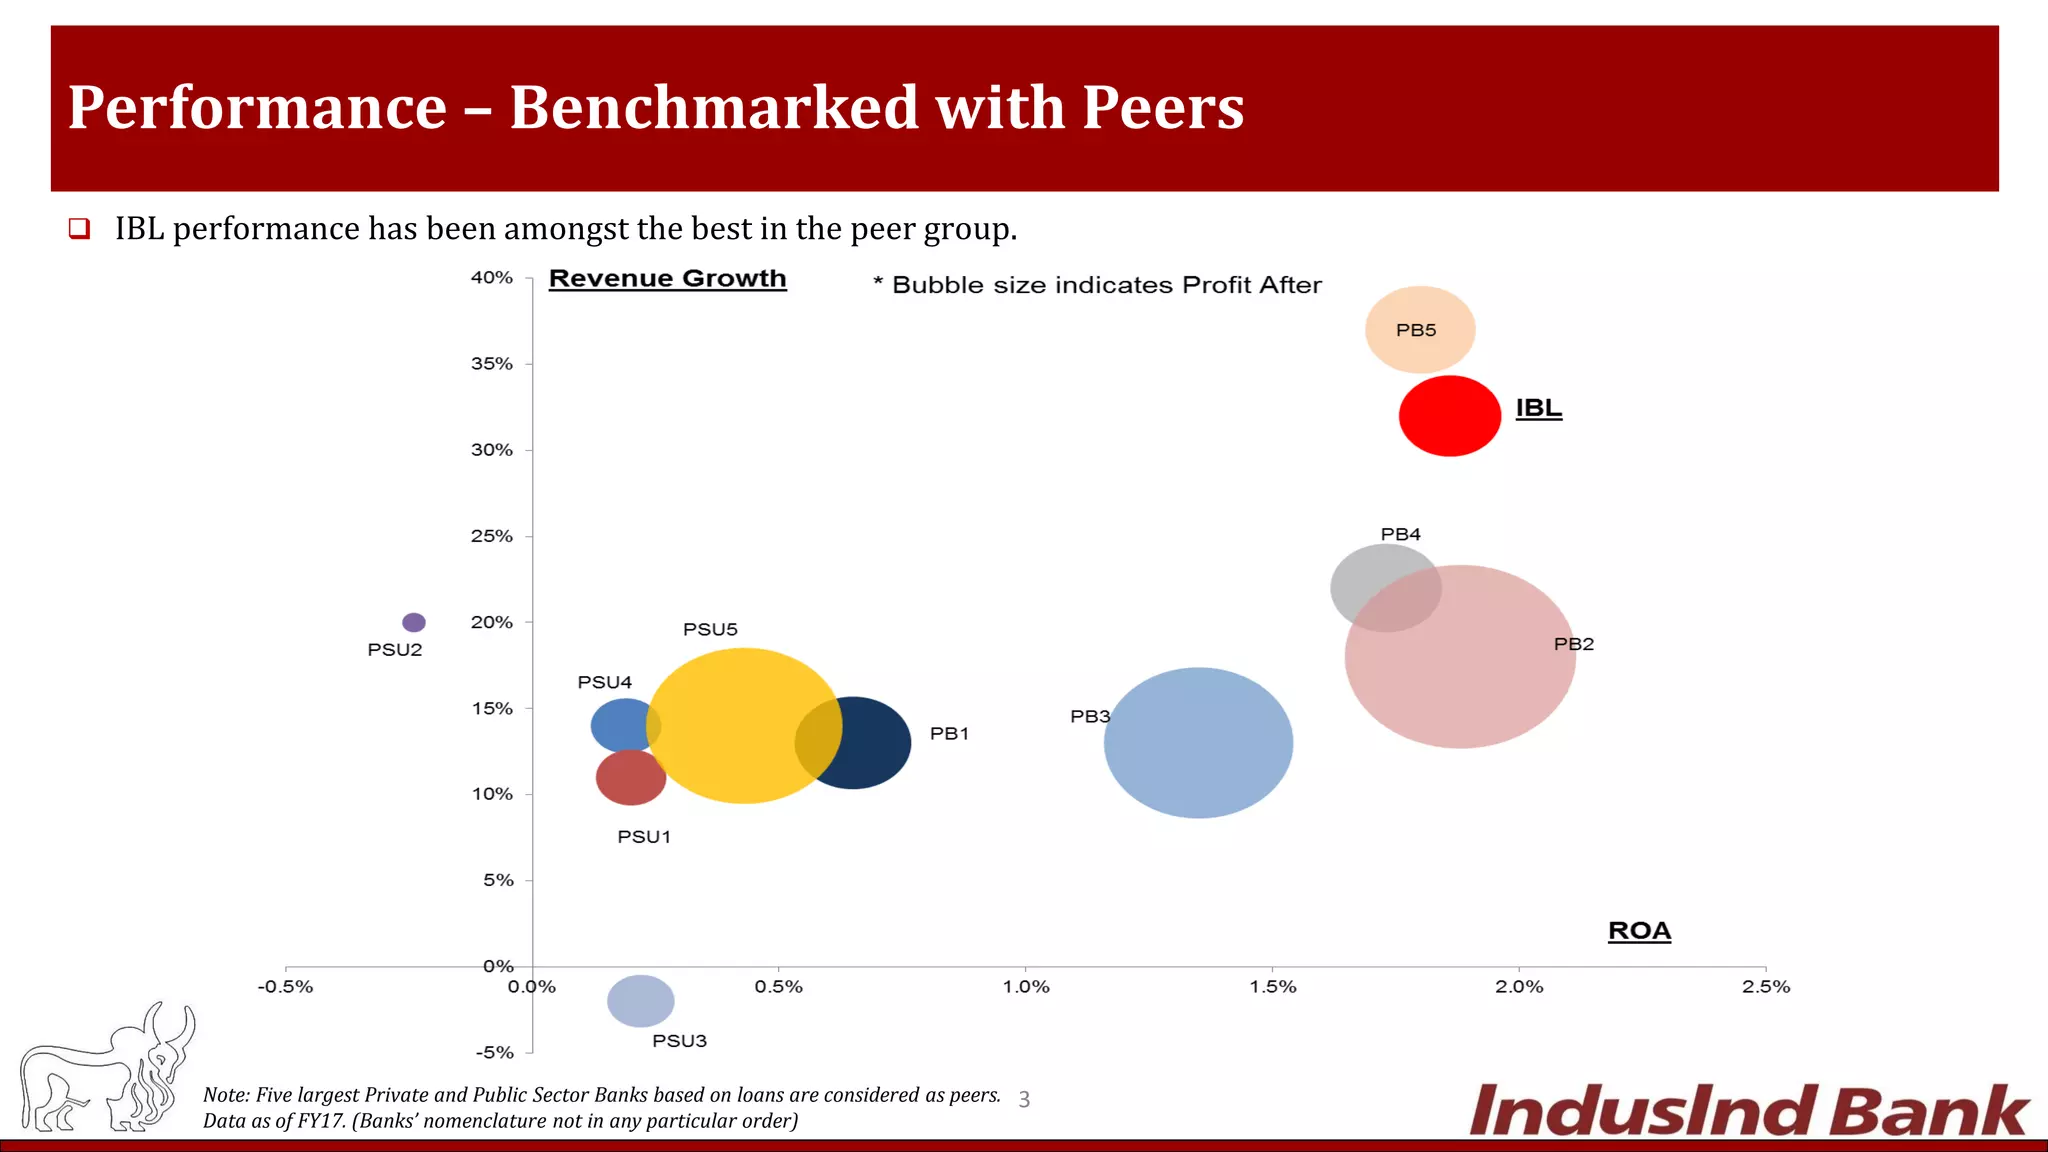
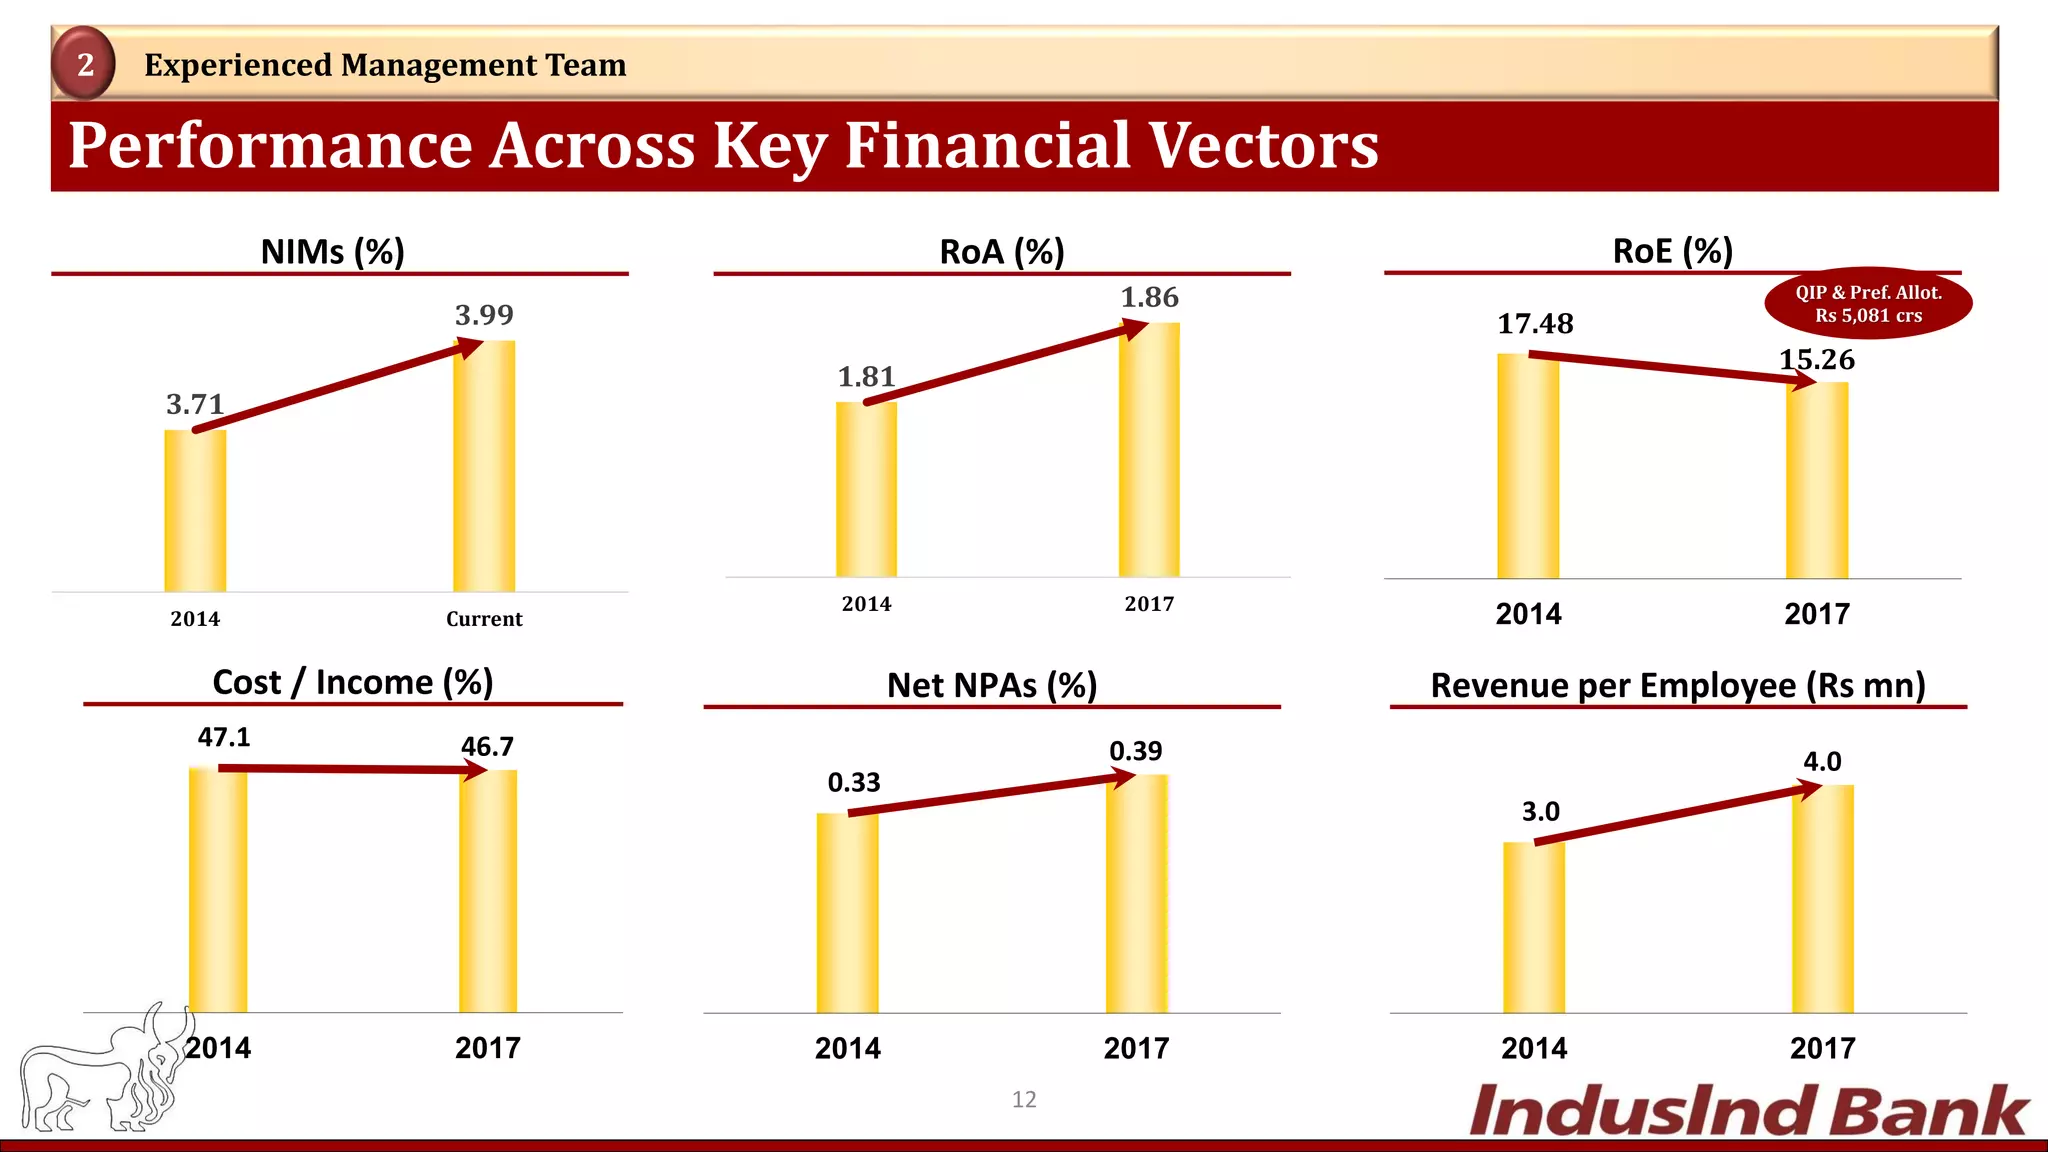
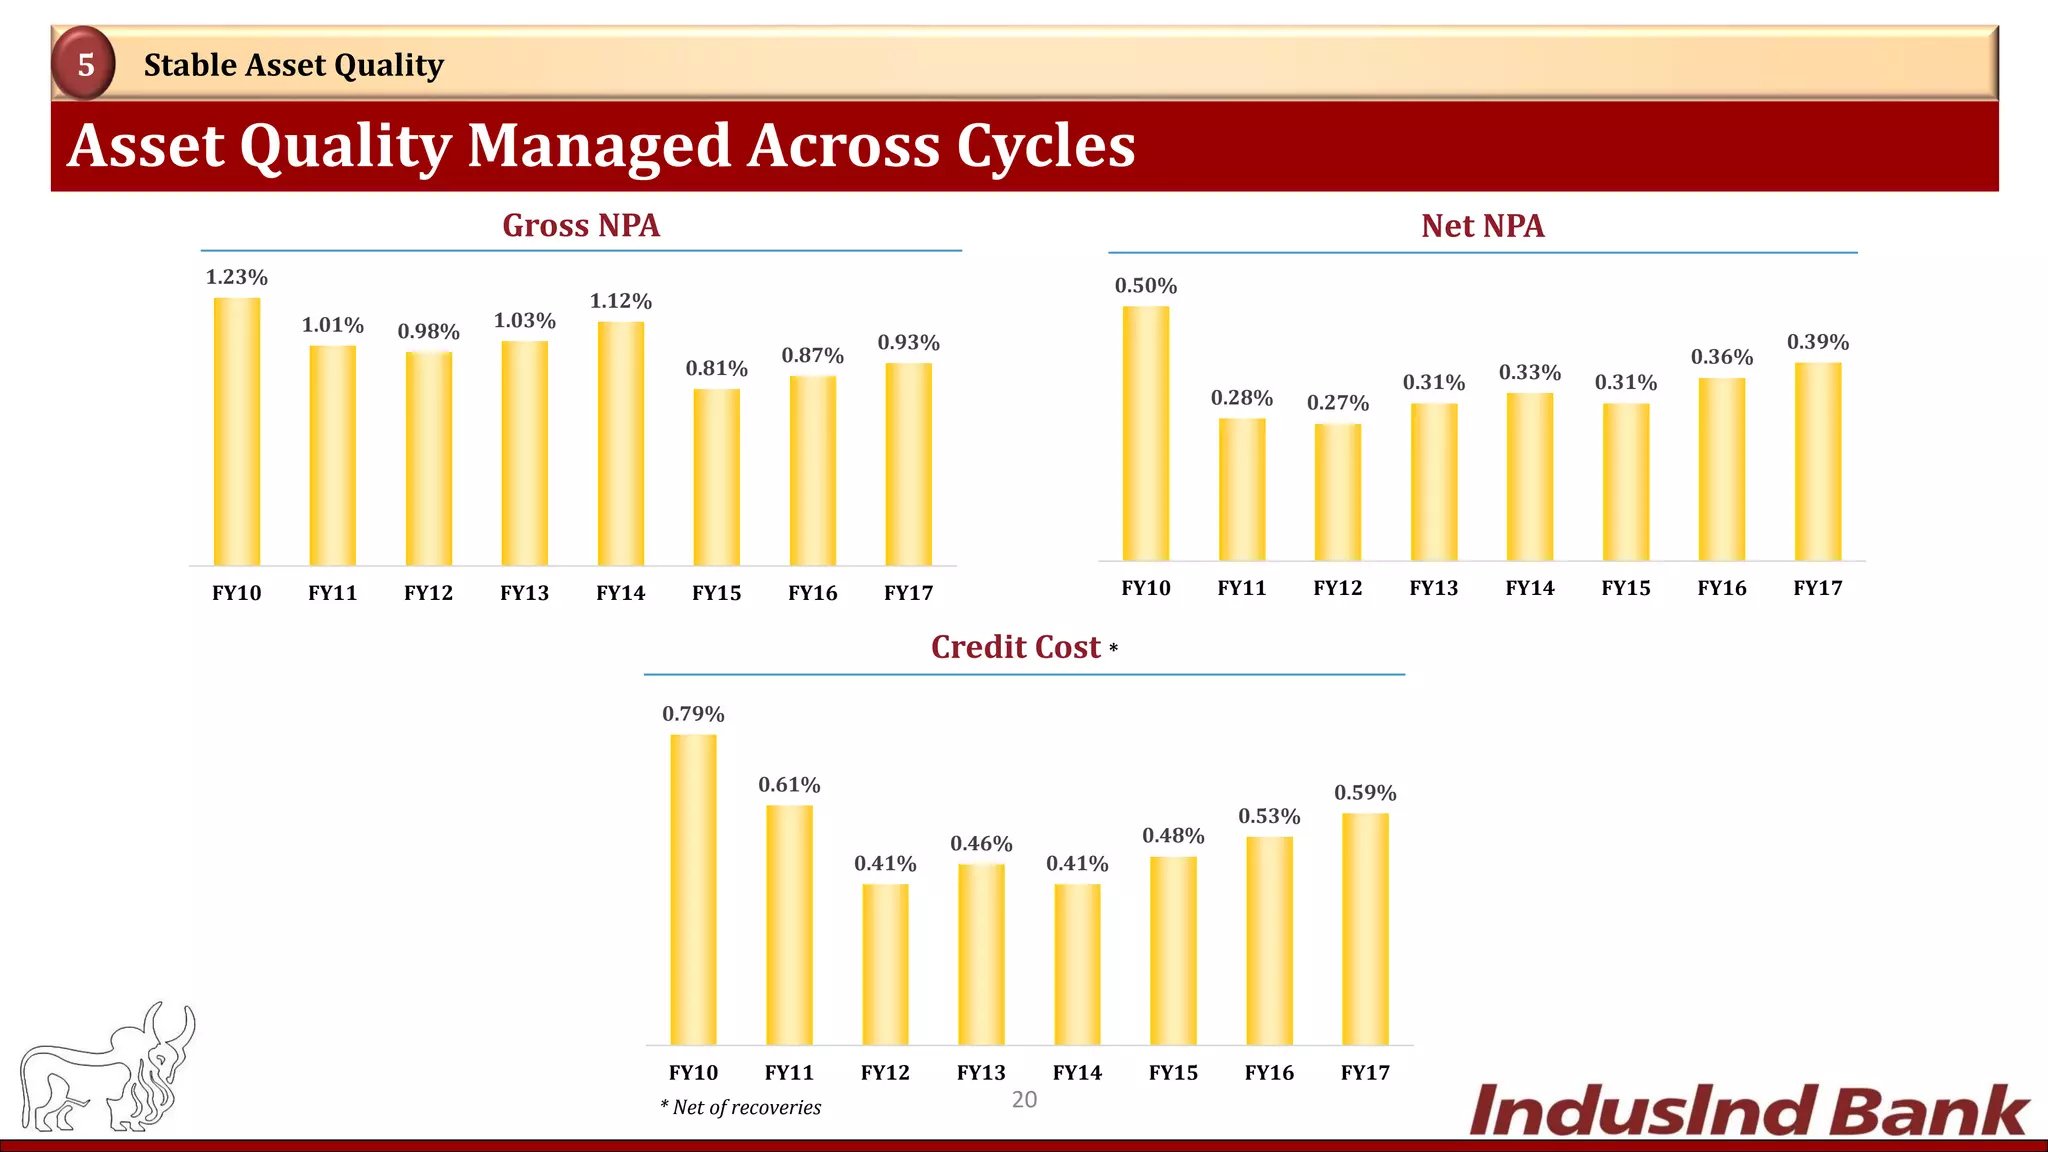
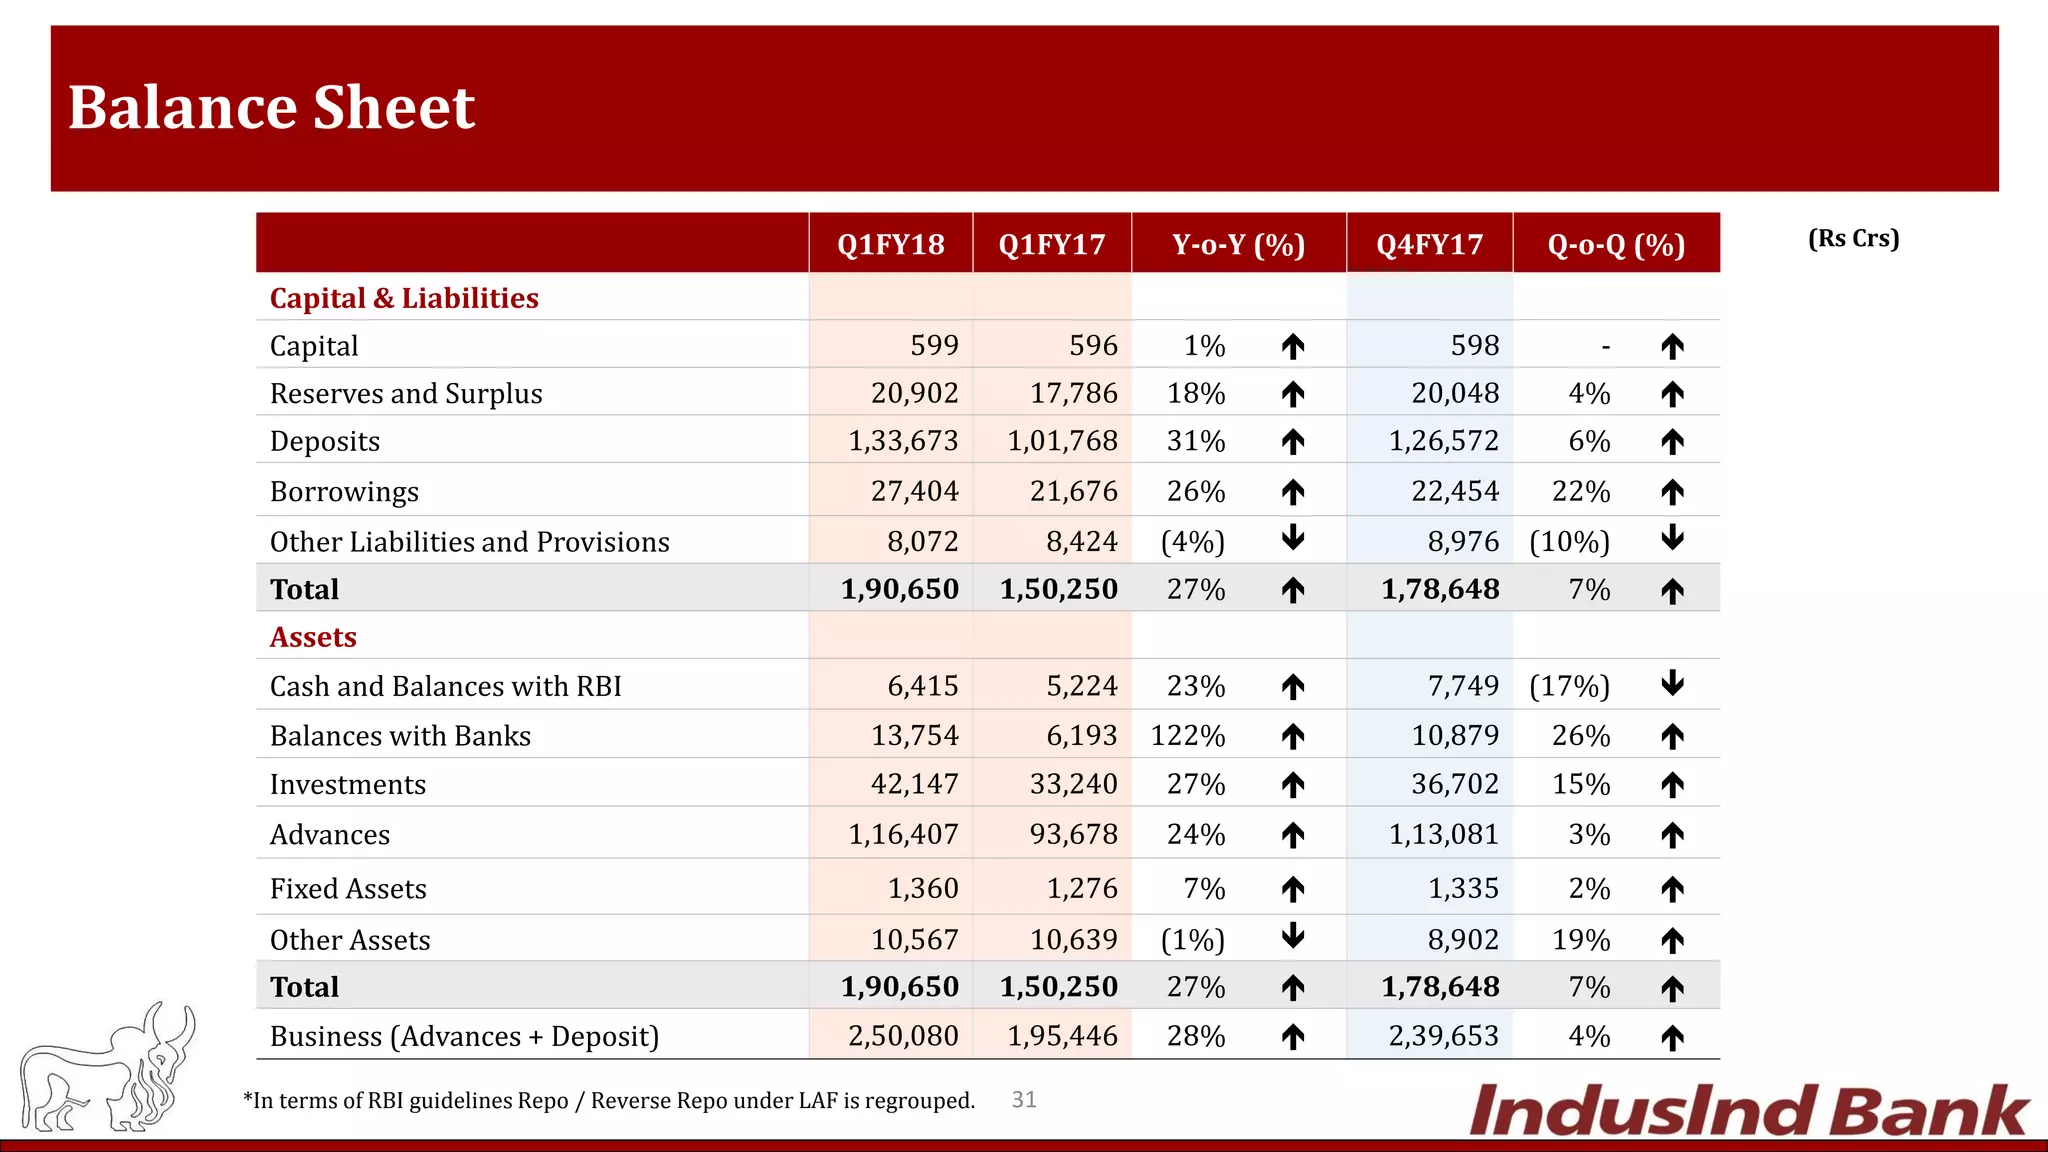
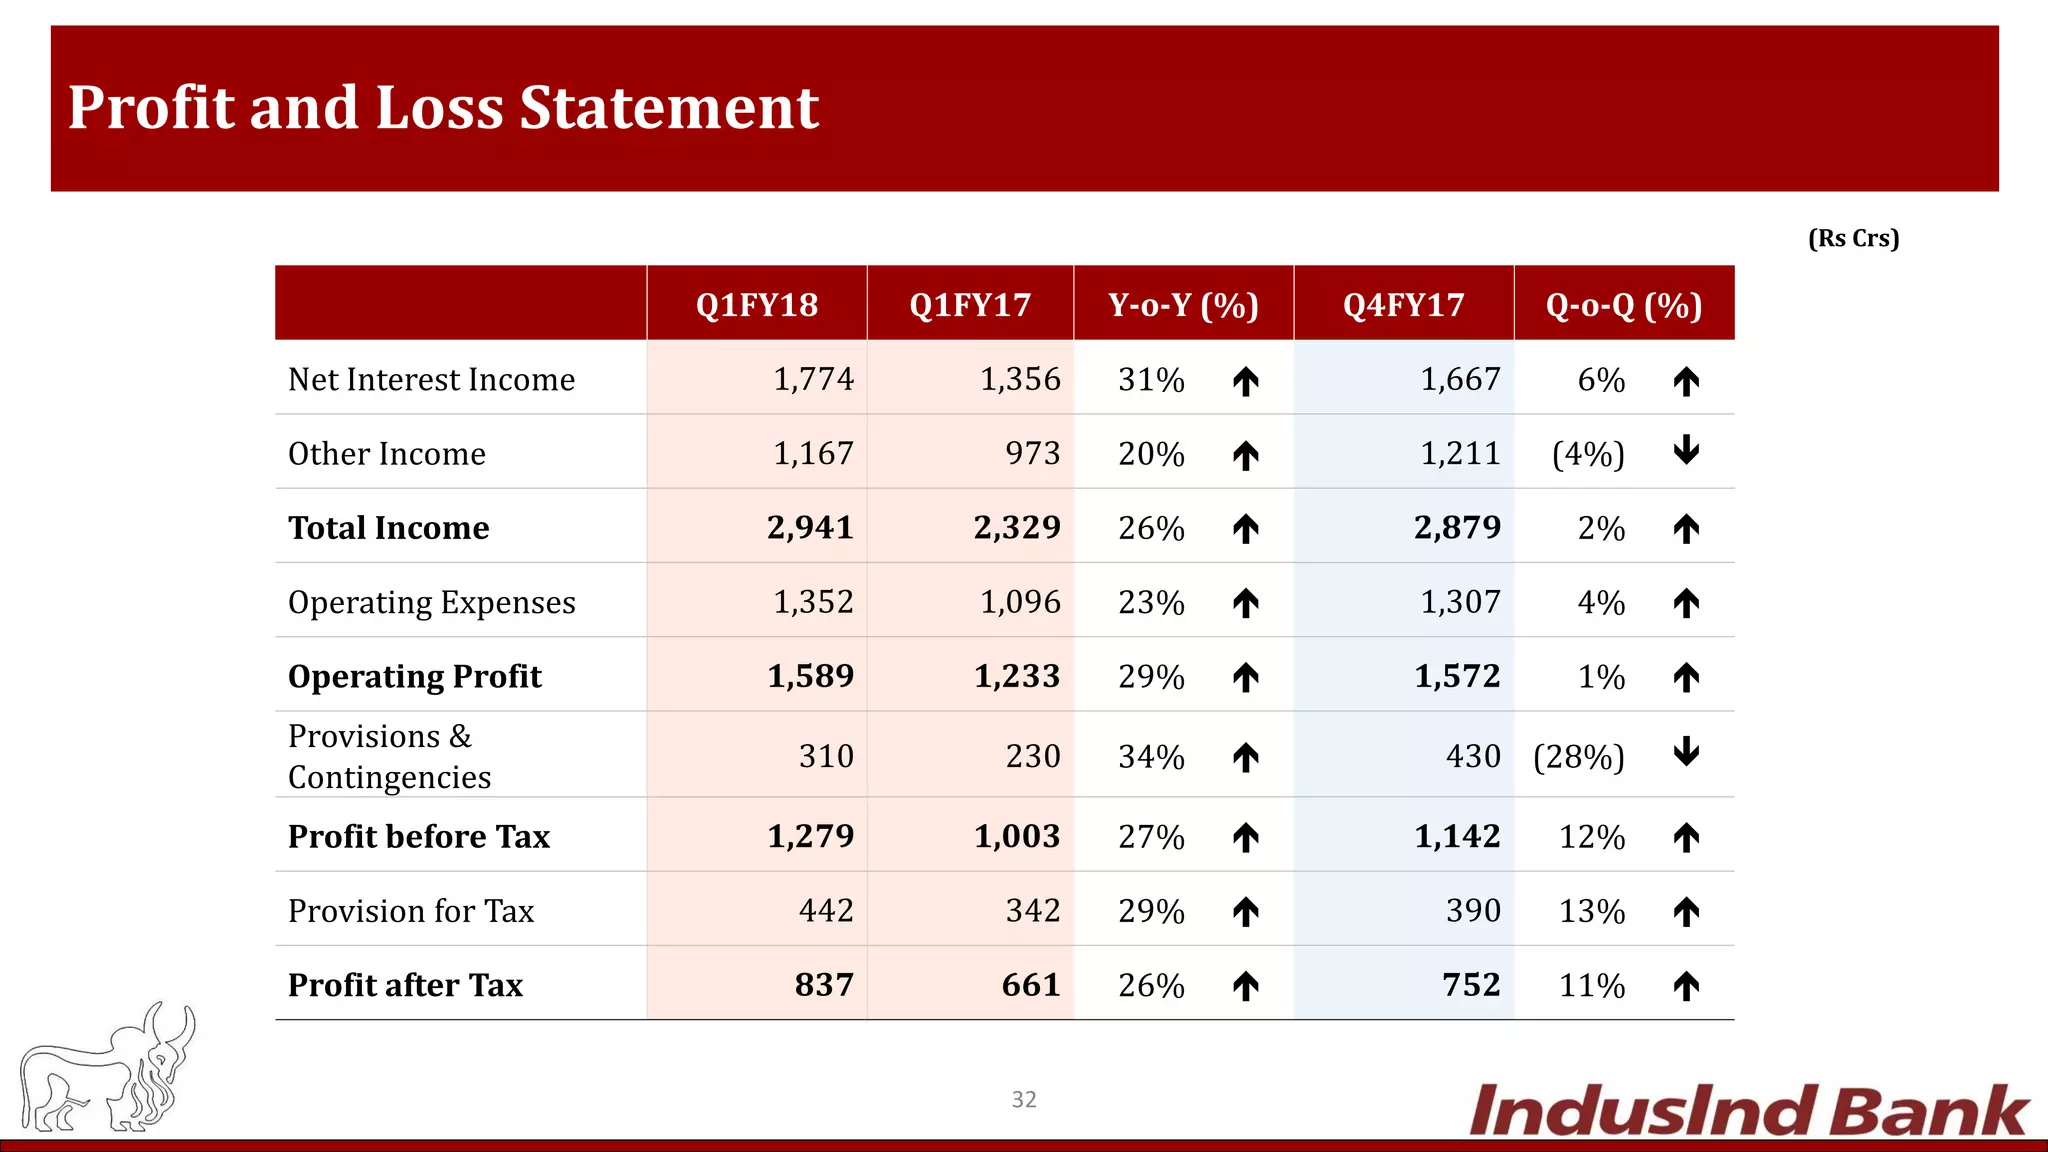
- For the fiscal year ending March 2017, IndusInd Bank reported strong growth in loans (27%), deposits (28%), revenue (29%) and profits (27%). Asset quality remains stable with low NPAs of 0.39%.
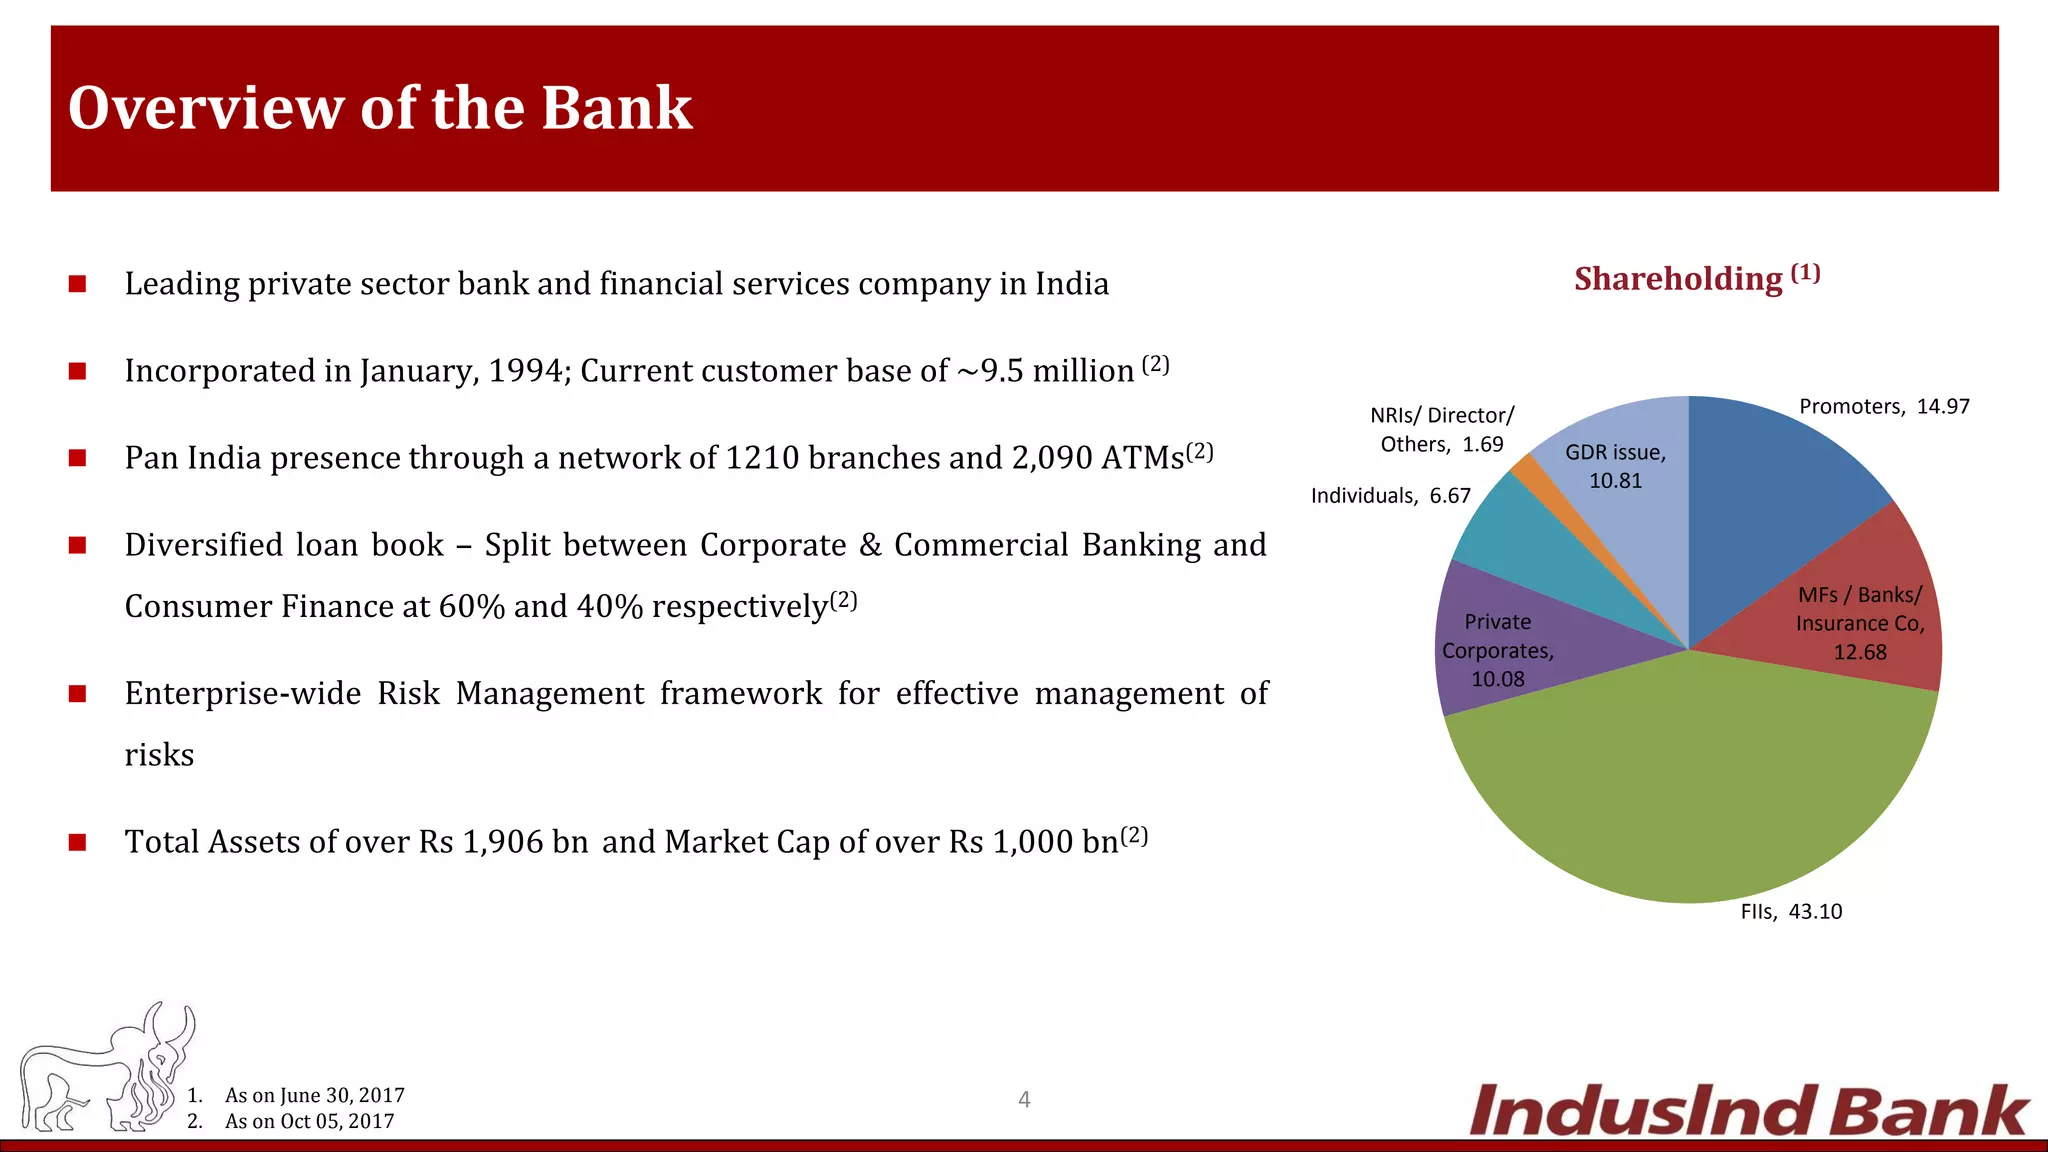
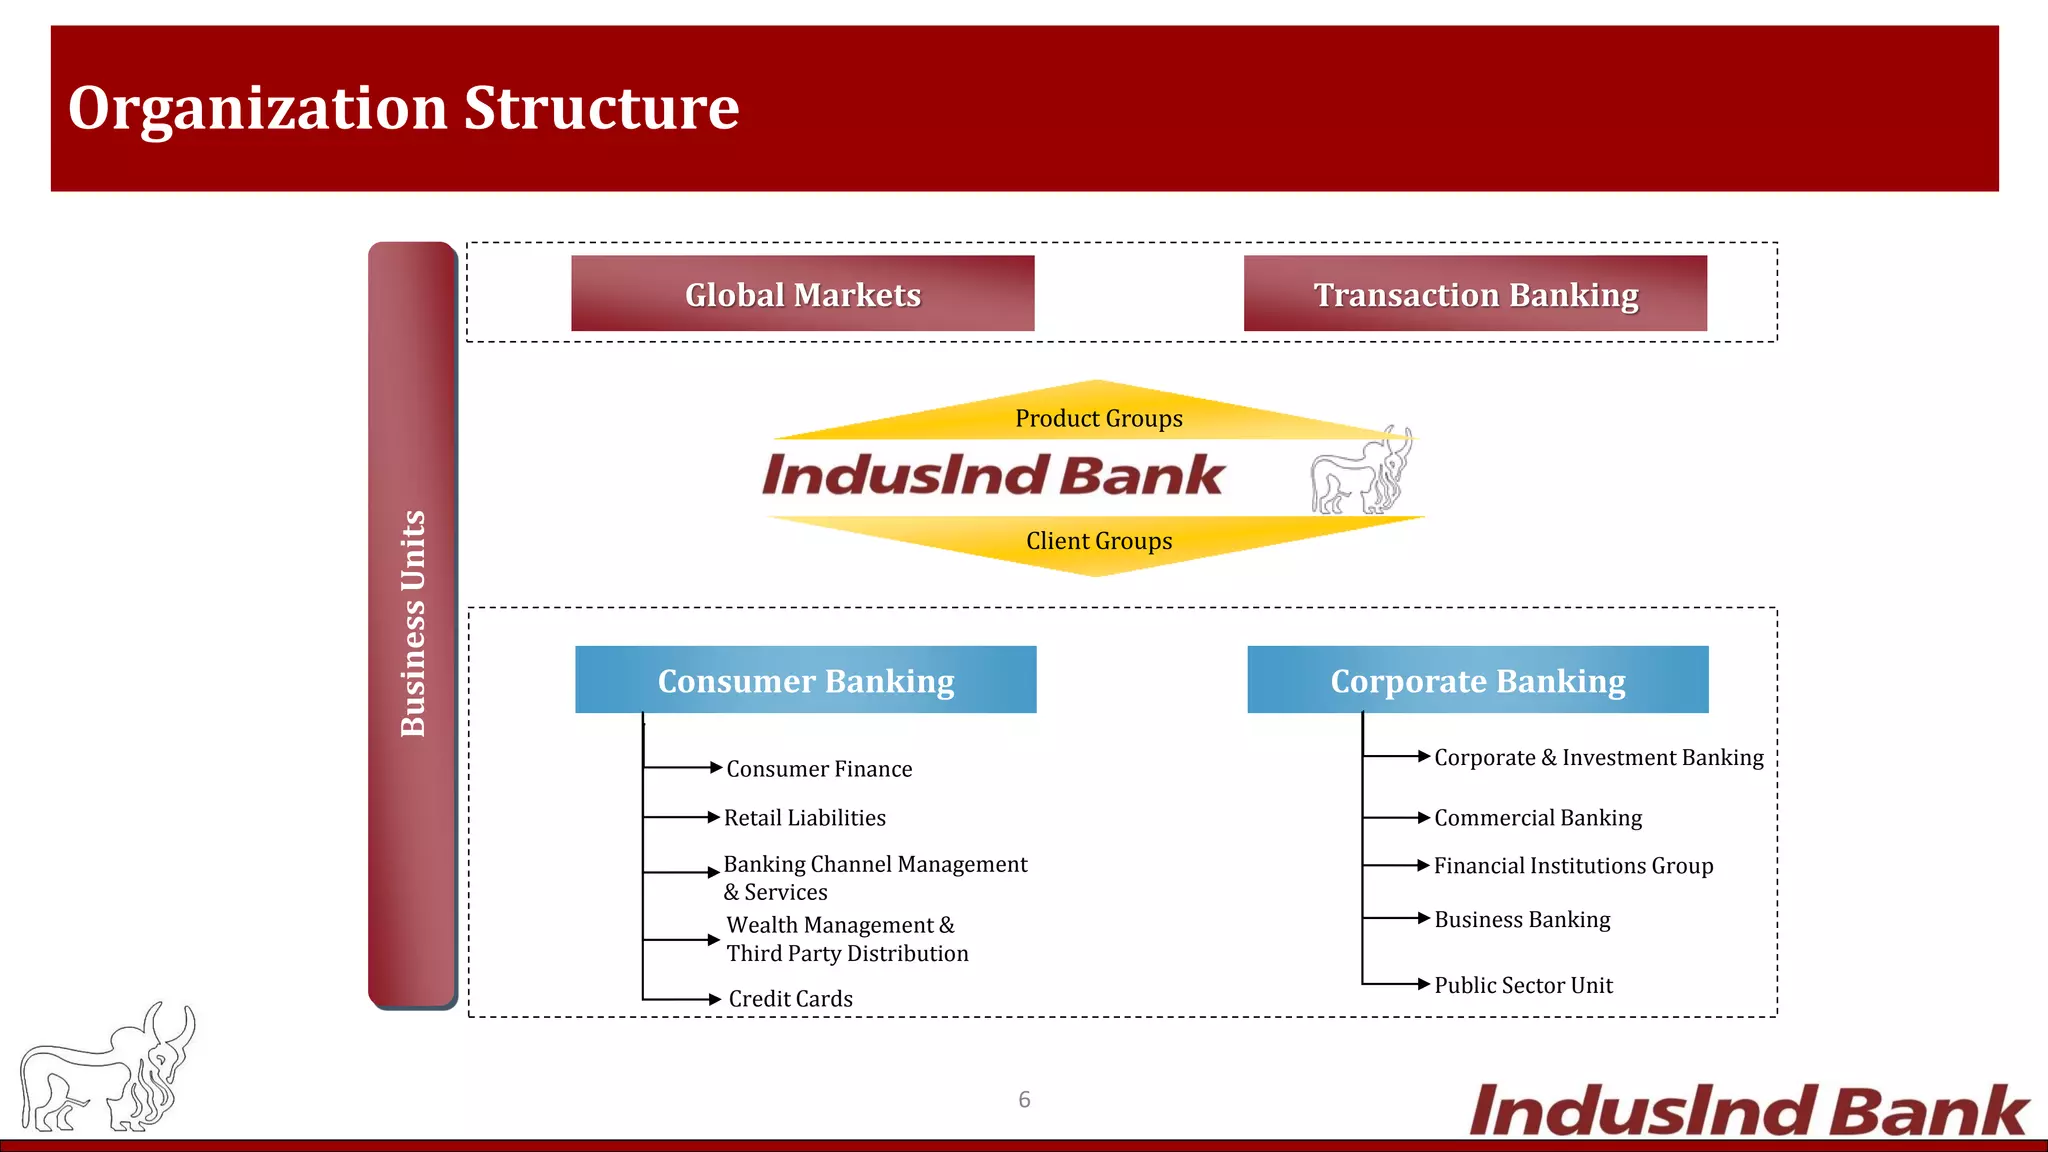
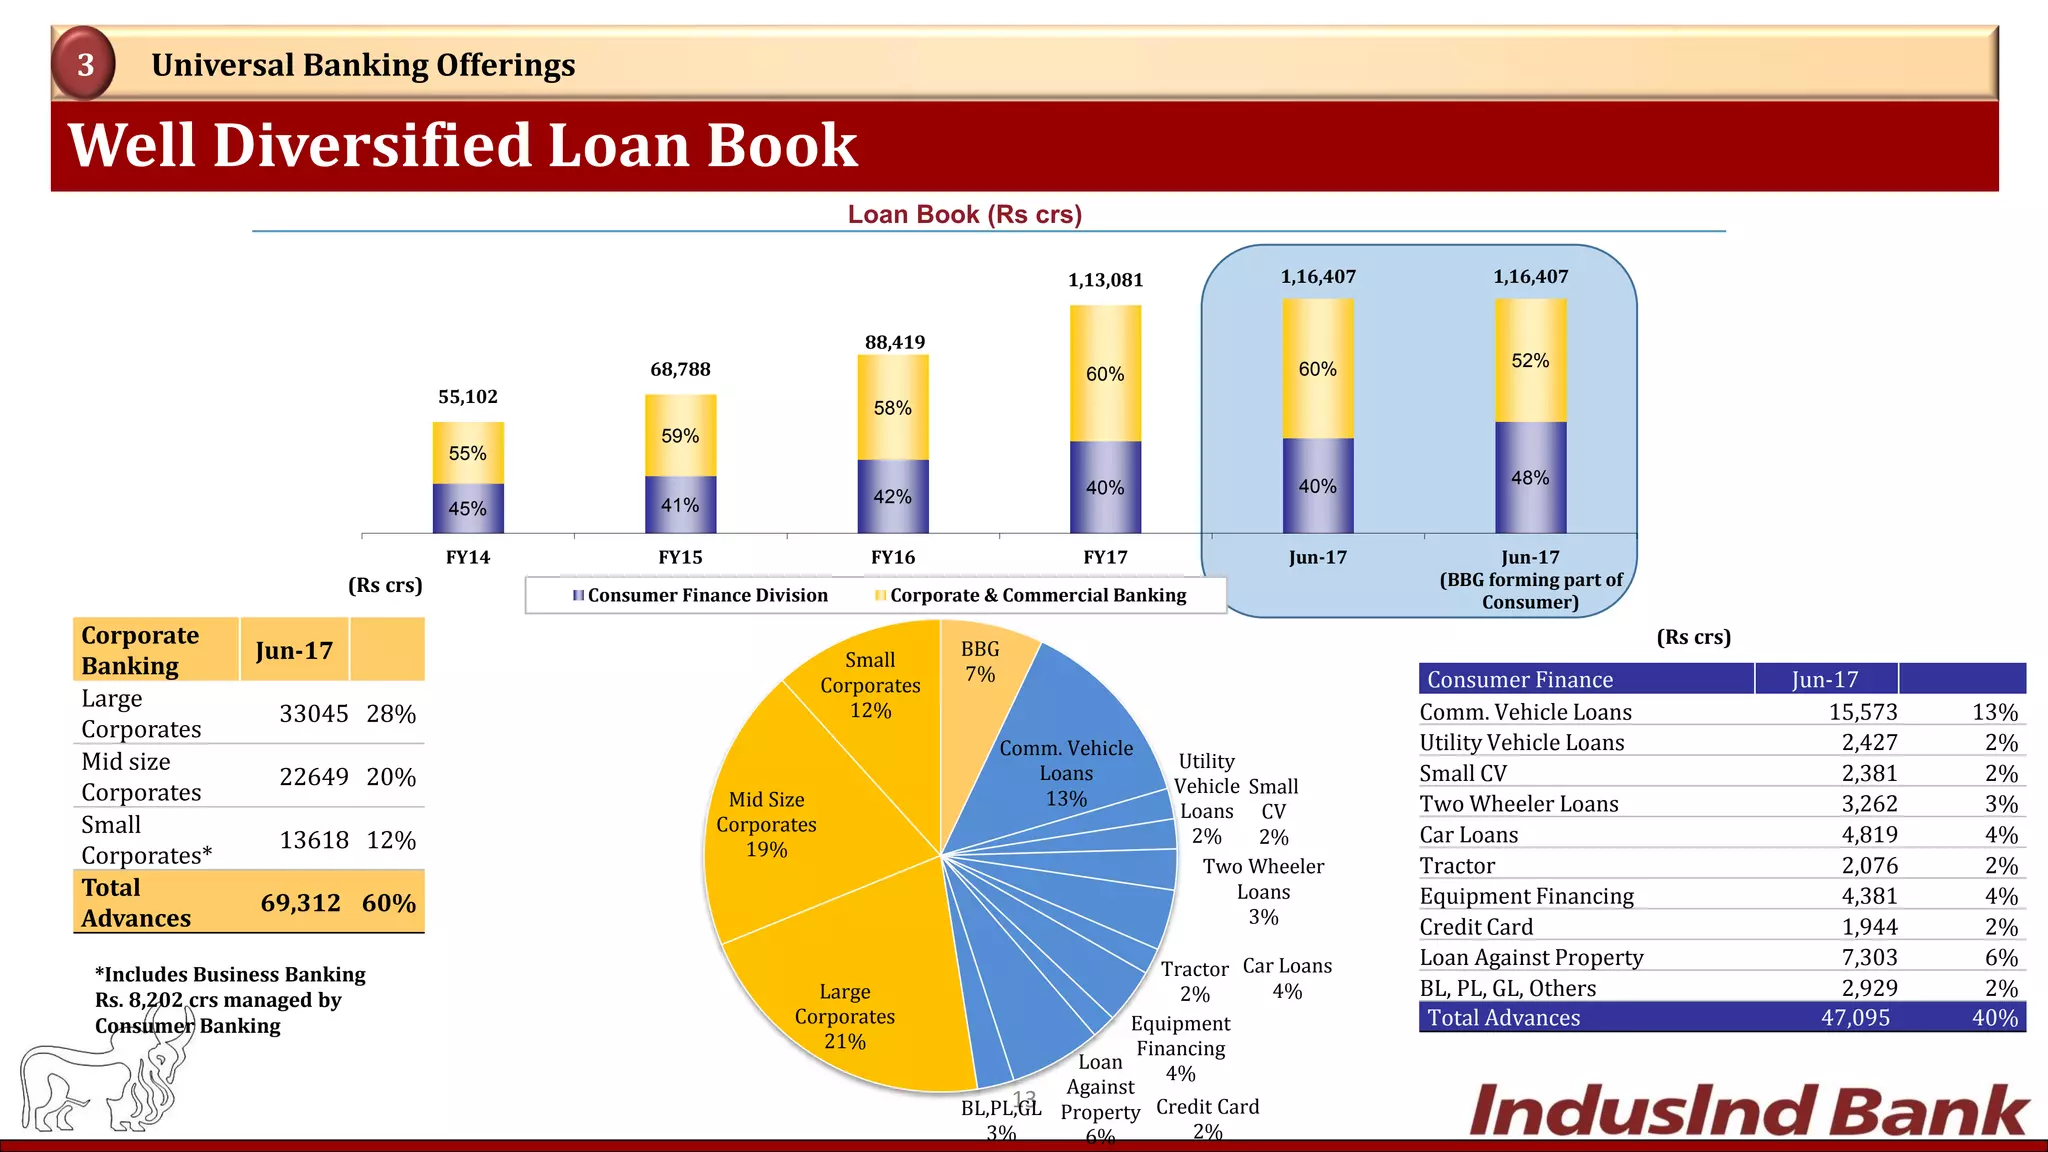
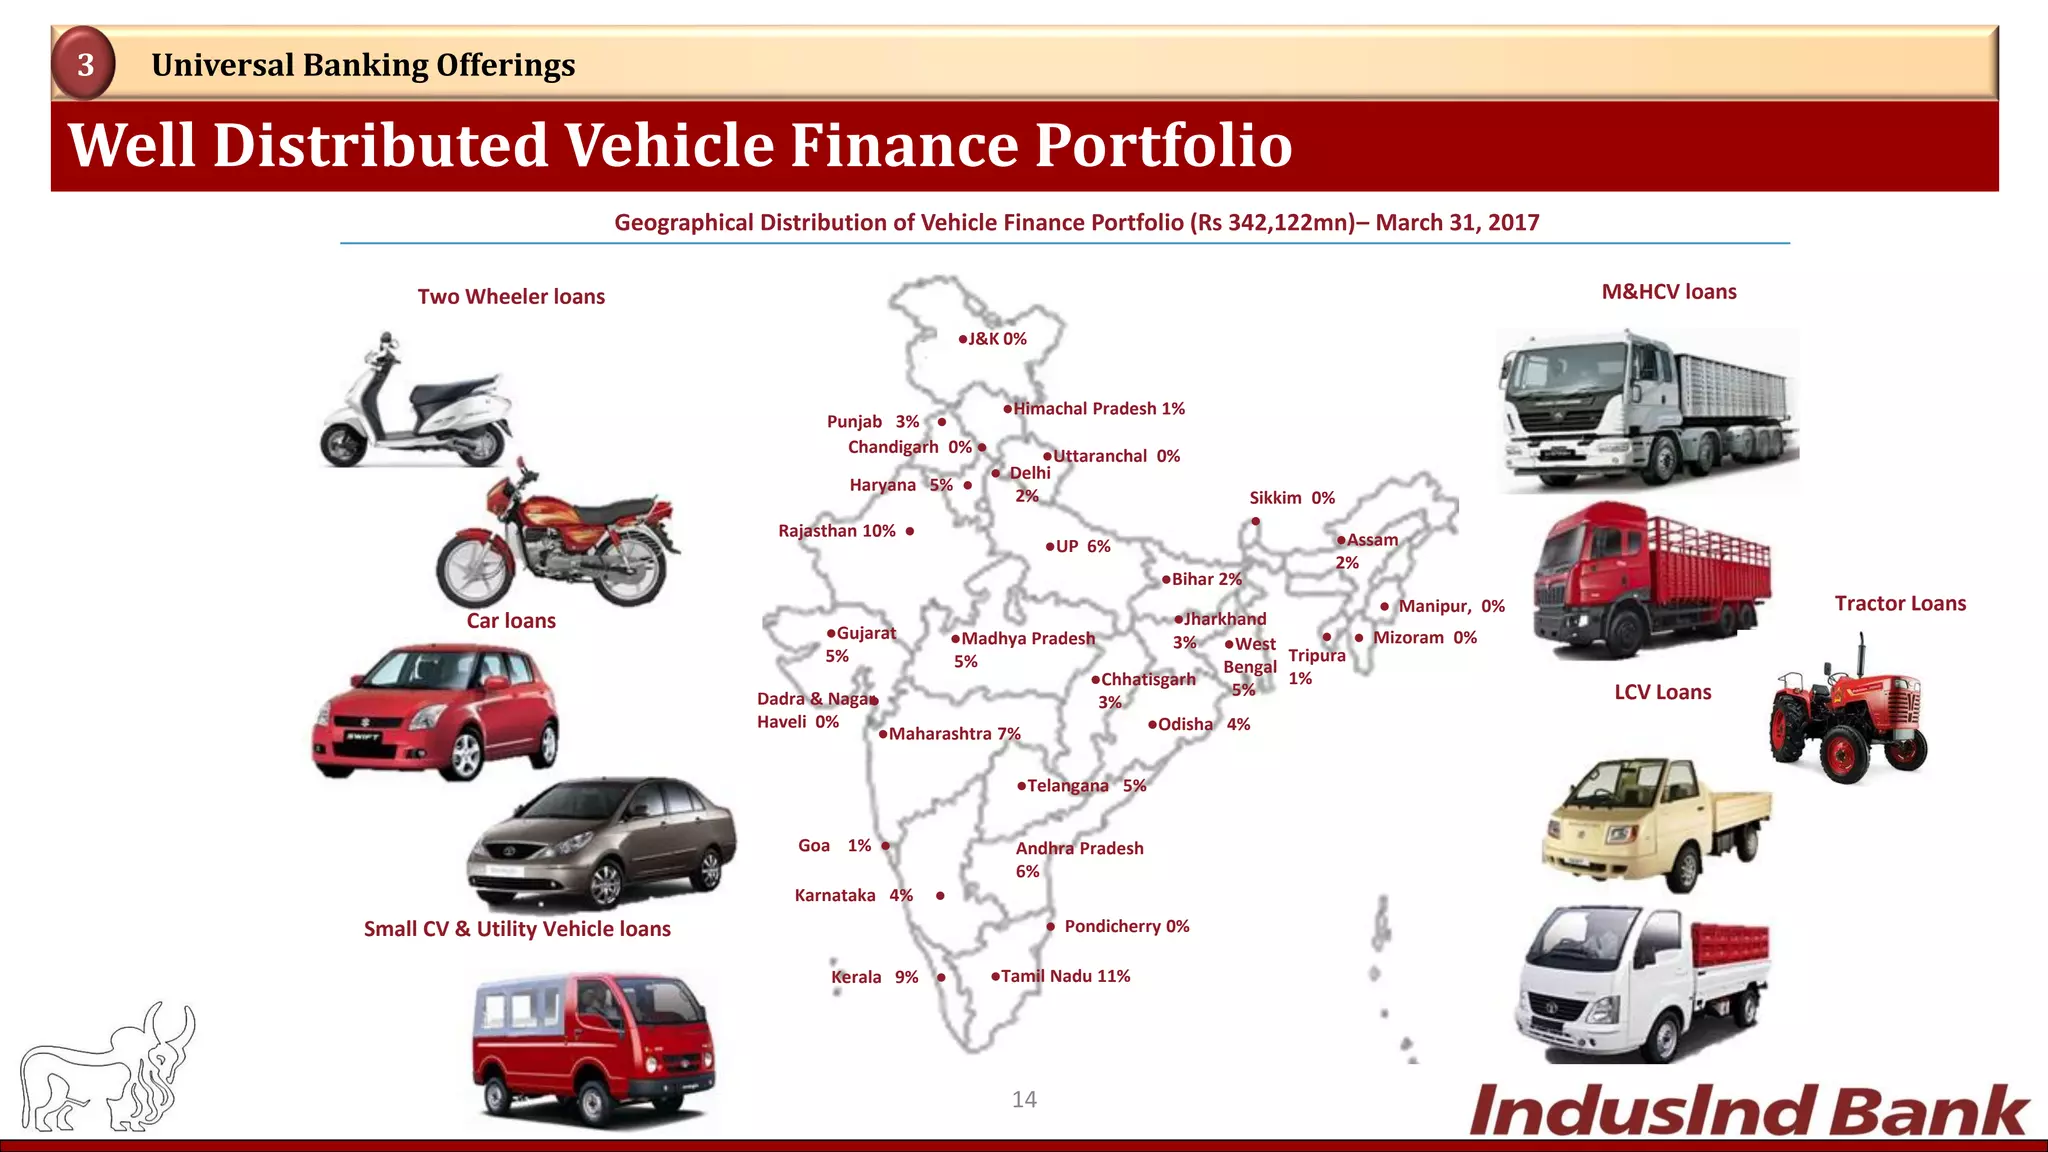
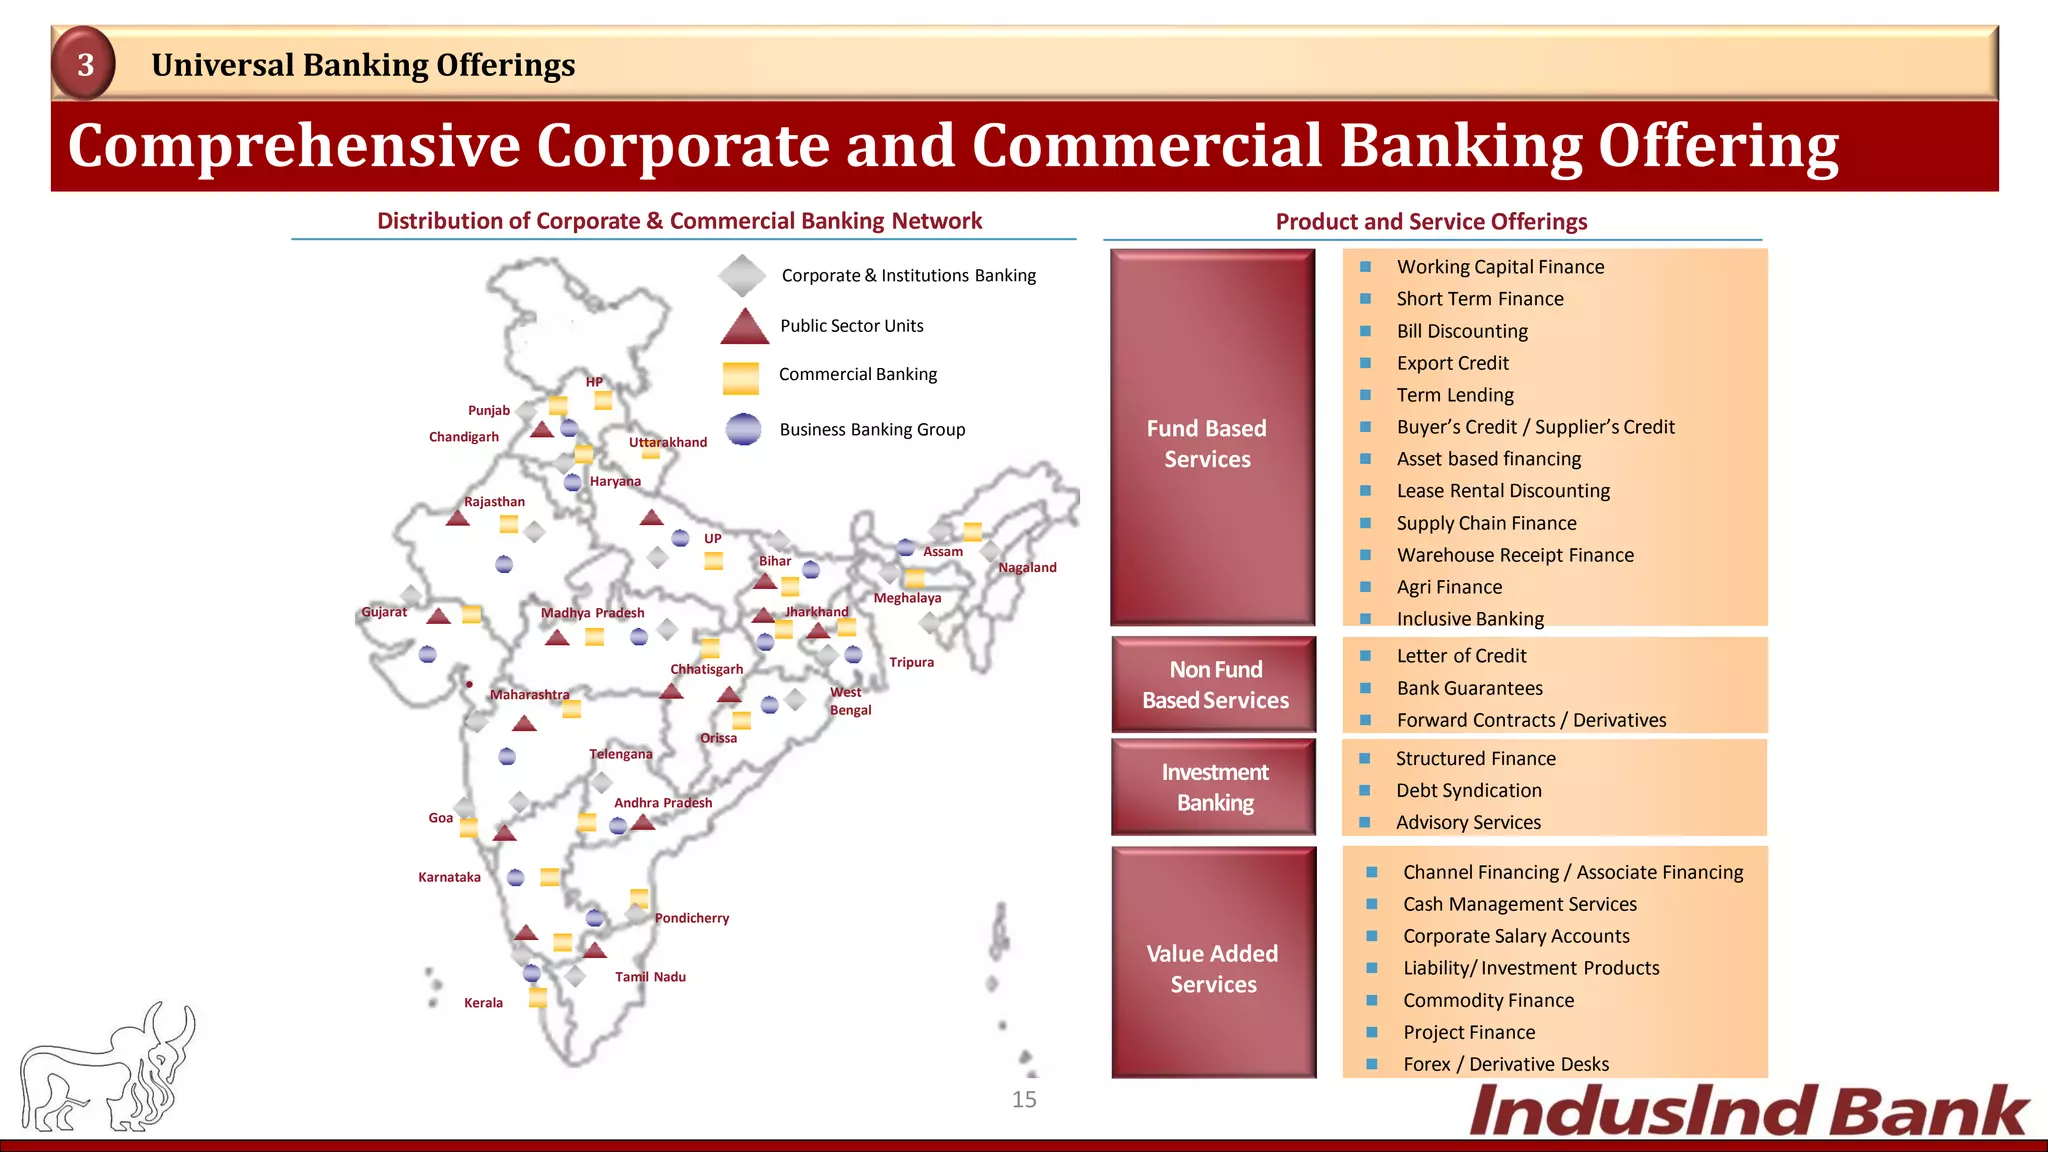
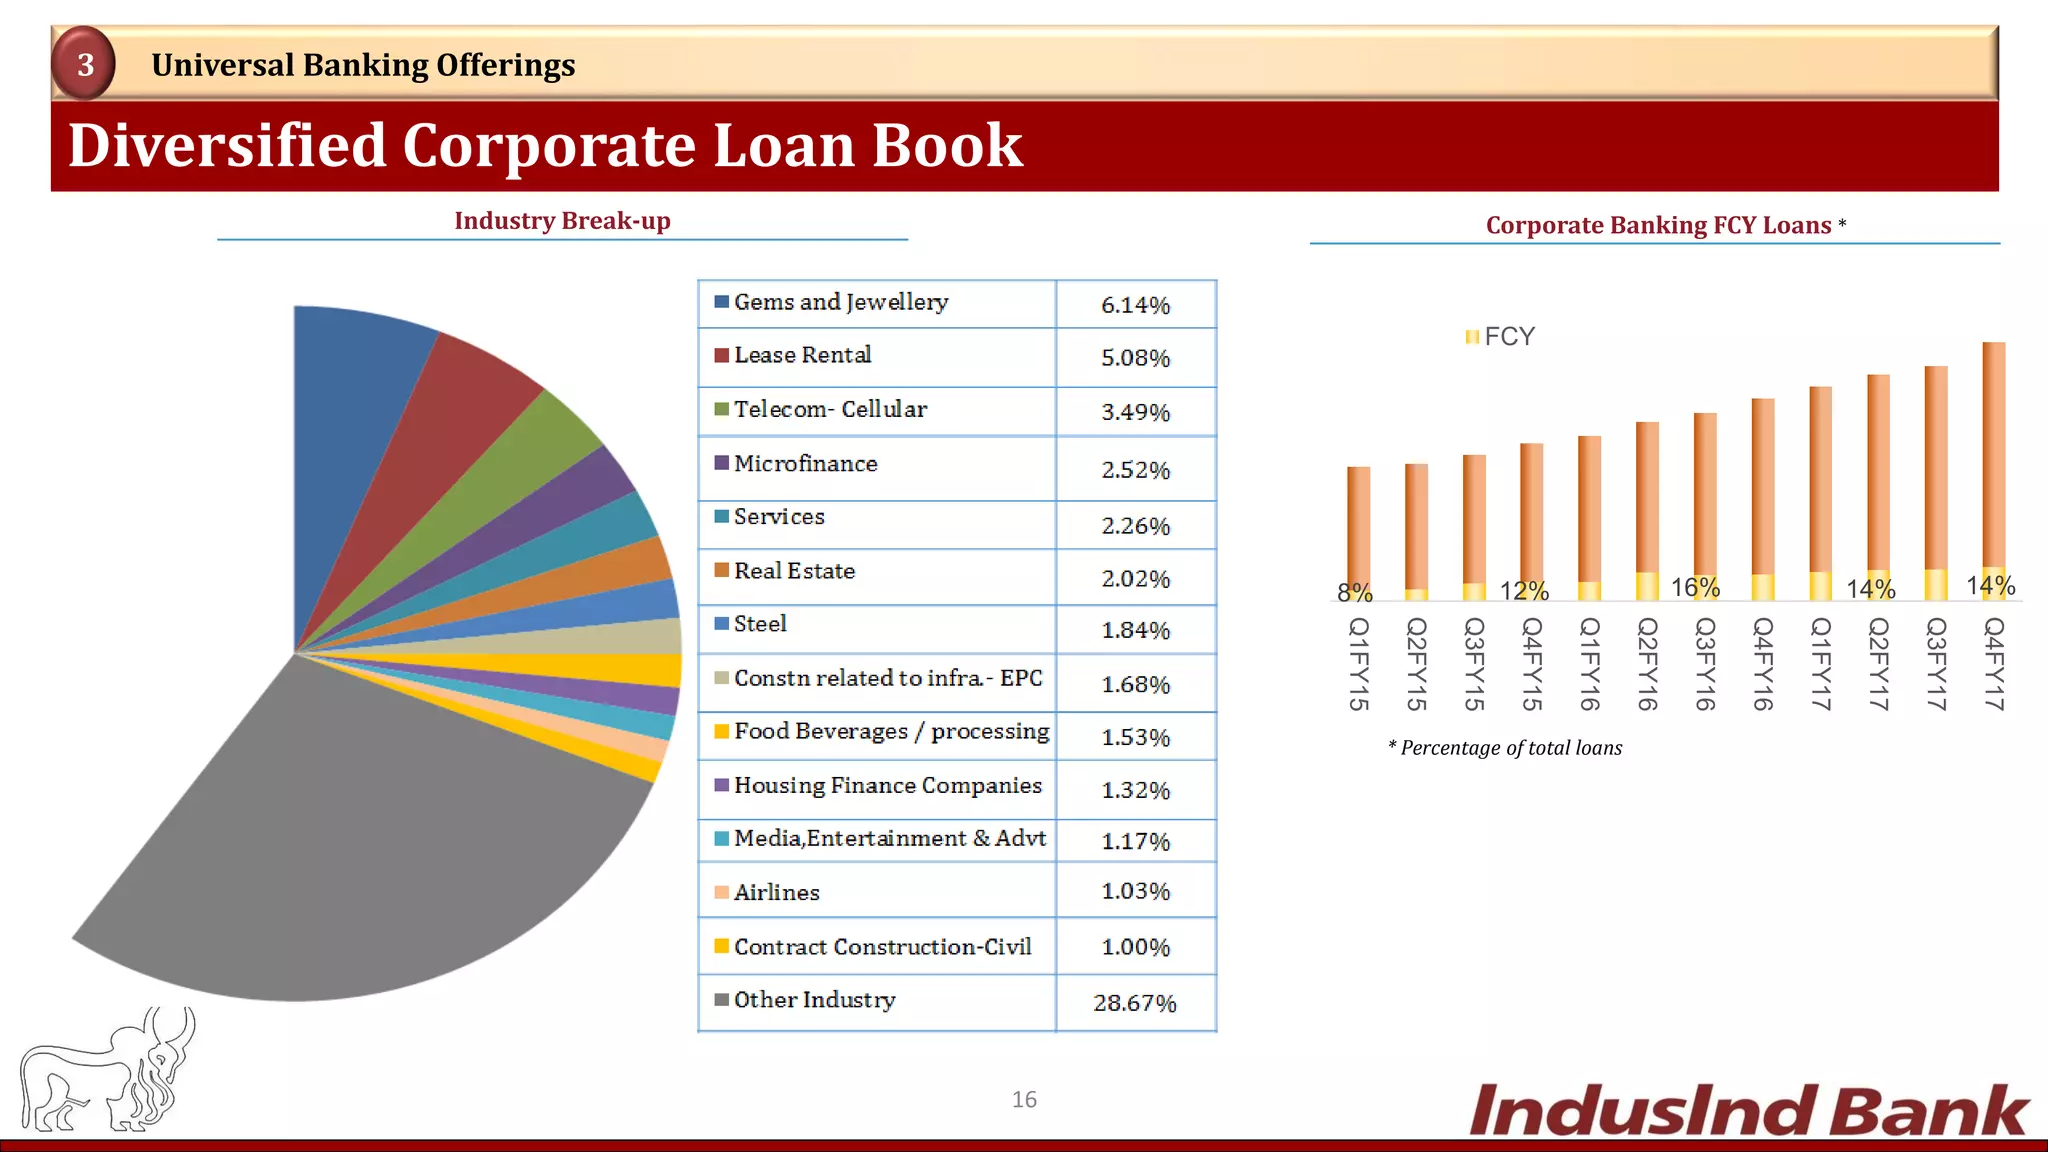
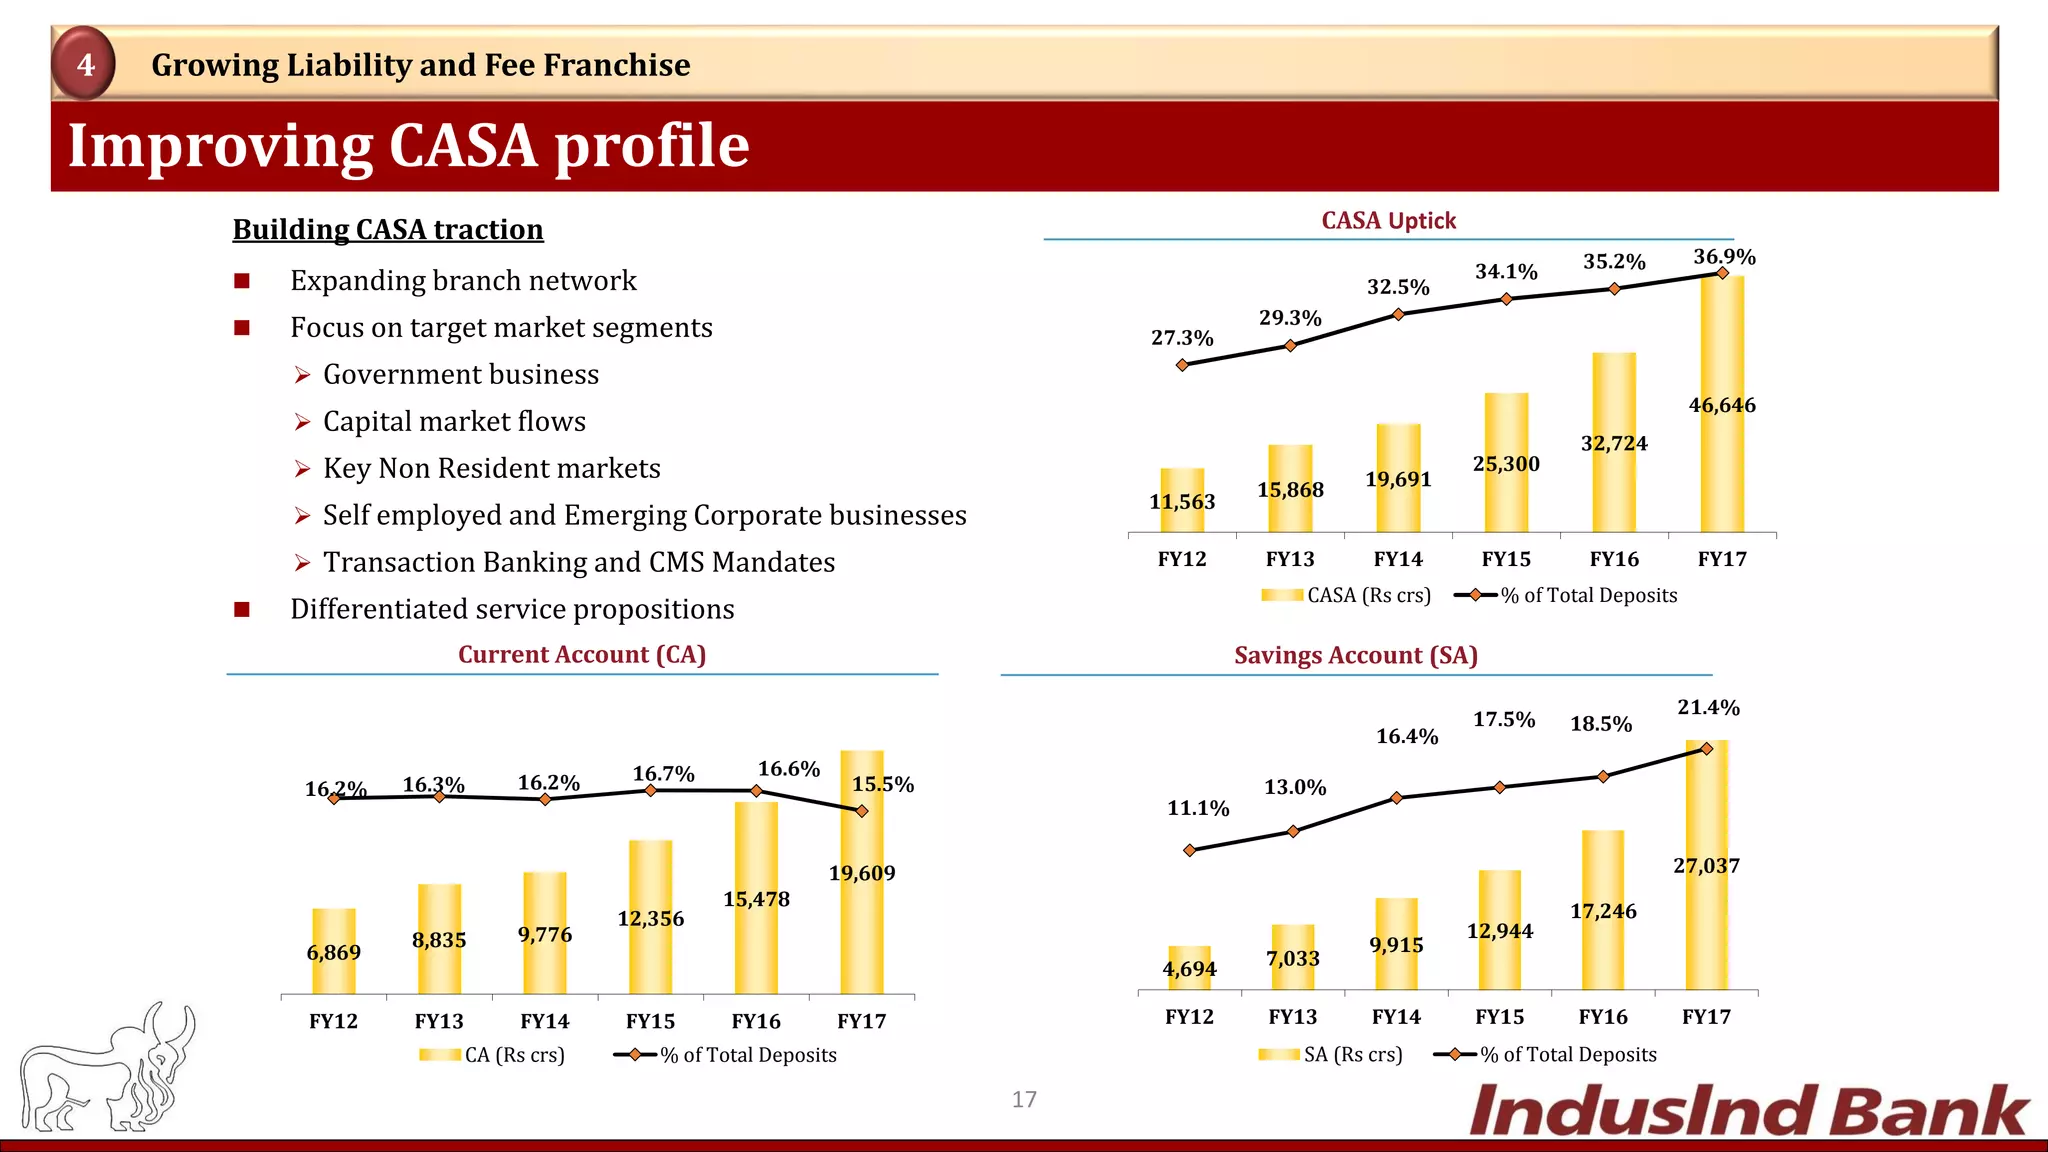
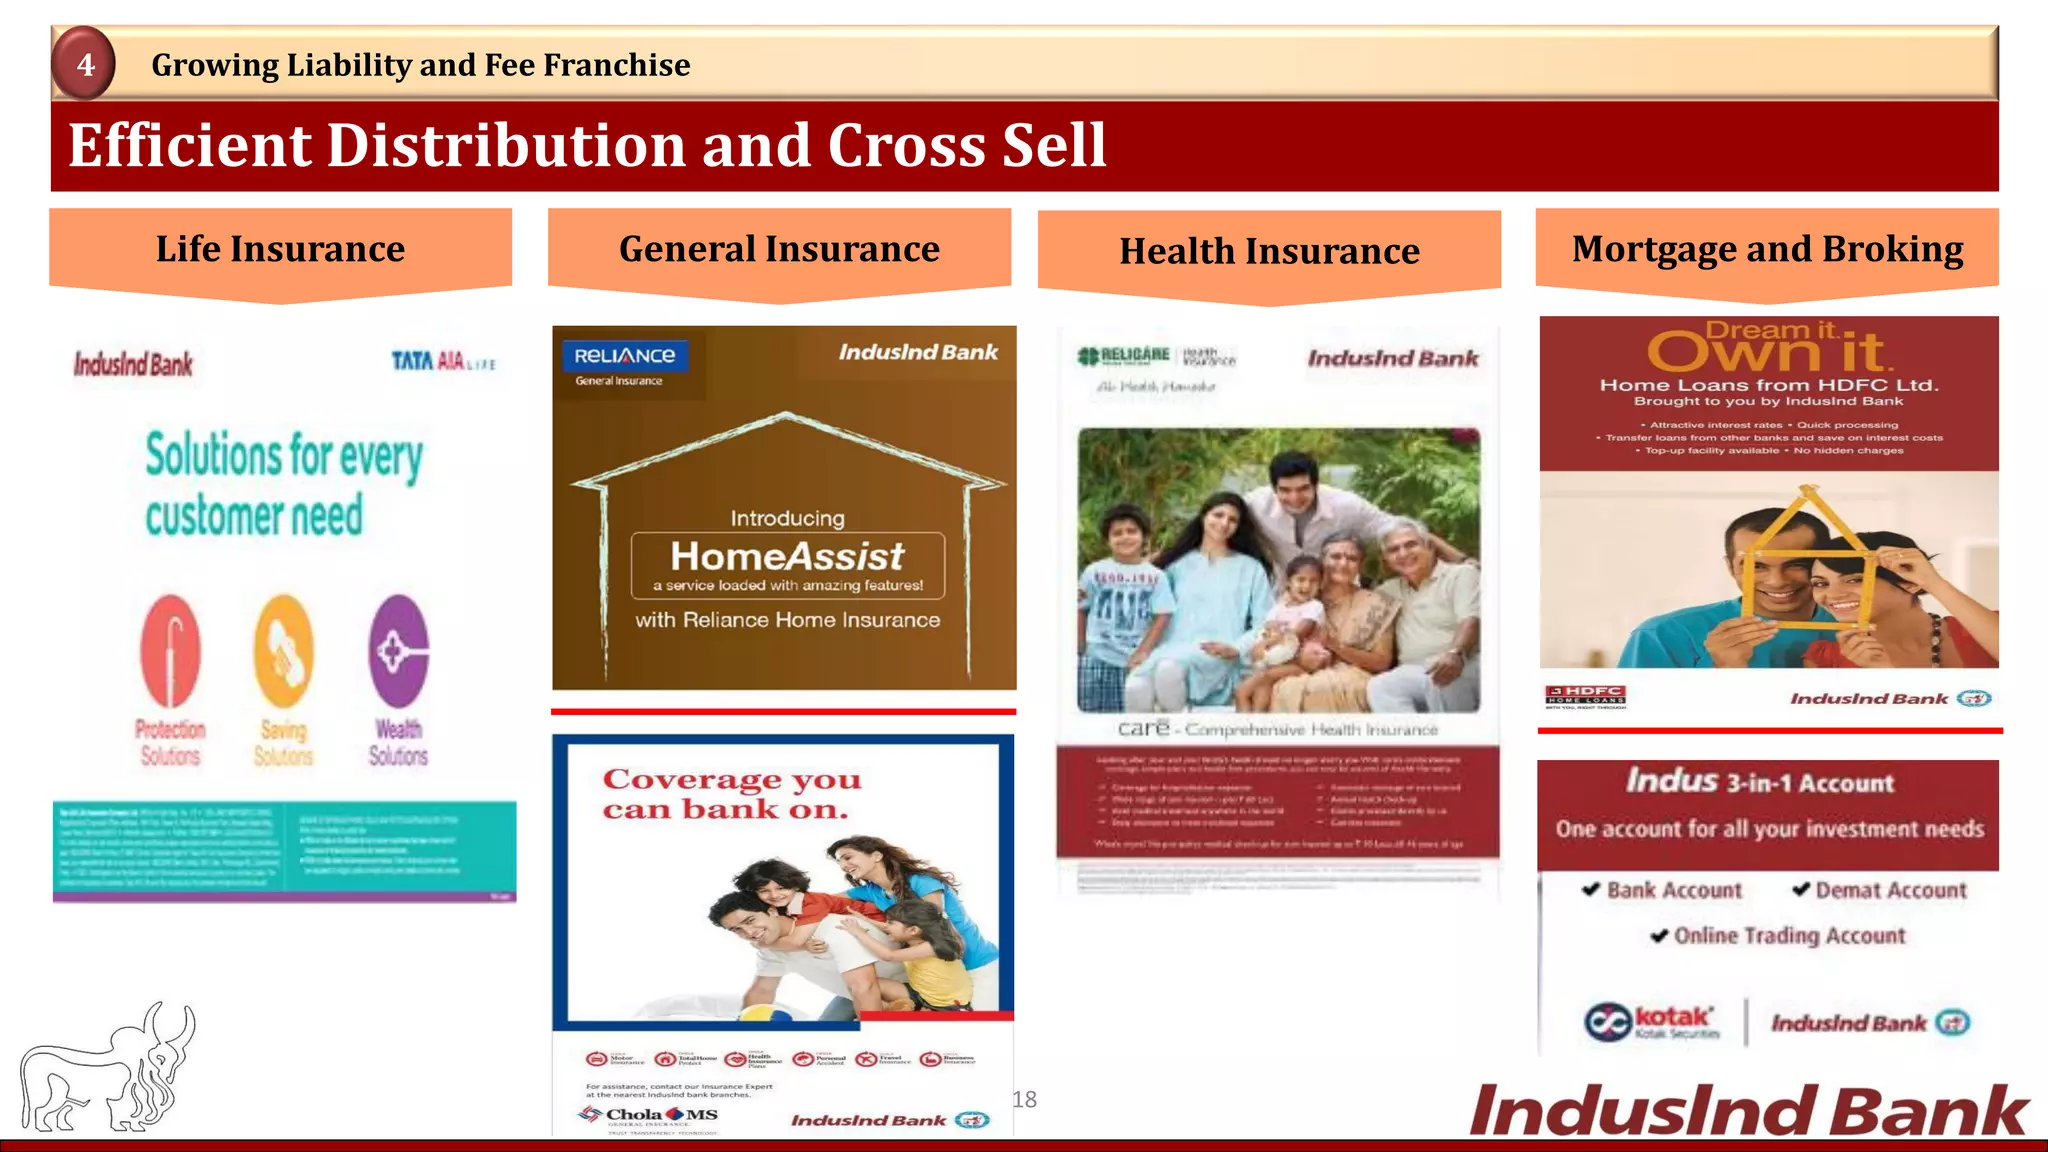
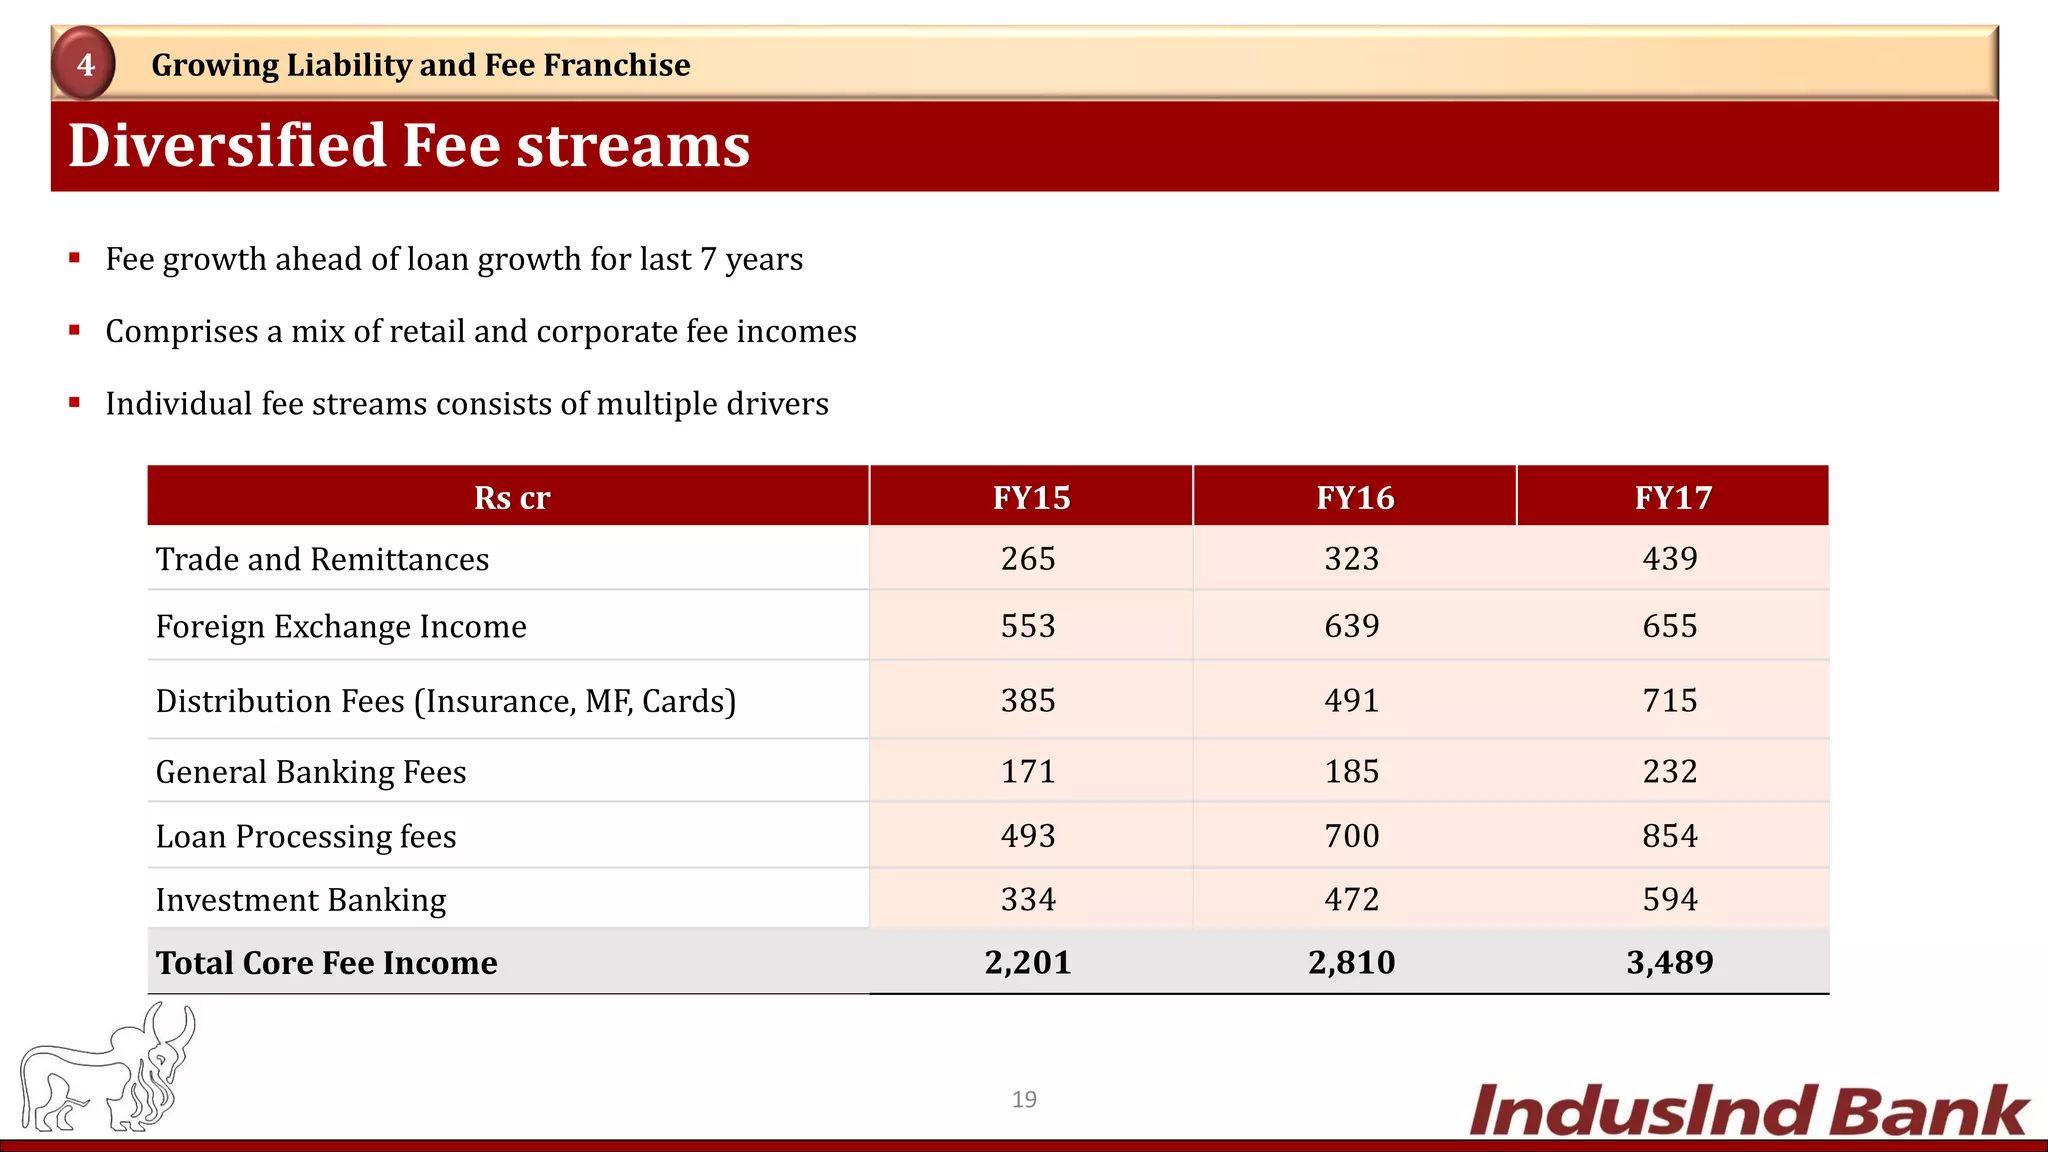
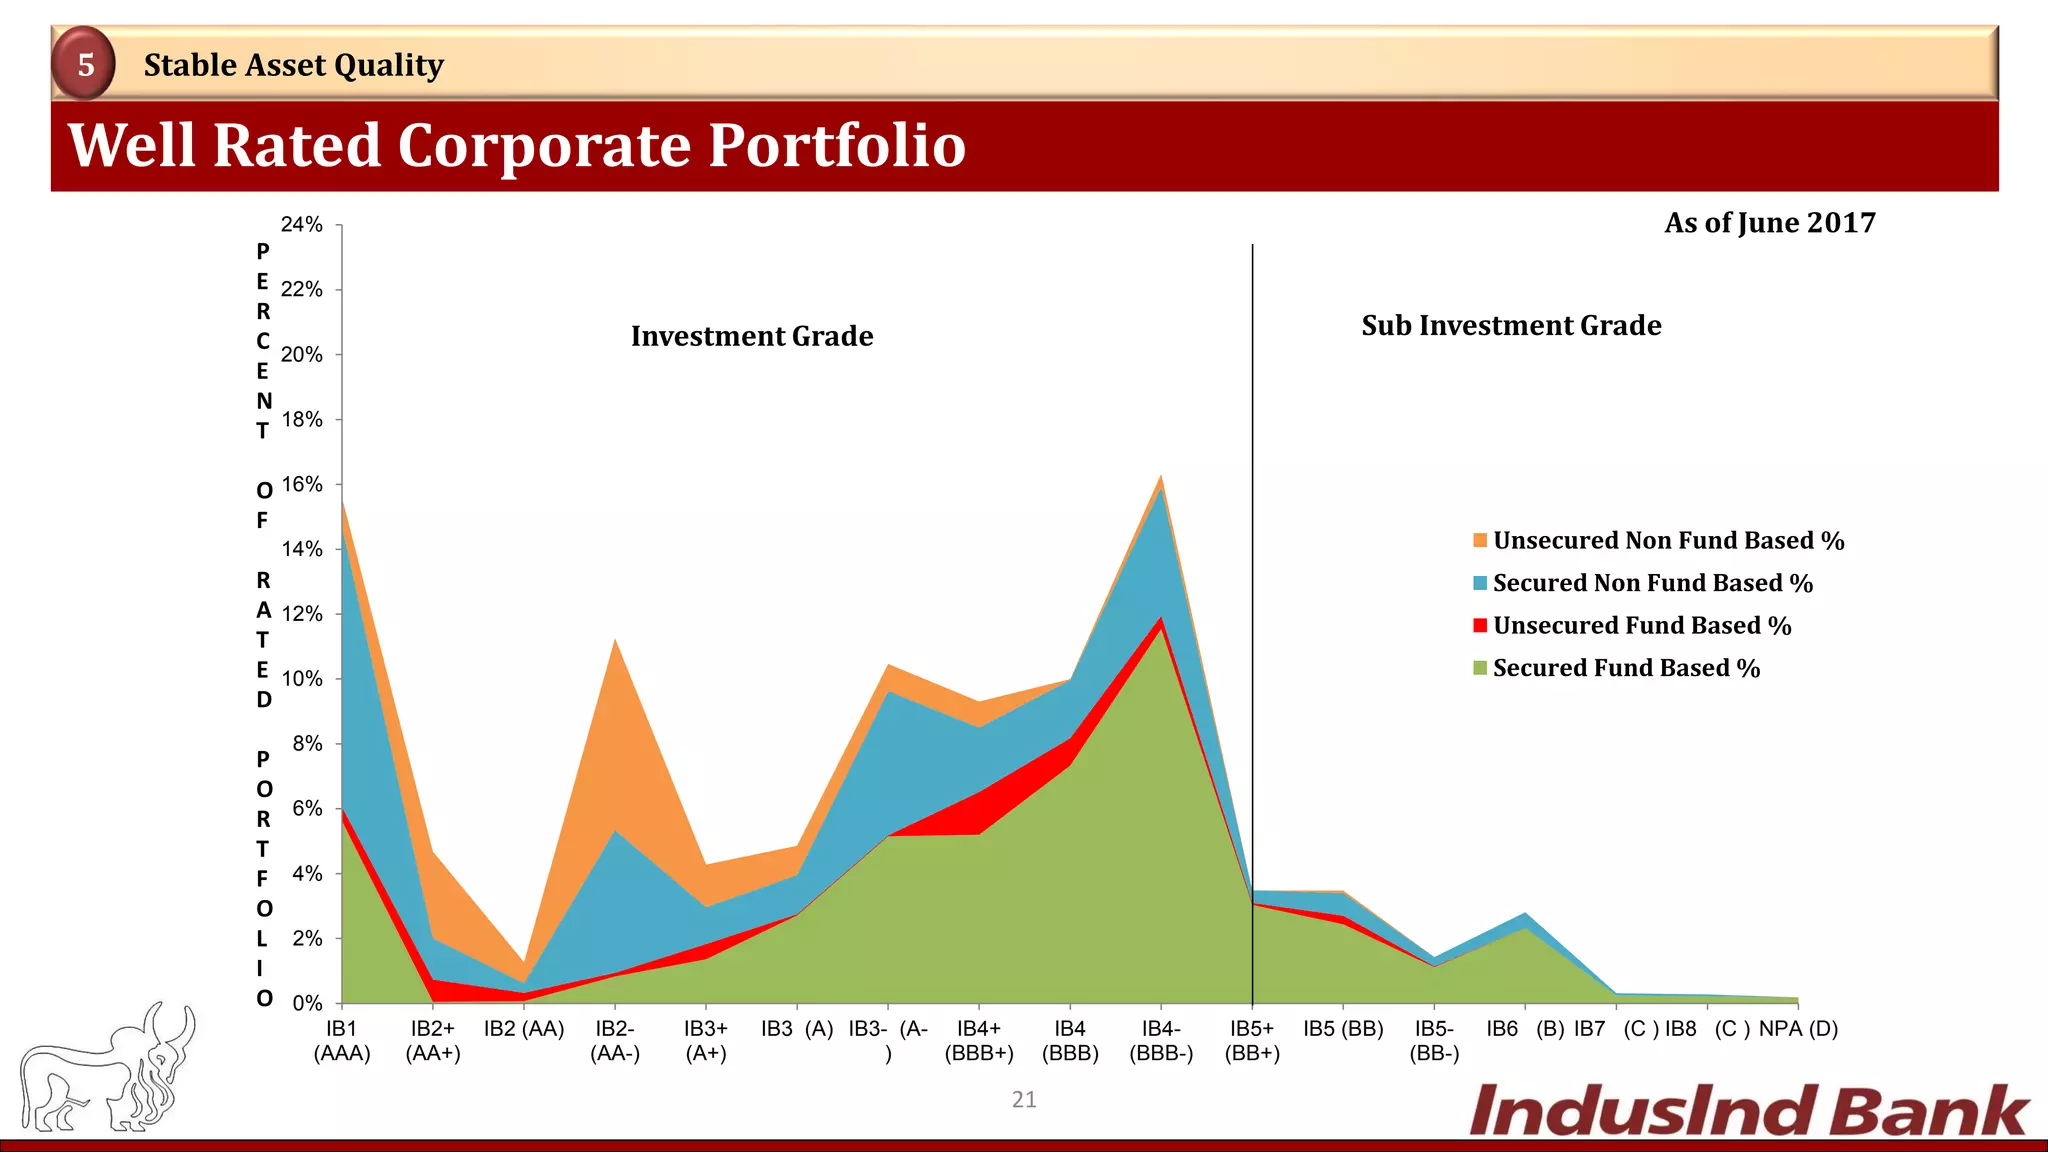
- The bank has a diversified loan book split between corporate/commercial banking (60%) and consumer finance (40%). It is focused on growing its liability and fee franchises.
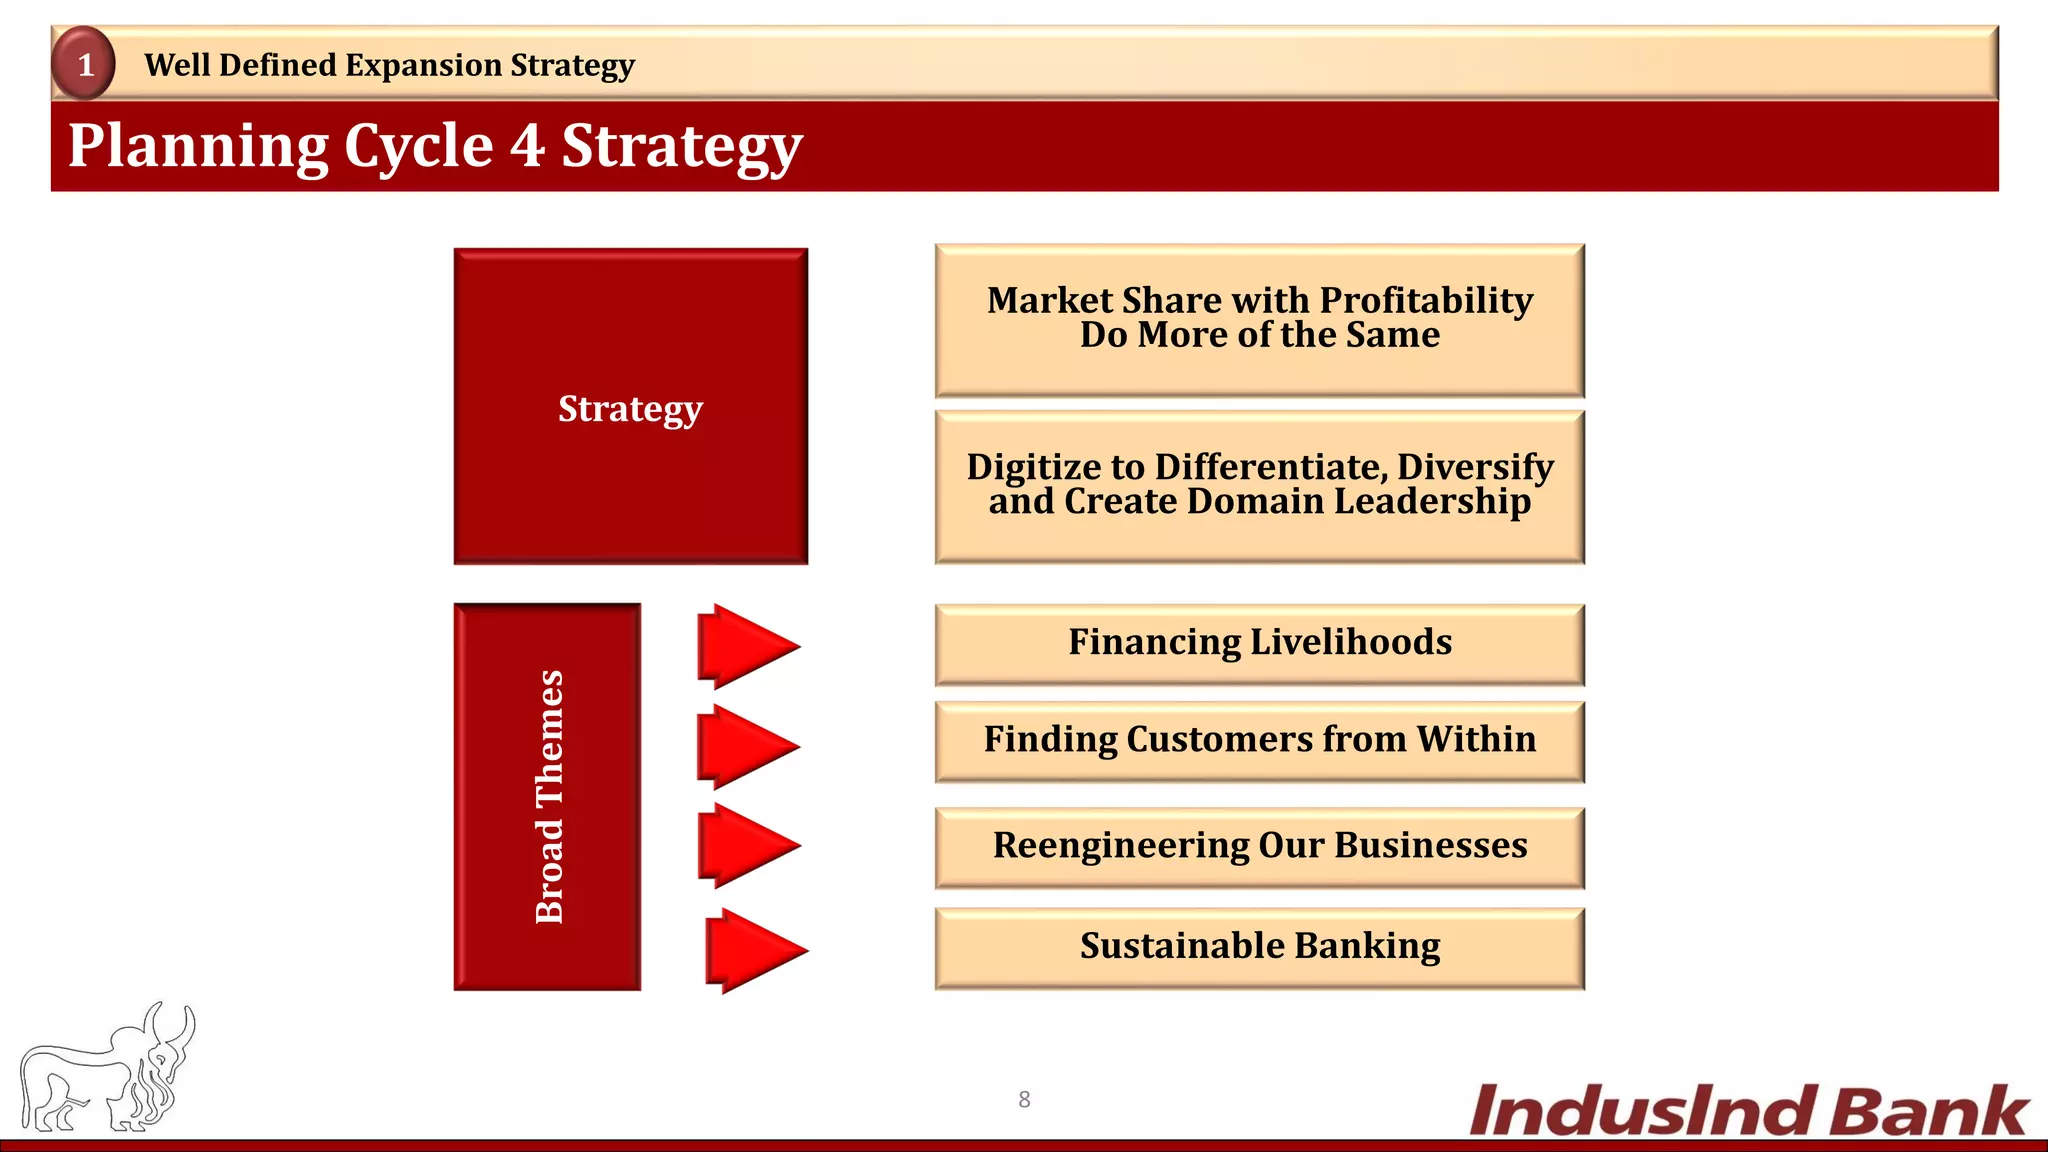
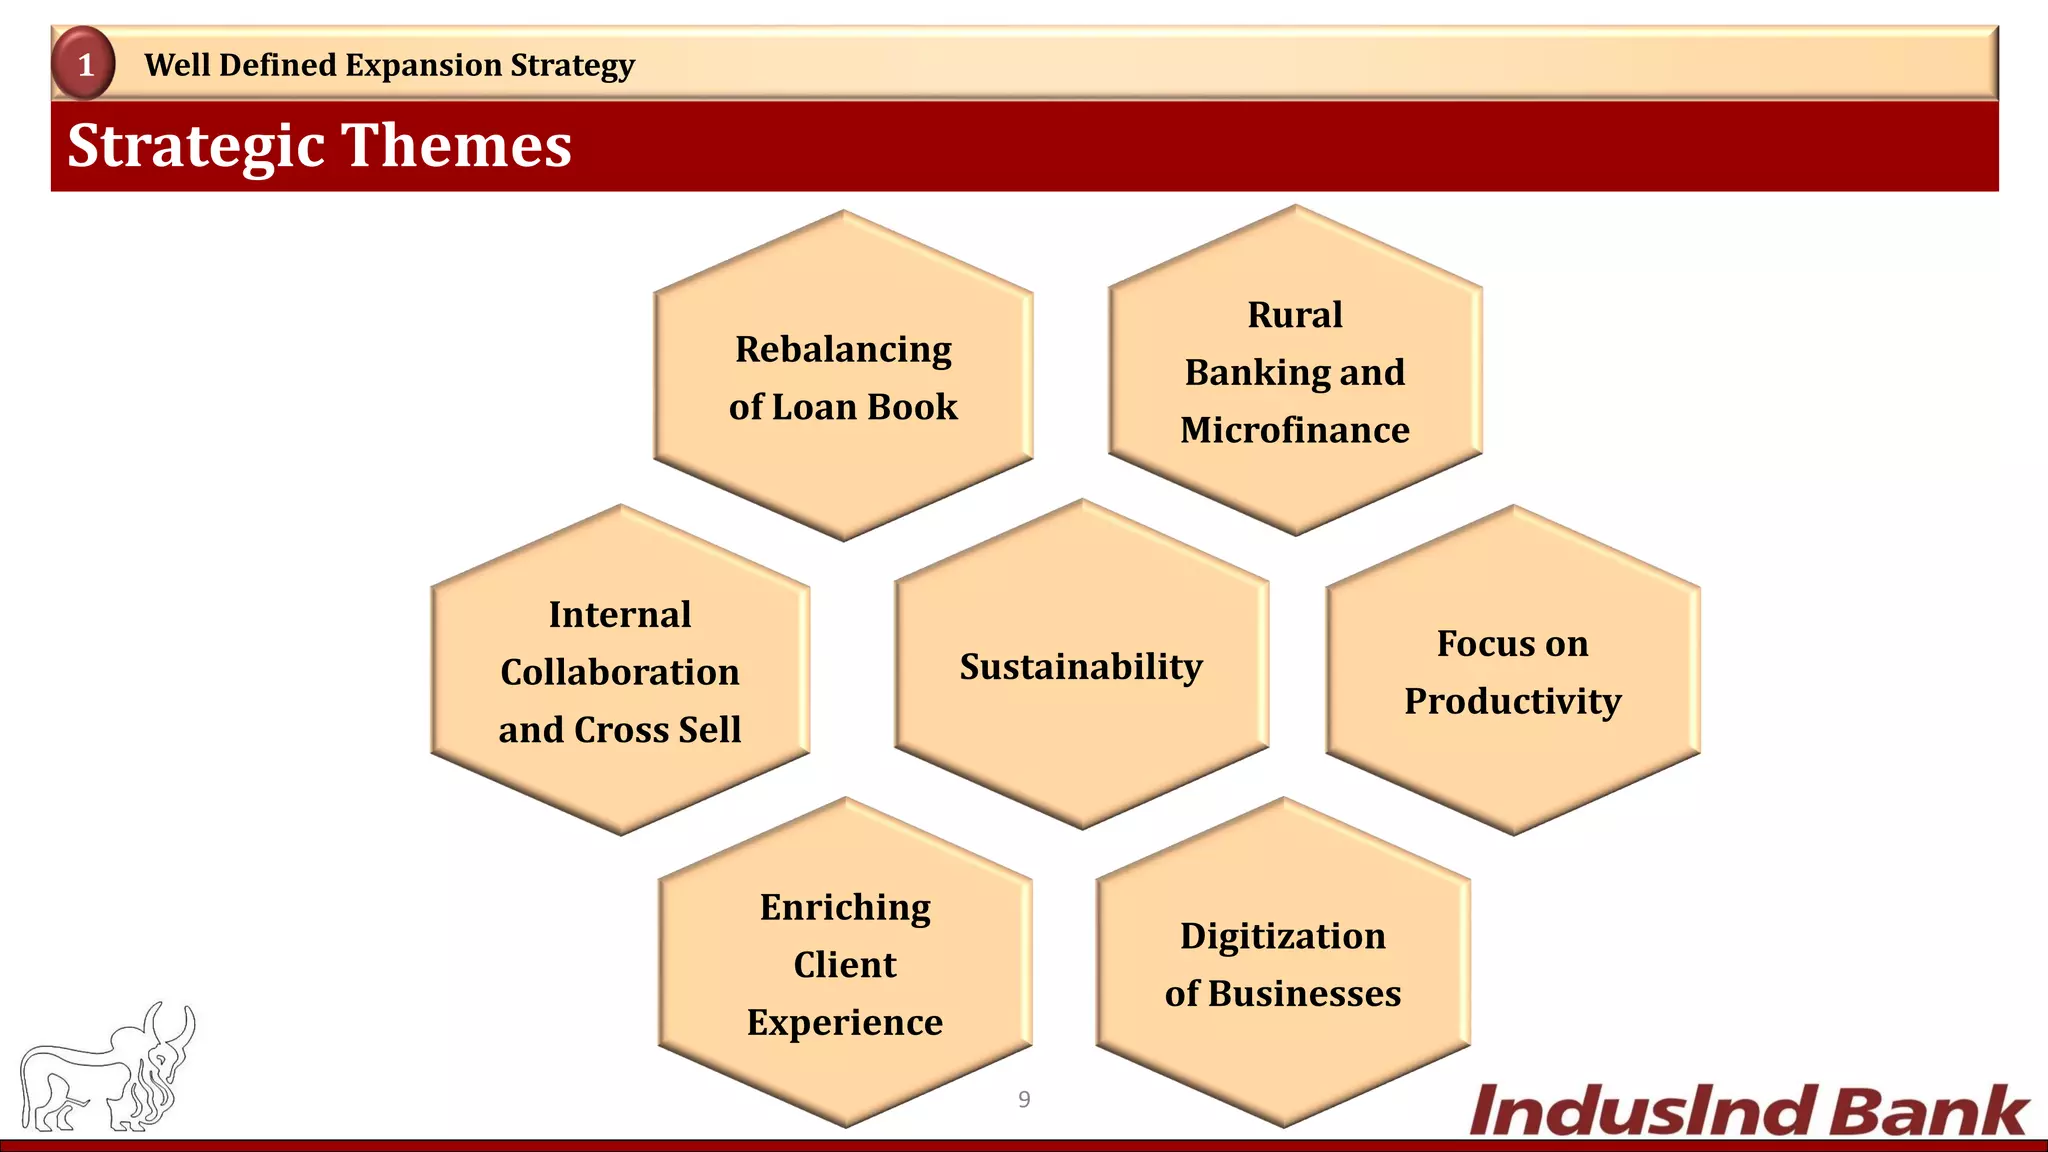
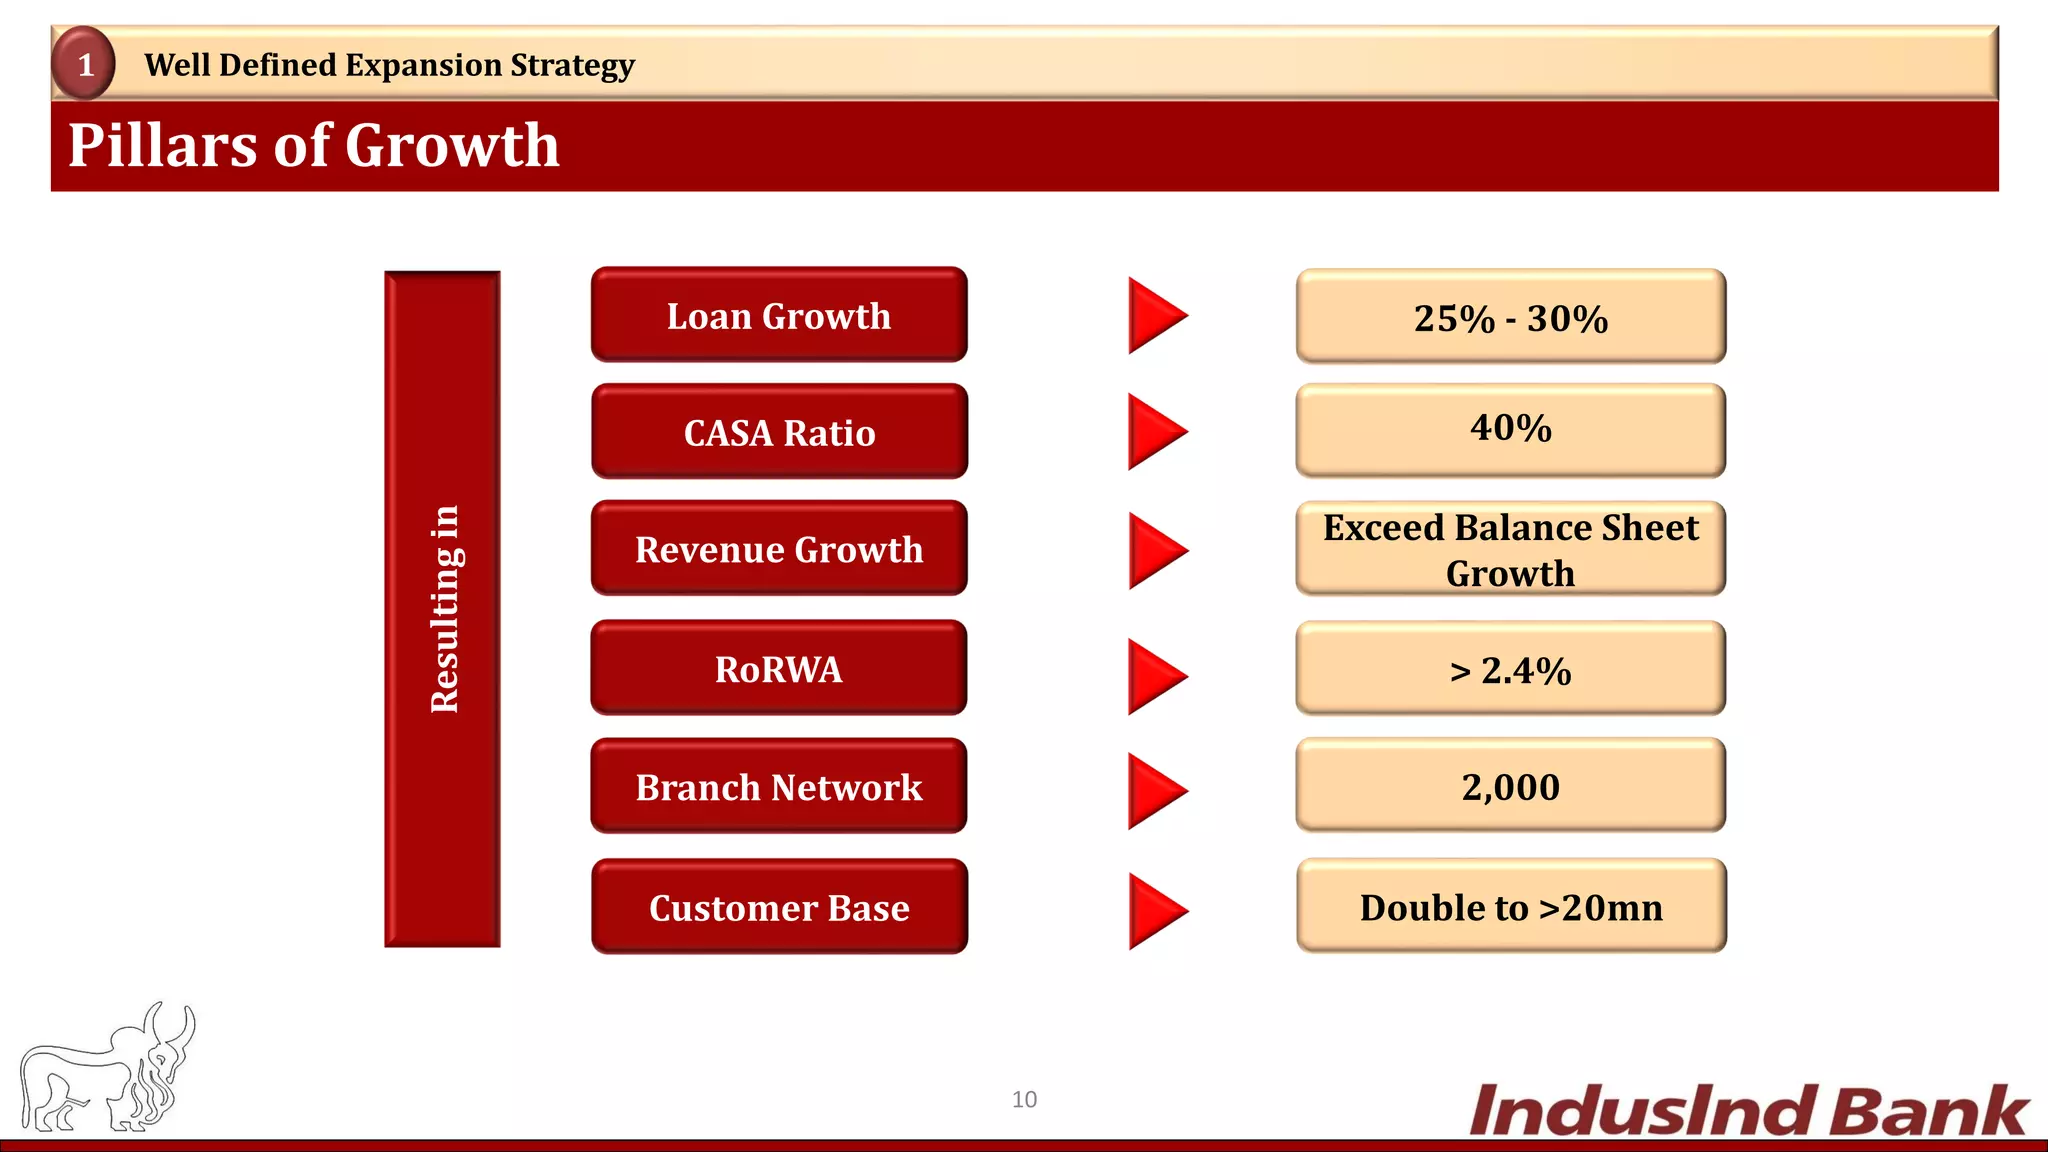
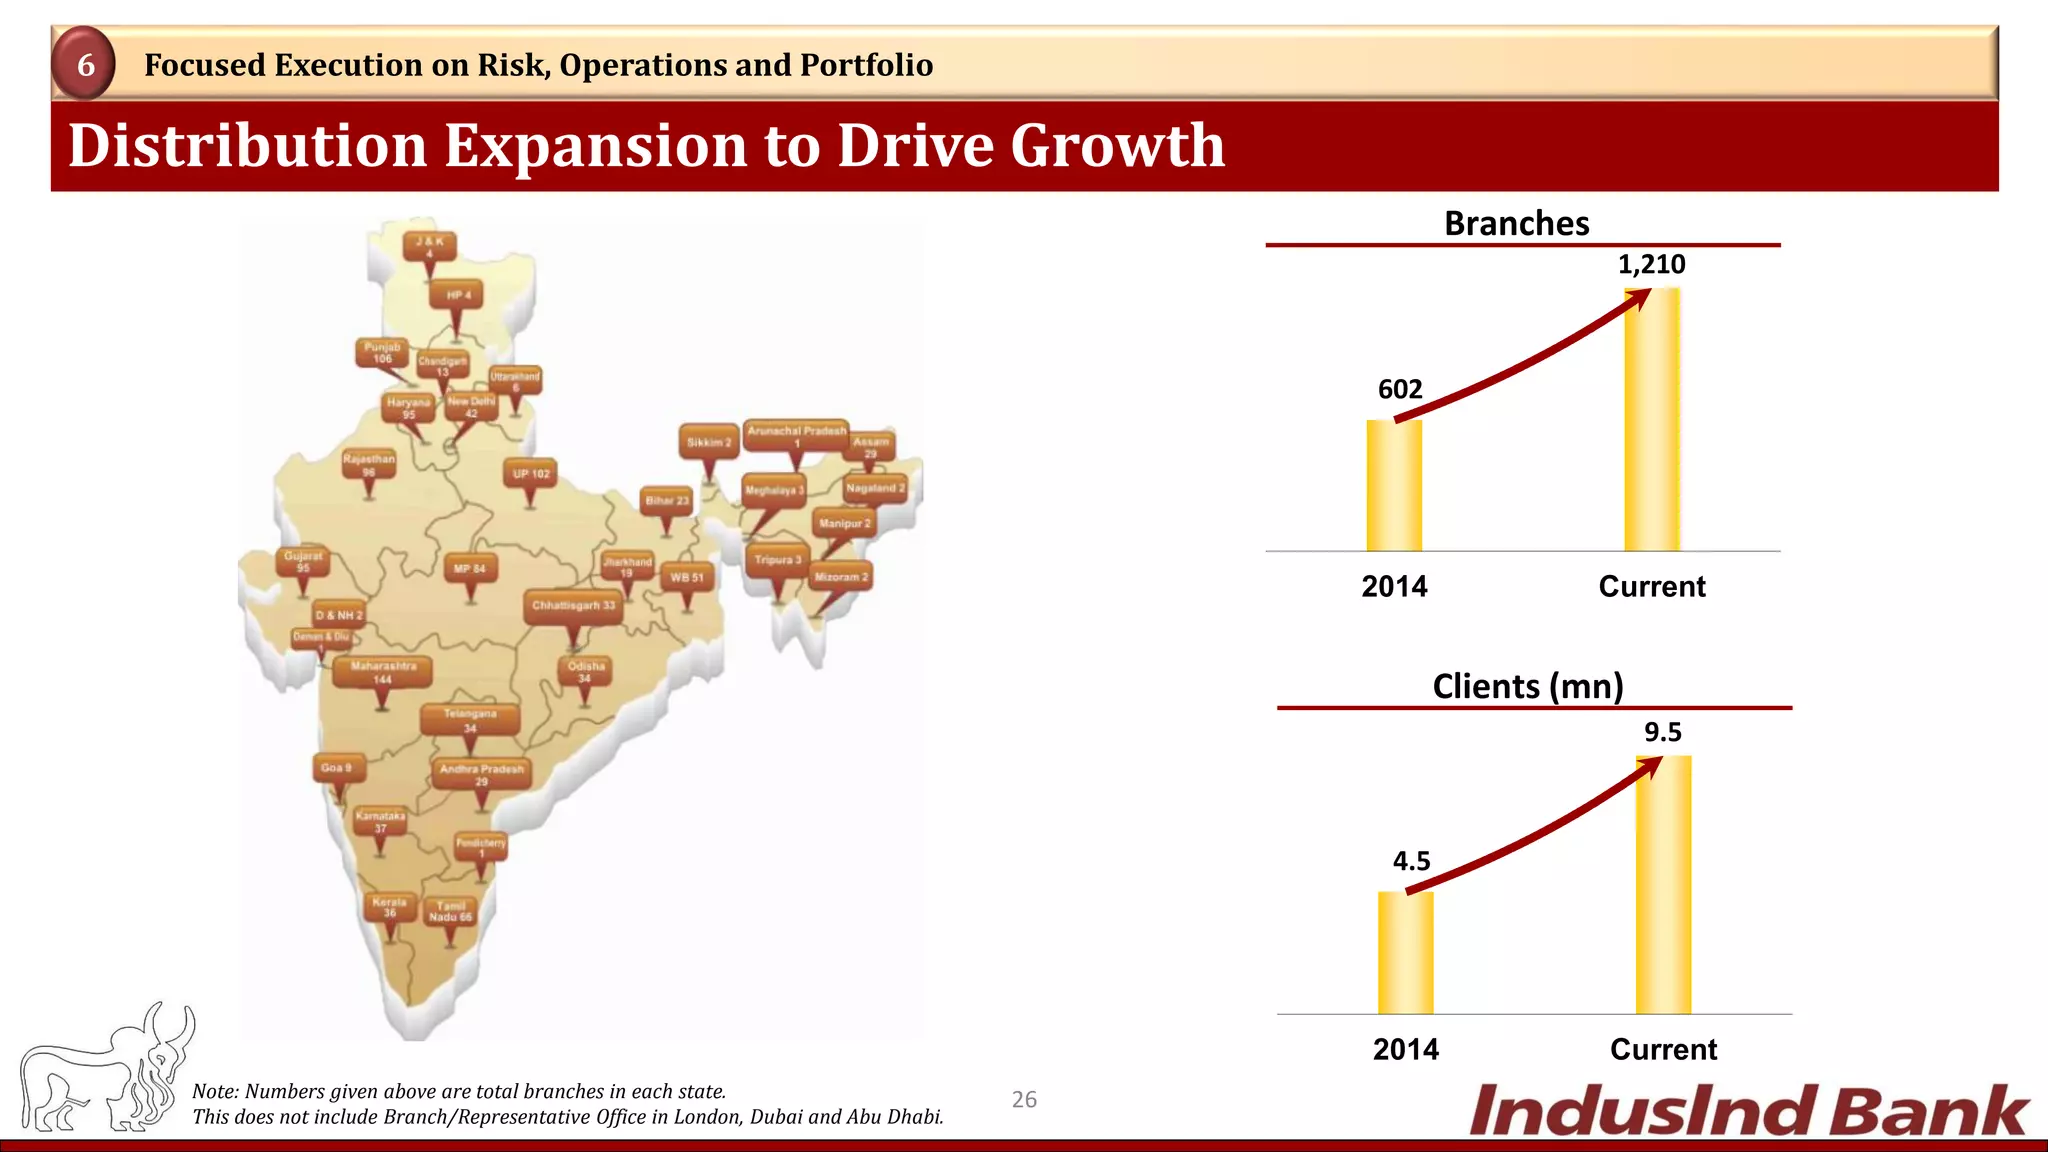
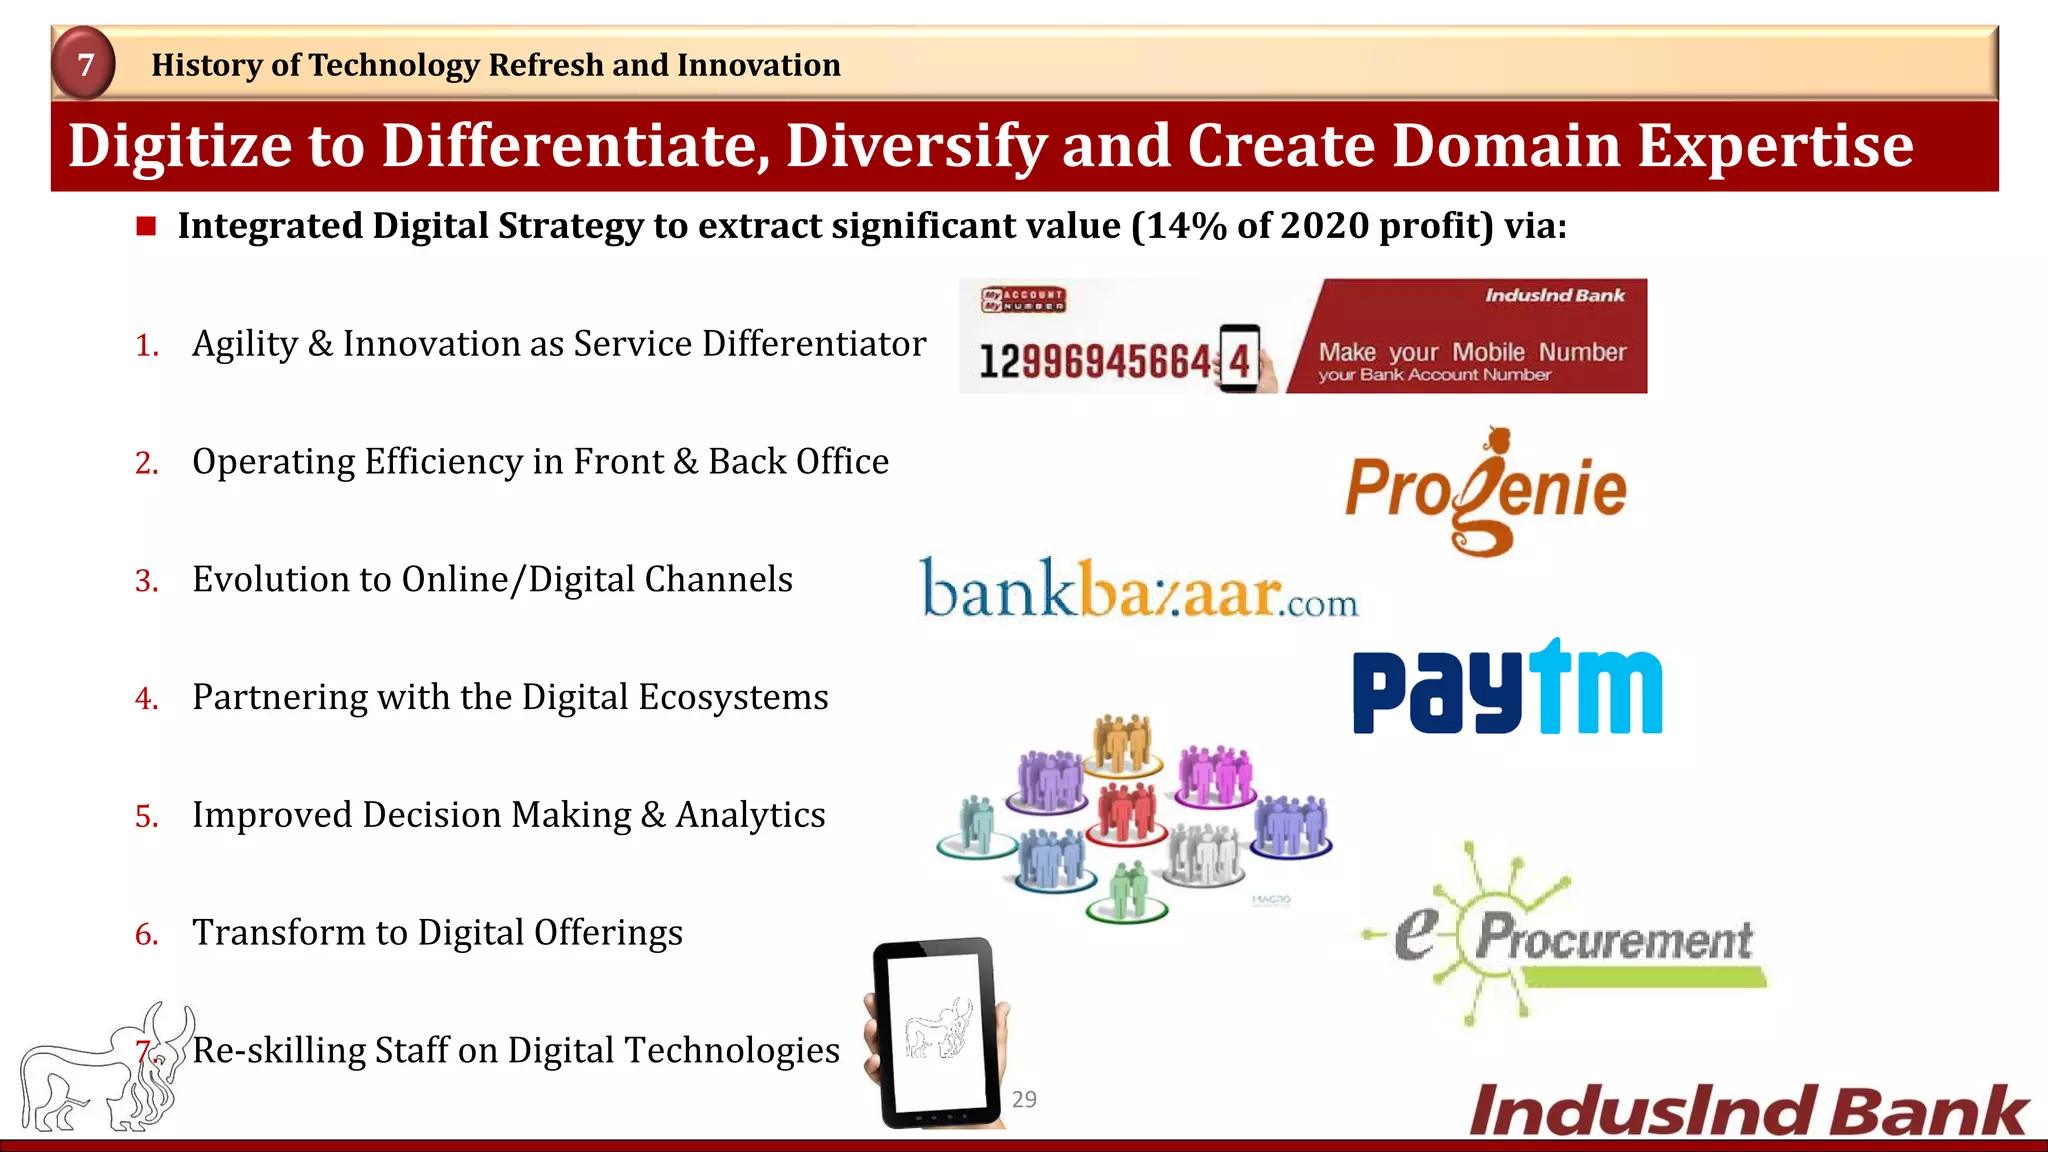
- Going forward, IndusInd Bank aims to double its customer base to over 20 million through initiatives like expanding its branch network, increasing digital capabilities, and financing more livelihood sectors.