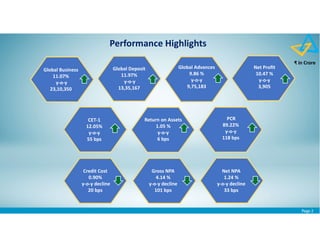
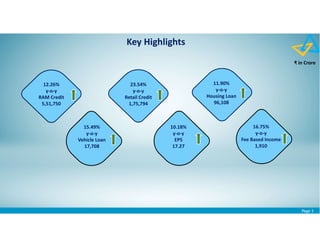
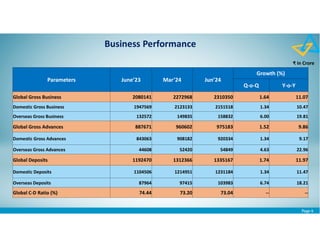
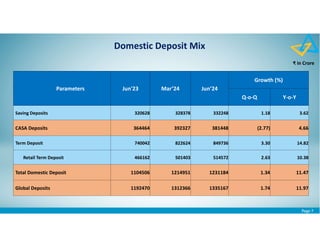
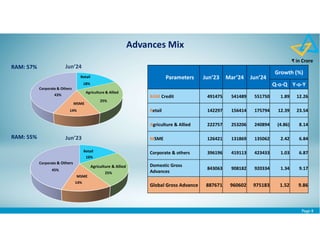
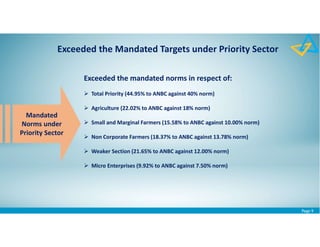
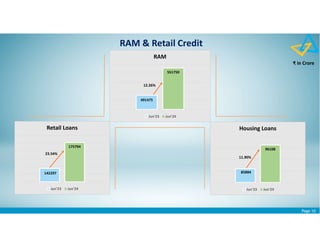
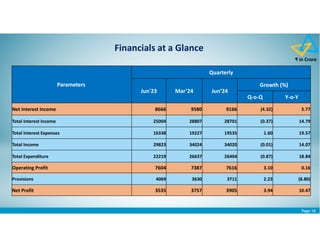
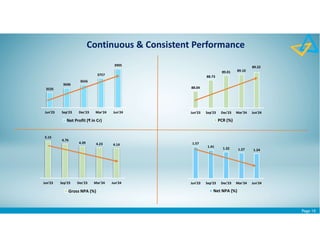
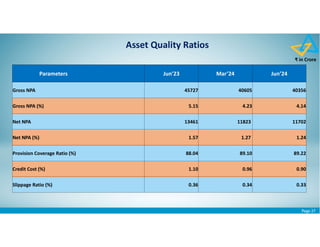
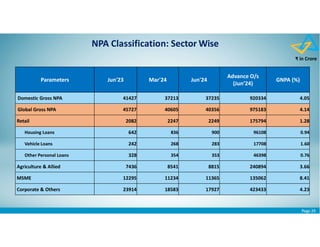
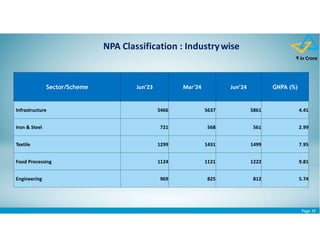
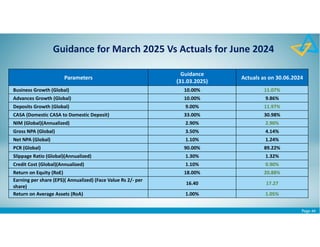
Page 1
Financial Results: Q1 (FY 2024-25) Driving Customer Delight
& Growth Digitally
Page 2
Performance Highlights
₹ in Crore
Global Business
11.07%
y-o-y
23,10,350
Global Deposit
11.97%
y-o-y
13,35,167
Global Advances
9.86 %
y-o-y
9,75,183
Net Profit
10.47 %
y-o-y
3,905
Return on Assets
1.05 %
y-o-y
6 bps
PCR
89.22%
y-o-y
118 bps
CET-1
12.05%
y-o-y
55 bps
Credit Cost
0.90%
y-o-y decline
20 bps
Gross NPA
4.14 %
y-o-y decline
101 bps
Net NPA
1.24 %
y-o-y decline
33 bps
Page 3
Key Highlights
12.26%
y-o-y
RAM Credit
5,51,750
23.54%
y-o-y
Retail Credit
1,75,794
11.90%
y-o-y
Housing Loan
96,108
15.49%
y-o-y
Vehicle Loan
17,708
10.18%
y-o-y
EPS
17.27
16.75%
y-o-y
Fee Based Income
1,910
₹ in Crore
Page 4
06-13
15-22
24-25
27-32
34-35
37-37
39-42
43-43
44-44
Contents
Business Performance
Financial Performance
Investments
Asset Quality
Capital & Shareholding
Environmental, Social & Governance
Distribution Network & Digital Footprint
Subsidiaries & Associates
Guidance for March 2025 Vs Actuals for June 2024
Page 5
Driving Customer Delight
& Growth Digitally
Business
Performance
Page 6
Business Performance
₹ in Crore
Parameters June’23 Mar’24 Jun’24
Growth (%)
Q-o-Q Y-o-Y
Global Gross Business 2080141 2272968 2310350 1.64 11.07
Domestic Gross Business 1947569 2123133 2151518 1.34 10.47
Overseas Gross Business 132572 149835 158832 6.00 19.81
Global Gross Advances 887671 960602 975183 1.52 9.86
Domestic Gross Advances 843063 908182 920334 1.34 9.17
Overseas Gross Advances 44608 52420 54849 4.63 22.96
Global Deposits 1192470 1312366 1335167 1.74 11.97
Domestic Deposits 1104506 1214951 1231184 1.34 11.47
Overseas Deposits 87964 97415 103983 6.74 18.21
Global C-D Ratio (%) 74.44 73.20 73.04 -- --
Page 7
Domestic Deposit Mix
₹ in Crore
Parameters Jun'23 Mar’24 Jun’24
Growth (%)
Q-o-Q Y-o-Y
Saving Deposits 320628 328378 332248 1.18 3.62
CASA Deposits 364464 392327 381448 (2.77) 4.66
Term Deposit 740042 822624 849736 3.30 14.82
Retail Term Deposit 466162 501403 514572 2.63 10.38
Total Domestic Deposit 1104506 1214951 1231184 1.34 11.47
Global Deposits 1192470 1312366 1335167 1.74 11.97
Page 8
RAM: 55%
RAM: 57%
Advances Mix
₹ in Crore
18%
25%
14%
43%
Retail
Agriculture & Allied
MSME
Corporate & Others
16%
25%
14%
45%
Retail
Agriculture & Allied
MSME
Corporate & Others
Jun’24
Jun’23
Parameters Jun’23 Mar’24 Jun’24
Growth (%)
Q-o-Q Y-o-Y
RAM Credit 491475 541489 551750 1.89 12.26
Retail 142297 156414 175794 12.39 23.54
Agriculture & Allied 222757 253206 240894 (4.86) 8.14
MSME 126421 131869 135062 2.42 6.84
Corporate & others 396196 419113 423433 1.03 6.87
Domestic Gross
Advances
843063 908182 920334 1.34 9.17
Global Gross Advance 887671 960602 975183 1.52 9.86
Page 9
Exceeded the Mandated Targets under Priority Sector
Exceeded the mandated norms in respect of:
 Total Priority (44.95% to ANBC against 40% norm)
 Agriculture (22.02% to ANBC against 18% norm)
 Small and Marginal Farmers (15.58% to ANBC against 10.00% norm)
 Non Corporate Farmers (18.37% to ANBC against 13.78% norm)
 Weaker Section (21.65% to ANBC against 12.00% norm)
 Micro Enterprises (9.92% to ANBC against 7.50% norm)
Mandated
Norms under
Priority Sector
Page 10
RAM & Retail Credit
85884
96108
Housing Loans
Jun'23 Jun'24
11.90%
₹ in Crore
491475
551750
RAM
Jun'23 Jun'24
12.26%
142297
175794
Retail Loans
Jun'23 Jun'24
23.54%
Page 11
Industry Credit
₹ in Crore
Sector/Scheme Jun'23 Mar’24 Jun’24
Growth (%)
Q-o-Q Y-o-Y
Infrastructure 115220 129411 132942 2.73 15.38
NBFC 144804 131974 118529 (10.19) (18.15)
Textile 17823 18353 18863 2.78 5.84
Iron & Steel 15564 14991 18767 25.19 20.58
Commercial Real Estate 19970 20841 22890 9.83 14.62
Food Processing 12097 12396 12451 0.44 2.92
Engineering 13590 13907 14135 1.63 4.01
Petroleum, Coal products & Nuclear Fuels 11670 10678 10291 (3.62) (11.82)
Construction 9670 8903 9036 1.49 (6.56)
Chemicals & Chemical Products 7551 10909 11383 4.34 50.74
Page 12
₹ in Crore
Rating Profile
External Rating - Wise Distribution of Domestic Advances above ₹ 25 crore
(% of Total rated loan book above ₹ 25 crore)
Jun’23 Mar’24 Jun’24
External Rating Outstanding % Share Outstanding % Share Outstanding % Share
A and above 220189 81 222192 80 211925 78
BBB 27224 10 30897 11 34681 13
BB and below 25365 9 25135 9 26705 9
Total 272778 100 278224 100 273311 100
PSU PSE Customers (Jun’24)
Central Govt. Guarantee State Govt. Guarantee
18528 54683
Page 13
Rating Profile
₹ in Crore
Rating Profile of Standard NBFC Domestic Exposure
Jun’23 Mar’24 Jun’24
External Rating Exposure % Share Exposure % Share Exposure % Share
A and above 135871 99 129893 99 136866 99
BBB 366
1
130
1
74
1
BB and below 26 14 46
Total 136263 100 130037 100 136986 100
Page 14
Driving Customer Delight
& Growth Digitally
Financial
Performance
Page 15
₹ in Crore
Total Income
Parameters
Quarterly
Jun'23 Mar’24 Jun'24
Growth (%)
Q-o-Q Y-o-Y
Interest Income 25004 28807 28701 (0.37) 14.79
Interest on Advances 18064 20863 20778 (0.41) 15.02
Interest on Investments 5349 5902 6078 2.98 13.63
Other Interest Income 1591 2042 1845 (9.65) 15.96
Non-Interest Income 4819 5217 5319 1.96 10.38
Total Income 29823 34024 34020 (0.01) 14.07
Page 16
₹ in Crore
Non-Interest Income
Parameters
Quarterly
Jun'23 Mar’24 Jun'24
Growth(%)
Q-o-Q Y-o-Y
Fee Based Income 1636 1941 1910 (1.60) 16.75
Commission Exchange & Brokerage 263 437 353 (19.22) 34.22
Service Charges 812 886 798 (9.93) (1.72)
Miscellaneous 561 618 759 22.82 35.29
Treasury Income 536 865 503 (41.85) (6.16)
Profit on Sale of Investments 294 663 349 (47.36) 18.71
Profit on Exchange Transactions 236 177 151 (14.69) (36.02)
Dividend Income 6 25 3 (88.00) (50.00)
Recoveries in Written Off A/cs 796 1900 1158 (39.05) 45.48
Other Receipts( PSLC & Others) 1851 511 1748 242.07 (5.56)
Total Non-Interest Income 4819 5217 5319 1.96 10.38
Page 17
₹ in Crore
Total Expenses
Parameters
Quarterly
Jun'23 Mar’24 Jun’24
Growth (%)
Q-o-Q Y-o-Y
Interest Expenses 16338 19227 19535 1.60 19.57
Interest Paid on Deposits 15043 17714 18352 3.60 22.00
Other Interests 1295 1513 1183 (21.81) (8.65)
Operating Expenses 5881 7410 6869 (7.30) 16.80
Staff Cost 3651 4458 4230 (5.11) 15.86
Other Operating Expenses 2230 2952 2639 (10.60) 18.34
Total Expenses 22219 26637 26404 (0.87) 18.84
Page 18
₹ in Crore
Financials at a Glance
Parameters
Quarterly
Jun'23 Mar’24 Jun’24
Growth (%)
Q-o-Q Y-o-Y
Net Interest Income 8666 9580 9166 (4.32) 5.77
Total Interest Income 25004 28807 28701 (0.37) 14.79
Total Interest Expenses 16338 19227 19535 1.60 19.57
Total Income 29823 34024 34020 (0.01) 14.07
Total Expenditure 22219 26637 26404 (0.87) 18.84
Operating Profit 7604 7387 7616 3.10 0.16
Provisions 4069 3630 3711 2.23 (8.80)
Net Profit 3535 3757 3905 3.94 10.47
Page 19
3535
3606
3656
3757
3905
Jun'23 Sep'23 Dec'23 Mar'24 Jun'24
Net Profit (₹ in Cr)
Continuous & Consistent Performance
1.57
1.41 1.32 1.27 1.24
Jun'23 Sep'23 Dec'23 Mar'24 Jun'24
Net NPA (%)
5.15
4.76
4.39 4.23 4.14
Jun'23 Sep'23 Dec'23 Mar'24 Jun'24
Gross NPA (%)
88.04
88.73
89.01 89.10
89.22
Jun'23 Sep'23 Dec'23 Mar'24 Jun'24
PCR (%)
Page 20
₹ in Crore
Provisions
Parameters
Quarterly
Jun'23 Mar’24 Jun’24
Growth (%)
Q-o-Q Y-o-Y
Total Provision 4069 3630 3711 2.23 (8.80)
NPAs 2417 2280 2171 (4.78) (10.18)
Standard Asset 3 44 21 (52.27) 600.00
Non Performing Investment 332 295 (125) ----- -----
Income Tax 1350 1149 1428 24.28 5.78
Others (33) (138) 216 ----- -----
Page 21
(%)
Key Ratios
Ratios
Jun’23 Mar’24 Jun’24
Quarterly Cumulative Quarterly Cumulative Quarterly Cumulative
Return on Assets 0.99 0.99 1.03 1.01 1.05 1.05
Return on Net-worth 22.95 22.95 21.18 22.06 20.88 20.88
Cost to Income 43.61 43.61 50.08 47.03 47.42 47.42
CD Ratio 74.44 74.44 73.20 73.20 73.04 73.04
EPS (Annualized)* 78.37 78.37 83.30 80.23 17.27 17.27
Book Value (In ₹)* 351.61 351.61 395.94 395.94 86.29 86.29
NIM 3.05 3.05 3.07 3.05 2.90 2.90
*Figures for June 2023 & March 2024 quarter is on Face Value of Rs 10/- per share whereas figures for June 2024 quarter is on Face
Value of Rs 2/- per share.
Page 22
4.76
5.00
5.25
Jun'23 Mar'24 Jun'24
Cost Of Funds (%)
7.28
7.54
7.72
Jun'23 Mar'24 Jun'24
Yield on Funds(%)
6.85
6.91
6.94
Jun'23 Mar'24 Jun'24
Yield on Investments(%)
3.05 3.05
2.90
Jun'23 Mar'24 Jun'24
NIM(%)
5.22
5.50
5.70
Jun'23 Mar'24 Jun'24
Cost Of Deposits (%)
8.43
8.71
8.66
Jun'23 Mar'24 Jun'24
Yield on
Advances(%)
Key Ratios
Page 23
INVESTMENTS
Driving Customer Delight
& Growth Digitally
Page 24
₹ in Crore
Investment Portfolio
Sl. No Parameters Jun'23 Mar'24 Jun'24
1 Domestic Investments 334955 360836 373591
(a) SLR 298393 324154 324203
(b) Non SLR 36562 36682 49388
SLR as % to Dom. Investments 89.08 89.83 86.78
(i) Held To Maturity (HTM) 275423 290652 298077
(ii) Available For Sale (AFS) 58692 69748 54730
(iii) Fair Value Through Profit & Loss (FVTPL) (including HFT) 840 436 19253
(iv) Subsidiaries & Joint Ventures -- -- 1531
2 Investment by Overseas Branches 1008 2715 1911
3 Total Gross Investment (1+2) 335963 363551 375502
HTM To Investment (%) 82.23 80.55 79.79
Page 25
Parameters Jun’23 Mar’24 Jun’24
% Share
(Jun'24)
Y-o-Y Variation
Amount %
PSU Bonds 3503 3588 4138 8.38 635 18.13
Corporate and Other Bonds 5793 7113 7434 15.05 1641 28.33
Special Govt. Sec excl. Recap Bonds 1793 633 633 1.28 (1160) (64.70)
CG Recap. Bond 18238 18238 18238 36.93 0 0.00
Share of PSU/Corporate/Others 4387 4136 5342 10.82 955 21.77
Venture Capital Fund 366 370 380 0.77 14 3.83
Regional Rural Bank 333 287 287 0.58 (46) (13.81)
Security Receipts 648 1108 1041 2.11 393 60.65
Subsidiaries JV 763 763 1244 2.52 481 63.04
Other 738 446 10651 21.57 9913 1343.22
Total Non SLR Investment 36562 36682 49388 100.00 12826 35.08
₹ in Crore
Non SLR Portfolio
Page 26
Driving Customer Delight
& Growth Digitally
Asset Quality
Page 27
₹ in Crore
Asset Quality Ratios
Parameters Jun’23 Mar’24 Jun’24
Gross NPA 45727 40605 40356
Gross NPA (%) 5.15 4.23 4.14
Net NPA 13461 11823 11702
Net NPA (%) 1.57 1.27 1.24
Provision Coverage Ratio (%) 88.04 89.10 89.22
Credit Cost (%) 1.10 0.96 0.90
Slippage Ratio (%) 0.36 0.34 0.33
Page 28
₹ in Crore
Parameters Jun’23 Mar’24 Jun’24
NPA as at the beginning of the period 46160 41722 40605
Cash Recovery towards Book Liability(i) 1127 929 780
Up-gradation (ii) 800 520 495
Write Off (iii) 1934 3068 2311
Total Reduction(i+ii+iii) 3861 4517 3586
Fresh Addition 3428 3400 3337
-Fresh Slippages 3188 3082 3015
-Debits in existing NPA A/c 240 318 322
Gross NPAs at end of the period 45727 40605 40356
Eligible Deductions incl. Provisions 32266 28782 28654
Net NPAs 13461 11823 11702
Recoveries in Written Off A/c 891 2232 1371
Total Cash recovery including Recovery in Written off A/cs 2018 3161 2151
Movement of NPA
Page 29
₹ in Crore
NPA Classification: Sector Wise
Parameters Jun'23 Mar'24 Jun'24
Advance O/s
(Jun’24)
GNPA (%)
Domestic Gross NPA 41427 37213 37235 920334 4.05
Global Gross NPA 45727 40605 40356 975183 4.14
Retail 2082 2247 2249 175794 1.28
Housing Loans 642 836 900 96108 0.94
Vehicle Loans 242 268 283 17708 1.60
Other Personal Loans 328 354 353 46398 0.76
Agriculture & Allied 7436 8541 8815 240894 3.66
MSME 12295 11234 11365 135062 8.41
Corporate & Others 23914 18583 17927 423433 4.23
Page 30
₹ in Crore
NPA Classification : Industrywise
Sector/Scheme Jun’23 Mar’24 Jun’24 GNPA (%)
Infrastructure 5466 5637 5861 4.41
Iron & Steel 721 568 561 2.99
Textile 1299 1431 1499 7.95
Food Processing 1124 1121 1222 9.81
Engineering 969 825 812 5.74
Page 31
₹ in Crore
Special Mention Accounts (SMA)
SMA Position of the Bank (₹ 5 Cr and above)
Jun’23 Mar’24 Jun’24
Parameters
No of
Accounts
Outstanding
% to Gross
Advances
No of
Accounts
Outstanding
% to Gross
Advances
No of
Accounts
Outstanding
% to Gross
Advances
SMA 2 237 3367 0.38 141 3897 0.40 167 4134 0.42
SMA 1 72 3482 0.39 100 1229 0.13 65 881 0.09
TOTAL SMA 1 & 2 309 6849 0.77 241 5126 0.53 232 5015 0.51
SMA 0 172 3045 0.34 129 1533 0.16 148 6033 0.62
TOTAL 481 9894 1.11 370 6659 0.69 380 11048 1.13
Page 32
NCLT Resolution Status
Accounts referred to NCLT
Parameters
Jun’23 Jun’24
No of
Accounts
Book
Liability
Provision
Provision
Coverage
No of
Accounts
Book
Liability
Provision
Provision
Coverage
1st List - RBI 4 1106 1106 100% 4 1094 1094 100%
2nd List – RBI 11 5289 5289 100% 9 4676 4676 100%
Total RBI 1 & 2 15 6395 6395 100% 13 5770 5770 100%
Others 356 34801 33382 96% 358 31759 30037 95%
Total 371 41196 39777 97% 371 37529 35807 95%
Cumulative Recovery
Jun’23 Jun’24
(FY 2024-25)
No of A/c Amount No of A/c Amount No of A/c Amount
Through Resolution 12 59 12 108 12 59
Through Liquidation 26 55 26 52 26 55
Through 12A Settlement 1 16 1 2 1 16
Through PPIRP 1 1 0 0 1 1
Through Other Mode under NCLT 5 5 2 1 5 5
Total 45 136 41 163 45 136
₹ in Crore
Page 33
Driving Customer Delight
& Growth Digitally
Capital &
Shareholding
Page 34
₹ in Crore
Capital Funds (Basel III)
Parameters Jun’23 Mar’24 Jun’24
Tier I 80982 93368 98104
Common Equity 68561 77529 82265
Additional Tier I 12421 15839 15839
Tier II 15878 15599 13779
Total (Tier I+II) 96860 108967 111883
Risk-weighted Assets 596279 669257 682900
Gross Advances 887671 960602 975183
RWA to Gross Advances (%) 67.17 69.67 70.03
Tier I (%) 13.58 13.95 14.37
Common Equity (%) 11.50 11.58 12.05
Additional Tier I (%) 2.08 2.37 2.32
Tier II (%) 2.66 2.33 2.01
Total (Tier I+II) % 16.24 16.28 16.38
11.50 11.58 12.05
2.08 2.37
2.32
2.66 2.33 2.01
Jun'23 Mar'24 Jun'24
CRAR (%)
CET AT I TIER II
16.24 16.28 16.38
Page 35
Government of India, 62.93
Insurance Companies, 7.06
Mutual Funds, 3.49
FIIs/FPIs, 11.91
Resident Individuals, 11.53
Staff, 0.63 Others, 2.45
Shareholding Pattern as on June 30th,2024
Year ended FII/FPIs
holding (%)
Mar’22 8.48
Mar’23 8.95
Mar’24 10.57
Page 36
Driving Customer Delight
& Growth Digitally
Environmental, Social & Governance
Page 37
Environmental, Social & Governance (ESG) Practices
 Bank is impacting the Society by engaging in
helping and uplifting the underserved
communities through non profit organizations viz
 Canara Centenary Rural Development Trust
 Canara Financial Advisory Trust
 Canara Golden Jubilee Education Fund
 Canara Relief and Welfare Society
 Financial Literacy Centres (FLC)
 Rural Self Employment Training Institutes (RSETIs)
 Rural Development & Self Employment Training
Institutes ( RUDSETIs.
 During quarter ending June 2024, Bank has
conducted 1,867 awareness programs and 576
training programs through its RSETIs and
RUDSETIs, benefiting 17,000 plus candidates to
upgrade their skill sets.
 Bank has setup 115 Financial Literacy Centres
(FLCs) through which 5,521 camps have been
conducted and 3,46,747 persons were extended
Financial Literacy in June quarter.
 To promote diversity , equity & inclusive growth,
Bank has in place a Women Empowerment
Committee named as ‘Advaita’ to support the
women employee fraternity of the Bank.
 As part of Green initiatives, Bank has undertaken:
 Increased usage of LED light, BEE rated AC units
 Gradual phasing out of DG sets
 Installed rooftop Solar Power system in 103 Bank
owned properties and 10 more underway, with a
total capacity of 3353 KWp.
 EV charging station has been commissioned in
Head Office Building for charging of staff’s E-
Vehicles.
 Canara Institute of Bank Management, Manipal
was certified with Silver rating under IGBC Green
Campus Certification system.
 Bank is having a significant portfolio under
sustainable finance which includes Renewable
Energy Projects, Compressed Biogas & Energy
Conservation scheme, Solar Pump scheme under
PM-KUSUM, Roof Top Solar (RTS) for residential
sector with subsidy, Canara Green Wheels scheme
for E vehicles.
 Scope 1 & Scope 2 emissions of the bank accounts
for a total of 35296.13 tCO2 and 195643.45 tCO2
respectively for the financial year 2023-24.
 Bank has fixed the Carbon Footprint Budget for its
Employees’ official Air travel for the FY 2024-25.
 For the Bank’s journey towards Sustainability,
Bank has in place:
 Board approved ESG Policy.
 Green Deposit Policy & Lending Framework.
 ESG Statement demonstrating the Bank’s
commitment, initiatives & actions built around
its Seven Founding Principles in line with the
ESG concept aligning with the United Nation’s
Sustainable Development Goals (SDGs).
 Published its second Business Responsibility &
Sustainability Reporting(BRSR) report as part of
Annual Report for FY 2023-24.
 Bank is having a Chief Ethics Officer and an
exclusive ‘Ethics Section’ is in place to oversee
the implementation of business ethics in the
organization.
Environmental Social Governance
Page 38
Driving Customer Delight
& Growth Digitally
Distribution Network
Page 39
Urban
1914
20%
Metro
1843
19%
Semi-Urban
2760
29%
Rural
3106
32%
Presence across Urban & Rural areas
Jun’24 4 International
Branches
• New York
• London
• Dubai
• IBU, Gift City, Gujarat
Distribution Network
Parameters Jun'23 Mar'24 Jun'24
General Branches(a) 8865 8984 8997
Specialised Branches(b) 788 620 626
Total Domestic Branches(a+b) 9653 9604 9623
Overseas Branches 3 4 4
BC Points 13427 13167 13167
Total Banking Outlets 23083 22775 22794
ATM 10683 10209 10014
Recycler 1431 1946 2242
Page 40
Digital Footprint
Driving Customer Delight
& Growth Digitally
Page 41
142.42
207.68
JUN'23 JUN'24
MeitY Digital Transactions( Nos in
Crore)
Digital Footprint
5.24
5.74
JUN'23 JUN'24
Debit Card Outstanding (Nos in
Crores)
2.52
2.67
JUN'23 JUN'24
Internet Banking Registrations (Nos in
Crores)
1.78
2.34
JUN'23 JUN'24
Mobile Banking Registrations
(Nos in Crores)
2.19
2.95
JUN'23 JUN'24
UPI Registrations (Nos in
Crores)
0.62
0.78
JUN'23 JUN'24
PoS (No in Lakhs)
5.37
JUN'24
CBDC Registrations
(Nos in Lakhs)
385.36
530.92
JUN'23 JUN'24
E-Transactions (Nos in Crores)
6.61
9.07
JUN'23 JUN'24
Credit Card ( No in Lakhs)
Page 42
New Digital Initiatives
Pre-Approved Personal Loan product up to Rs.10.00 Lakh to existing customers (Canara SB Premium
Payroll Customers) of our Bank through Straight-through-Processing (STP) Mode under Digital
Lending Platform.
Loan up to Rs.10.00 Lakhs through Straight-through-Processing (STP) Mode under Digital
Lending Platform against the online deposits opened through Internet / Mobile Banking.
UPI123 feature for payment to 9 Archaeological Survey of India (ASI) monument sites has
been successfully enabled.
Programmable CBDC can be programmed by tying the money to undertake a specific end
use.
New functionalities have been added to Credit Card through WhatsApp channel viz., Block,
View dues, view outstanding balance and statement to registered email.
Term Deposit Products of Canara Green Deposit is introduced in Mobile Banking from 12.06.2024
where the amount deposited will be used for lending towards Green projects.
Canara
My
Money
Credit Card
in
WhatsApp
Introduction
of
PCBDC
Green
Deposit in
Ai1
UPI 123
Additional
Features
Canara
Ready
Cash
Page 43
Name of the Entity Holding(%)
Total Profit Our share
Jun’24
SUBSIDIARIES
Canara Robeco Asset Management Company Ltd. 51 40.25 20.53
Canara HSBC Life Insurance Company Ltd. 51 18.7 9.54
Canbank Factors Ltd. 70 1.7 1.19
Canbank Computer Services Ltd. 69.14 4.33 2.99
Canara Bank Securities Ltd. 100 2.37 2.37
Canbank Financial Services Ltd. 100 3.78 3.78
Canara Bank (Tanzania) Ltd. 100 0.39 0.39
Canbank Venture Capital Fund Ltd. 100 0.43 0.43
Total 71.95 41.22
Andhra Pragathi Grameena Bank 35 270.17 94.56
Can Fin Homes Ltd. 29.99 199.64 59.87
Kerala Gramin Bank 35 131.92 46.17
Karnataka Vikas Grameena Bank 35 35.76 12.52
Karnataka Gramin Bank 35 (263.15) (92.10)
Total 374.34 121.02
₹ in Crore
Subsidiaries & Associates
Page 44
Parameters
Guidance
(31.03.2025)
Actuals as on 30.06.2024
Business Growth (Global) 10.00% 11.07%
Advances Growth (Global) 10.00% 9.86%
Deposits Growth (Global) 9.00% 11.97%
CASA (Domestic CASA to Domestic Deposit) 33.00% 30.98%
NIM (Global)(Annualized) 2.90% 2.90%
Gross NPA (Global) 3.50% 4.14%
Net NPA (Global) 1.10% 1.24%
PCR (Global) 90.00% 89.22%
Slippage Ratio (Global)(Annualized) 1.30% 1.32%
Credit Cost (Global)(Annualized) 1.10% 0.90%
Return on Equity (RoE) 18.00% 20.88%
Earning per share (EPS)( Annualized) (Face Value Rs 2/- per
share)
16.40 17.27
Return on Average Assets (RoA) 1.00% 1.05%
Guidance for March 2025 Vs Actuals for June 2024
Page 45
This presentation has been prepared solely for information purposes only. It has no regard to any
financial situations or informational needs of any particular reason. The forward looking statements
involve a number of risk, uncertainties and other factors that could cause actual results to differ
materially from those suggested by the forward looking statements. These risks and uncertainties
include, but are not limited to our ability to successfully implement our strategy, future levels of non-
performing loans, our growth and expansion, the adequacy of our allowance for credit losses, our
provisioning policies, technological changes, investment income, cash flow projections, our exposure
to market risks as well as other risks. Canara Bank undertakes no obligation to update the forward-
looking statements to reflect events or circumstances after the date thereof.
Disclaimer
Page 46
We express our heartfelt gratitude to all our stakeholders for their
support & trust and solicit their continued patronage to make
our beloved Bank grow exponentially in the coming years.
Together We Can

Investor Presentation Jun 2024 revised.pdf

  • 1.
    Page 1 Financial Results:Q1 (FY 2024-25) Driving Customer Delight & Growth Digitally
  • 2.
    Page 2 Performance Highlights ₹in Crore Global Business 11.07% y-o-y 23,10,350 Global Deposit 11.97% y-o-y 13,35,167 Global Advances 9.86 % y-o-y 9,75,183 Net Profit 10.47 % y-o-y 3,905 Return on Assets 1.05 % y-o-y 6 bps PCR 89.22% y-o-y 118 bps CET-1 12.05% y-o-y 55 bps Credit Cost 0.90% y-o-y decline 20 bps Gross NPA 4.14 % y-o-y decline 101 bps Net NPA 1.24 % y-o-y decline 33 bps
  • 3.
    Page 3 Key Highlights 12.26% y-o-y RAMCredit 5,51,750 23.54% y-o-y Retail Credit 1,75,794 11.90% y-o-y Housing Loan 96,108 15.49% y-o-y Vehicle Loan 17,708 10.18% y-o-y EPS 17.27 16.75% y-o-y Fee Based Income 1,910 ₹ in Crore
  • 4.
    Page 4 06-13 15-22 24-25 27-32 34-35 37-37 39-42 43-43 44-44 Contents Business Performance FinancialPerformance Investments Asset Quality Capital & Shareholding Environmental, Social & Governance Distribution Network & Digital Footprint Subsidiaries & Associates Guidance for March 2025 Vs Actuals for June 2024
  • 5.
    Page 5 Driving CustomerDelight & Growth Digitally Business Performance
  • 6.
    Page 6 Business Performance ₹in Crore Parameters June’23 Mar’24 Jun’24 Growth (%) Q-o-Q Y-o-Y Global Gross Business 2080141 2272968 2310350 1.64 11.07 Domestic Gross Business 1947569 2123133 2151518 1.34 10.47 Overseas Gross Business 132572 149835 158832 6.00 19.81 Global Gross Advances 887671 960602 975183 1.52 9.86 Domestic Gross Advances 843063 908182 920334 1.34 9.17 Overseas Gross Advances 44608 52420 54849 4.63 22.96 Global Deposits 1192470 1312366 1335167 1.74 11.97 Domestic Deposits 1104506 1214951 1231184 1.34 11.47 Overseas Deposits 87964 97415 103983 6.74 18.21 Global C-D Ratio (%) 74.44 73.20 73.04 -- --
  • 7.
    Page 7 Domestic DepositMix ₹ in Crore Parameters Jun'23 Mar’24 Jun’24 Growth (%) Q-o-Q Y-o-Y Saving Deposits 320628 328378 332248 1.18 3.62 CASA Deposits 364464 392327 381448 (2.77) 4.66 Term Deposit 740042 822624 849736 3.30 14.82 Retail Term Deposit 466162 501403 514572 2.63 10.38 Total Domestic Deposit 1104506 1214951 1231184 1.34 11.47 Global Deposits 1192470 1312366 1335167 1.74 11.97
  • 8.
    Page 8 RAM: 55% RAM:57% Advances Mix ₹ in Crore 18% 25% 14% 43% Retail Agriculture & Allied MSME Corporate & Others 16% 25% 14% 45% Retail Agriculture & Allied MSME Corporate & Others Jun’24 Jun’23 Parameters Jun’23 Mar’24 Jun’24 Growth (%) Q-o-Q Y-o-Y RAM Credit 491475 541489 551750 1.89 12.26 Retail 142297 156414 175794 12.39 23.54 Agriculture & Allied 222757 253206 240894 (4.86) 8.14 MSME 126421 131869 135062 2.42 6.84 Corporate & others 396196 419113 423433 1.03 6.87 Domestic Gross Advances 843063 908182 920334 1.34 9.17 Global Gross Advance 887671 960602 975183 1.52 9.86
  • 9.
    Page 9 Exceeded theMandated Targets under Priority Sector Exceeded the mandated norms in respect of:  Total Priority (44.95% to ANBC against 40% norm)  Agriculture (22.02% to ANBC against 18% norm)  Small and Marginal Farmers (15.58% to ANBC against 10.00% norm)  Non Corporate Farmers (18.37% to ANBC against 13.78% norm)  Weaker Section (21.65% to ANBC against 12.00% norm)  Micro Enterprises (9.92% to ANBC against 7.50% norm) Mandated Norms under Priority Sector
  • 10.
    Page 10 RAM &Retail Credit 85884 96108 Housing Loans Jun'23 Jun'24 11.90% ₹ in Crore 491475 551750 RAM Jun'23 Jun'24 12.26% 142297 175794 Retail Loans Jun'23 Jun'24 23.54%
  • 11.
    Page 11 Industry Credit ₹in Crore Sector/Scheme Jun'23 Mar’24 Jun’24 Growth (%) Q-o-Q Y-o-Y Infrastructure 115220 129411 132942 2.73 15.38 NBFC 144804 131974 118529 (10.19) (18.15) Textile 17823 18353 18863 2.78 5.84 Iron & Steel 15564 14991 18767 25.19 20.58 Commercial Real Estate 19970 20841 22890 9.83 14.62 Food Processing 12097 12396 12451 0.44 2.92 Engineering 13590 13907 14135 1.63 4.01 Petroleum, Coal products & Nuclear Fuels 11670 10678 10291 (3.62) (11.82) Construction 9670 8903 9036 1.49 (6.56) Chemicals & Chemical Products 7551 10909 11383 4.34 50.74
  • 12.
    Page 12 ₹ inCrore Rating Profile External Rating - Wise Distribution of Domestic Advances above ₹ 25 crore (% of Total rated loan book above ₹ 25 crore) Jun’23 Mar’24 Jun’24 External Rating Outstanding % Share Outstanding % Share Outstanding % Share A and above 220189 81 222192 80 211925 78 BBB 27224 10 30897 11 34681 13 BB and below 25365 9 25135 9 26705 9 Total 272778 100 278224 100 273311 100 PSU PSE Customers (Jun’24) Central Govt. Guarantee State Govt. Guarantee 18528 54683
  • 13.
    Page 13 Rating Profile ₹in Crore Rating Profile of Standard NBFC Domestic Exposure Jun’23 Mar’24 Jun’24 External Rating Exposure % Share Exposure % Share Exposure % Share A and above 135871 99 129893 99 136866 99 BBB 366 1 130 1 74 1 BB and below 26 14 46 Total 136263 100 130037 100 136986 100
  • 14.
    Page 14 Driving CustomerDelight & Growth Digitally Financial Performance
  • 15.
    Page 15 ₹ inCrore Total Income Parameters Quarterly Jun'23 Mar’24 Jun'24 Growth (%) Q-o-Q Y-o-Y Interest Income 25004 28807 28701 (0.37) 14.79 Interest on Advances 18064 20863 20778 (0.41) 15.02 Interest on Investments 5349 5902 6078 2.98 13.63 Other Interest Income 1591 2042 1845 (9.65) 15.96 Non-Interest Income 4819 5217 5319 1.96 10.38 Total Income 29823 34024 34020 (0.01) 14.07
  • 16.
    Page 16 ₹ inCrore Non-Interest Income Parameters Quarterly Jun'23 Mar’24 Jun'24 Growth(%) Q-o-Q Y-o-Y Fee Based Income 1636 1941 1910 (1.60) 16.75 Commission Exchange & Brokerage 263 437 353 (19.22) 34.22 Service Charges 812 886 798 (9.93) (1.72) Miscellaneous 561 618 759 22.82 35.29 Treasury Income 536 865 503 (41.85) (6.16) Profit on Sale of Investments 294 663 349 (47.36) 18.71 Profit on Exchange Transactions 236 177 151 (14.69) (36.02) Dividend Income 6 25 3 (88.00) (50.00) Recoveries in Written Off A/cs 796 1900 1158 (39.05) 45.48 Other Receipts( PSLC & Others) 1851 511 1748 242.07 (5.56) Total Non-Interest Income 4819 5217 5319 1.96 10.38
  • 17.
    Page 17 ₹ inCrore Total Expenses Parameters Quarterly Jun'23 Mar’24 Jun’24 Growth (%) Q-o-Q Y-o-Y Interest Expenses 16338 19227 19535 1.60 19.57 Interest Paid on Deposits 15043 17714 18352 3.60 22.00 Other Interests 1295 1513 1183 (21.81) (8.65) Operating Expenses 5881 7410 6869 (7.30) 16.80 Staff Cost 3651 4458 4230 (5.11) 15.86 Other Operating Expenses 2230 2952 2639 (10.60) 18.34 Total Expenses 22219 26637 26404 (0.87) 18.84
  • 18.
    Page 18 ₹ inCrore Financials at a Glance Parameters Quarterly Jun'23 Mar’24 Jun’24 Growth (%) Q-o-Q Y-o-Y Net Interest Income 8666 9580 9166 (4.32) 5.77 Total Interest Income 25004 28807 28701 (0.37) 14.79 Total Interest Expenses 16338 19227 19535 1.60 19.57 Total Income 29823 34024 34020 (0.01) 14.07 Total Expenditure 22219 26637 26404 (0.87) 18.84 Operating Profit 7604 7387 7616 3.10 0.16 Provisions 4069 3630 3711 2.23 (8.80) Net Profit 3535 3757 3905 3.94 10.47
  • 19.
    Page 19 3535 3606 3656 3757 3905 Jun'23 Sep'23Dec'23 Mar'24 Jun'24 Net Profit (₹ in Cr) Continuous & Consistent Performance 1.57 1.41 1.32 1.27 1.24 Jun'23 Sep'23 Dec'23 Mar'24 Jun'24 Net NPA (%) 5.15 4.76 4.39 4.23 4.14 Jun'23 Sep'23 Dec'23 Mar'24 Jun'24 Gross NPA (%) 88.04 88.73 89.01 89.10 89.22 Jun'23 Sep'23 Dec'23 Mar'24 Jun'24 PCR (%)
  • 20.
    Page 20 ₹ inCrore Provisions Parameters Quarterly Jun'23 Mar’24 Jun’24 Growth (%) Q-o-Q Y-o-Y Total Provision 4069 3630 3711 2.23 (8.80) NPAs 2417 2280 2171 (4.78) (10.18) Standard Asset 3 44 21 (52.27) 600.00 Non Performing Investment 332 295 (125) ----- ----- Income Tax 1350 1149 1428 24.28 5.78 Others (33) (138) 216 ----- -----
  • 21.
    Page 21 (%) Key Ratios Ratios Jun’23Mar’24 Jun’24 Quarterly Cumulative Quarterly Cumulative Quarterly Cumulative Return on Assets 0.99 0.99 1.03 1.01 1.05 1.05 Return on Net-worth 22.95 22.95 21.18 22.06 20.88 20.88 Cost to Income 43.61 43.61 50.08 47.03 47.42 47.42 CD Ratio 74.44 74.44 73.20 73.20 73.04 73.04 EPS (Annualized)* 78.37 78.37 83.30 80.23 17.27 17.27 Book Value (In ₹)* 351.61 351.61 395.94 395.94 86.29 86.29 NIM 3.05 3.05 3.07 3.05 2.90 2.90 *Figures for June 2023 & March 2024 quarter is on Face Value of Rs 10/- per share whereas figures for June 2024 quarter is on Face Value of Rs 2/- per share.
  • 22.
    Page 22 4.76 5.00 5.25 Jun'23 Mar'24Jun'24 Cost Of Funds (%) 7.28 7.54 7.72 Jun'23 Mar'24 Jun'24 Yield on Funds(%) 6.85 6.91 6.94 Jun'23 Mar'24 Jun'24 Yield on Investments(%) 3.05 3.05 2.90 Jun'23 Mar'24 Jun'24 NIM(%) 5.22 5.50 5.70 Jun'23 Mar'24 Jun'24 Cost Of Deposits (%) 8.43 8.71 8.66 Jun'23 Mar'24 Jun'24 Yield on Advances(%) Key Ratios
  • 23.
    Page 23 INVESTMENTS Driving CustomerDelight & Growth Digitally
  • 24.
    Page 24 ₹ inCrore Investment Portfolio Sl. No Parameters Jun'23 Mar'24 Jun'24 1 Domestic Investments 334955 360836 373591 (a) SLR 298393 324154 324203 (b) Non SLR 36562 36682 49388 SLR as % to Dom. Investments 89.08 89.83 86.78 (i) Held To Maturity (HTM) 275423 290652 298077 (ii) Available For Sale (AFS) 58692 69748 54730 (iii) Fair Value Through Profit & Loss (FVTPL) (including HFT) 840 436 19253 (iv) Subsidiaries & Joint Ventures -- -- 1531 2 Investment by Overseas Branches 1008 2715 1911 3 Total Gross Investment (1+2) 335963 363551 375502 HTM To Investment (%) 82.23 80.55 79.79
  • 25.
    Page 25 Parameters Jun’23Mar’24 Jun’24 % Share (Jun'24) Y-o-Y Variation Amount % PSU Bonds 3503 3588 4138 8.38 635 18.13 Corporate and Other Bonds 5793 7113 7434 15.05 1641 28.33 Special Govt. Sec excl. Recap Bonds 1793 633 633 1.28 (1160) (64.70) CG Recap. Bond 18238 18238 18238 36.93 0 0.00 Share of PSU/Corporate/Others 4387 4136 5342 10.82 955 21.77 Venture Capital Fund 366 370 380 0.77 14 3.83 Regional Rural Bank 333 287 287 0.58 (46) (13.81) Security Receipts 648 1108 1041 2.11 393 60.65 Subsidiaries JV 763 763 1244 2.52 481 63.04 Other 738 446 10651 21.57 9913 1343.22 Total Non SLR Investment 36562 36682 49388 100.00 12826 35.08 ₹ in Crore Non SLR Portfolio
  • 26.
    Page 26 Driving CustomerDelight & Growth Digitally Asset Quality
  • 27.
    Page 27 ₹ inCrore Asset Quality Ratios Parameters Jun’23 Mar’24 Jun’24 Gross NPA 45727 40605 40356 Gross NPA (%) 5.15 4.23 4.14 Net NPA 13461 11823 11702 Net NPA (%) 1.57 1.27 1.24 Provision Coverage Ratio (%) 88.04 89.10 89.22 Credit Cost (%) 1.10 0.96 0.90 Slippage Ratio (%) 0.36 0.34 0.33
  • 28.
    Page 28 ₹ inCrore Parameters Jun’23 Mar’24 Jun’24 NPA as at the beginning of the period 46160 41722 40605 Cash Recovery towards Book Liability(i) 1127 929 780 Up-gradation (ii) 800 520 495 Write Off (iii) 1934 3068 2311 Total Reduction(i+ii+iii) 3861 4517 3586 Fresh Addition 3428 3400 3337 -Fresh Slippages 3188 3082 3015 -Debits in existing NPA A/c 240 318 322 Gross NPAs at end of the period 45727 40605 40356 Eligible Deductions incl. Provisions 32266 28782 28654 Net NPAs 13461 11823 11702 Recoveries in Written Off A/c 891 2232 1371 Total Cash recovery including Recovery in Written off A/cs 2018 3161 2151 Movement of NPA
  • 29.
    Page 29 ₹ inCrore NPA Classification: Sector Wise Parameters Jun'23 Mar'24 Jun'24 Advance O/s (Jun’24) GNPA (%) Domestic Gross NPA 41427 37213 37235 920334 4.05 Global Gross NPA 45727 40605 40356 975183 4.14 Retail 2082 2247 2249 175794 1.28 Housing Loans 642 836 900 96108 0.94 Vehicle Loans 242 268 283 17708 1.60 Other Personal Loans 328 354 353 46398 0.76 Agriculture & Allied 7436 8541 8815 240894 3.66 MSME 12295 11234 11365 135062 8.41 Corporate & Others 23914 18583 17927 423433 4.23
  • 30.
    Page 30 ₹ inCrore NPA Classification : Industrywise Sector/Scheme Jun’23 Mar’24 Jun’24 GNPA (%) Infrastructure 5466 5637 5861 4.41 Iron & Steel 721 568 561 2.99 Textile 1299 1431 1499 7.95 Food Processing 1124 1121 1222 9.81 Engineering 969 825 812 5.74
  • 31.
    Page 31 ₹ inCrore Special Mention Accounts (SMA) SMA Position of the Bank (₹ 5 Cr and above) Jun’23 Mar’24 Jun’24 Parameters No of Accounts Outstanding % to Gross Advances No of Accounts Outstanding % to Gross Advances No of Accounts Outstanding % to Gross Advances SMA 2 237 3367 0.38 141 3897 0.40 167 4134 0.42 SMA 1 72 3482 0.39 100 1229 0.13 65 881 0.09 TOTAL SMA 1 & 2 309 6849 0.77 241 5126 0.53 232 5015 0.51 SMA 0 172 3045 0.34 129 1533 0.16 148 6033 0.62 TOTAL 481 9894 1.11 370 6659 0.69 380 11048 1.13
  • 32.
    Page 32 NCLT ResolutionStatus Accounts referred to NCLT Parameters Jun’23 Jun’24 No of Accounts Book Liability Provision Provision Coverage No of Accounts Book Liability Provision Provision Coverage 1st List - RBI 4 1106 1106 100% 4 1094 1094 100% 2nd List – RBI 11 5289 5289 100% 9 4676 4676 100% Total RBI 1 & 2 15 6395 6395 100% 13 5770 5770 100% Others 356 34801 33382 96% 358 31759 30037 95% Total 371 41196 39777 97% 371 37529 35807 95% Cumulative Recovery Jun’23 Jun’24 (FY 2024-25) No of A/c Amount No of A/c Amount No of A/c Amount Through Resolution 12 59 12 108 12 59 Through Liquidation 26 55 26 52 26 55 Through 12A Settlement 1 16 1 2 1 16 Through PPIRP 1 1 0 0 1 1 Through Other Mode under NCLT 5 5 2 1 5 5 Total 45 136 41 163 45 136 ₹ in Crore
  • 33.
    Page 33 Driving CustomerDelight & Growth Digitally Capital & Shareholding
  • 34.
    Page 34 ₹ inCrore Capital Funds (Basel III) Parameters Jun’23 Mar’24 Jun’24 Tier I 80982 93368 98104 Common Equity 68561 77529 82265 Additional Tier I 12421 15839 15839 Tier II 15878 15599 13779 Total (Tier I+II) 96860 108967 111883 Risk-weighted Assets 596279 669257 682900 Gross Advances 887671 960602 975183 RWA to Gross Advances (%) 67.17 69.67 70.03 Tier I (%) 13.58 13.95 14.37 Common Equity (%) 11.50 11.58 12.05 Additional Tier I (%) 2.08 2.37 2.32 Tier II (%) 2.66 2.33 2.01 Total (Tier I+II) % 16.24 16.28 16.38 11.50 11.58 12.05 2.08 2.37 2.32 2.66 2.33 2.01 Jun'23 Mar'24 Jun'24 CRAR (%) CET AT I TIER II 16.24 16.28 16.38
  • 35.
    Page 35 Government ofIndia, 62.93 Insurance Companies, 7.06 Mutual Funds, 3.49 FIIs/FPIs, 11.91 Resident Individuals, 11.53 Staff, 0.63 Others, 2.45 Shareholding Pattern as on June 30th,2024 Year ended FII/FPIs holding (%) Mar’22 8.48 Mar’23 8.95 Mar’24 10.57
  • 36.
    Page 36 Driving CustomerDelight & Growth Digitally Environmental, Social & Governance
  • 37.
    Page 37 Environmental, Social& Governance (ESG) Practices  Bank is impacting the Society by engaging in helping and uplifting the underserved communities through non profit organizations viz  Canara Centenary Rural Development Trust  Canara Financial Advisory Trust  Canara Golden Jubilee Education Fund  Canara Relief and Welfare Society  Financial Literacy Centres (FLC)  Rural Self Employment Training Institutes (RSETIs)  Rural Development & Self Employment Training Institutes ( RUDSETIs.  During quarter ending June 2024, Bank has conducted 1,867 awareness programs and 576 training programs through its RSETIs and RUDSETIs, benefiting 17,000 plus candidates to upgrade their skill sets.  Bank has setup 115 Financial Literacy Centres (FLCs) through which 5,521 camps have been conducted and 3,46,747 persons were extended Financial Literacy in June quarter.  To promote diversity , equity & inclusive growth, Bank has in place a Women Empowerment Committee named as ‘Advaita’ to support the women employee fraternity of the Bank.  As part of Green initiatives, Bank has undertaken:  Increased usage of LED light, BEE rated AC units  Gradual phasing out of DG sets  Installed rooftop Solar Power system in 103 Bank owned properties and 10 more underway, with a total capacity of 3353 KWp.  EV charging station has been commissioned in Head Office Building for charging of staff’s E- Vehicles.  Canara Institute of Bank Management, Manipal was certified with Silver rating under IGBC Green Campus Certification system.  Bank is having a significant portfolio under sustainable finance which includes Renewable Energy Projects, Compressed Biogas & Energy Conservation scheme, Solar Pump scheme under PM-KUSUM, Roof Top Solar (RTS) for residential sector with subsidy, Canara Green Wheels scheme for E vehicles.  Scope 1 & Scope 2 emissions of the bank accounts for a total of 35296.13 tCO2 and 195643.45 tCO2 respectively for the financial year 2023-24.  Bank has fixed the Carbon Footprint Budget for its Employees’ official Air travel for the FY 2024-25.  For the Bank’s journey towards Sustainability, Bank has in place:  Board approved ESG Policy.  Green Deposit Policy & Lending Framework.  ESG Statement demonstrating the Bank’s commitment, initiatives & actions built around its Seven Founding Principles in line with the ESG concept aligning with the United Nation’s Sustainable Development Goals (SDGs).  Published its second Business Responsibility & Sustainability Reporting(BRSR) report as part of Annual Report for FY 2023-24.  Bank is having a Chief Ethics Officer and an exclusive ‘Ethics Section’ is in place to oversee the implementation of business ethics in the organization. Environmental Social Governance
  • 38.
    Page 38 Driving CustomerDelight & Growth Digitally Distribution Network
  • 39.
    Page 39 Urban 1914 20% Metro 1843 19% Semi-Urban 2760 29% Rural 3106 32% Presence acrossUrban & Rural areas Jun’24 4 International Branches • New York • London • Dubai • IBU, Gift City, Gujarat Distribution Network Parameters Jun'23 Mar'24 Jun'24 General Branches(a) 8865 8984 8997 Specialised Branches(b) 788 620 626 Total Domestic Branches(a+b) 9653 9604 9623 Overseas Branches 3 4 4 BC Points 13427 13167 13167 Total Banking Outlets 23083 22775 22794 ATM 10683 10209 10014 Recycler 1431 1946 2242
  • 40.
    Page 40 Digital Footprint DrivingCustomer Delight & Growth Digitally
  • 41.
    Page 41 142.42 207.68 JUN'23 JUN'24 MeitYDigital Transactions( Nos in Crore) Digital Footprint 5.24 5.74 JUN'23 JUN'24 Debit Card Outstanding (Nos in Crores) 2.52 2.67 JUN'23 JUN'24 Internet Banking Registrations (Nos in Crores) 1.78 2.34 JUN'23 JUN'24 Mobile Banking Registrations (Nos in Crores) 2.19 2.95 JUN'23 JUN'24 UPI Registrations (Nos in Crores) 0.62 0.78 JUN'23 JUN'24 PoS (No in Lakhs) 5.37 JUN'24 CBDC Registrations (Nos in Lakhs) 385.36 530.92 JUN'23 JUN'24 E-Transactions (Nos in Crores) 6.61 9.07 JUN'23 JUN'24 Credit Card ( No in Lakhs)
  • 42.
    Page 42 New DigitalInitiatives Pre-Approved Personal Loan product up to Rs.10.00 Lakh to existing customers (Canara SB Premium Payroll Customers) of our Bank through Straight-through-Processing (STP) Mode under Digital Lending Platform. Loan up to Rs.10.00 Lakhs through Straight-through-Processing (STP) Mode under Digital Lending Platform against the online deposits opened through Internet / Mobile Banking. UPI123 feature for payment to 9 Archaeological Survey of India (ASI) monument sites has been successfully enabled. Programmable CBDC can be programmed by tying the money to undertake a specific end use. New functionalities have been added to Credit Card through WhatsApp channel viz., Block, View dues, view outstanding balance and statement to registered email. Term Deposit Products of Canara Green Deposit is introduced in Mobile Banking from 12.06.2024 where the amount deposited will be used for lending towards Green projects. Canara My Money Credit Card in WhatsApp Introduction of PCBDC Green Deposit in Ai1 UPI 123 Additional Features Canara Ready Cash
  • 43.
    Page 43 Name ofthe Entity Holding(%) Total Profit Our share Jun’24 SUBSIDIARIES Canara Robeco Asset Management Company Ltd. 51 40.25 20.53 Canara HSBC Life Insurance Company Ltd. 51 18.7 9.54 Canbank Factors Ltd. 70 1.7 1.19 Canbank Computer Services Ltd. 69.14 4.33 2.99 Canara Bank Securities Ltd. 100 2.37 2.37 Canbank Financial Services Ltd. 100 3.78 3.78 Canara Bank (Tanzania) Ltd. 100 0.39 0.39 Canbank Venture Capital Fund Ltd. 100 0.43 0.43 Total 71.95 41.22 Andhra Pragathi Grameena Bank 35 270.17 94.56 Can Fin Homes Ltd. 29.99 199.64 59.87 Kerala Gramin Bank 35 131.92 46.17 Karnataka Vikas Grameena Bank 35 35.76 12.52 Karnataka Gramin Bank 35 (263.15) (92.10) Total 374.34 121.02 ₹ in Crore Subsidiaries & Associates
  • 44.
    Page 44 Parameters Guidance (31.03.2025) Actuals ason 30.06.2024 Business Growth (Global) 10.00% 11.07% Advances Growth (Global) 10.00% 9.86% Deposits Growth (Global) 9.00% 11.97% CASA (Domestic CASA to Domestic Deposit) 33.00% 30.98% NIM (Global)(Annualized) 2.90% 2.90% Gross NPA (Global) 3.50% 4.14% Net NPA (Global) 1.10% 1.24% PCR (Global) 90.00% 89.22% Slippage Ratio (Global)(Annualized) 1.30% 1.32% Credit Cost (Global)(Annualized) 1.10% 0.90% Return on Equity (RoE) 18.00% 20.88% Earning per share (EPS)( Annualized) (Face Value Rs 2/- per share) 16.40 17.27 Return on Average Assets (RoA) 1.00% 1.05% Guidance for March 2025 Vs Actuals for June 2024
  • 45.
    Page 45 This presentationhas been prepared solely for information purposes only. It has no regard to any financial situations or informational needs of any particular reason. The forward looking statements involve a number of risk, uncertainties and other factors that could cause actual results to differ materially from those suggested by the forward looking statements. These risks and uncertainties include, but are not limited to our ability to successfully implement our strategy, future levels of non- performing loans, our growth and expansion, the adequacy of our allowance for credit losses, our provisioning policies, technological changes, investment income, cash flow projections, our exposure to market risks as well as other risks. Canara Bank undertakes no obligation to update the forward- looking statements to reflect events or circumstances after the date thereof. Disclaimer
  • 46.
    Page 46 We expressour heartfelt gratitude to all our stakeholders for their support & trust and solicit their continued patronage to make our beloved Bank grow exponentially in the coming years. Together We Can