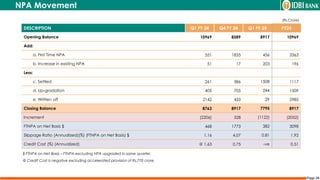
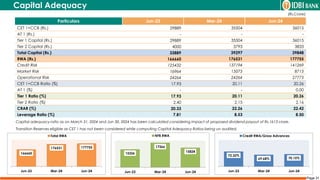
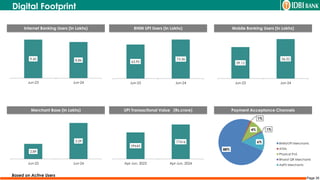
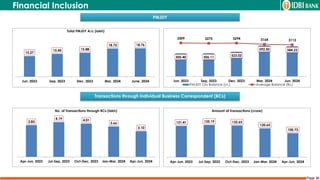
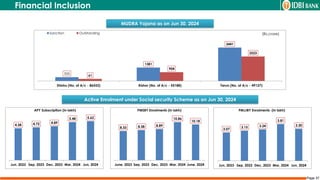
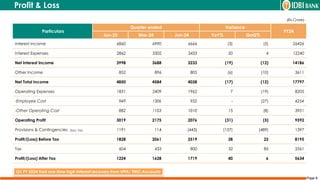
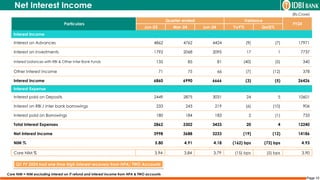
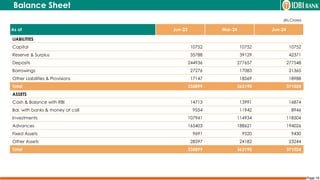
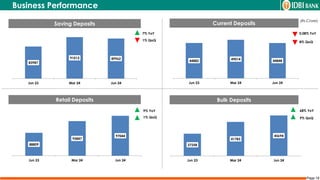
IDBI Bank presented its Q1 FY 2024-25 financial results, showing a strong performance with a profit after tax of ₹1719 crore, up 40% YoY. Key metrics included a net interest income of ₹3233 crore and a net NPA of 0.23%. The bank's total deposits grew by 13% YoY, reflecting improvements in asset quality and capital adequacy.

![Page 5
PAT - Rs.1719 crore
PBT - Rs.2519 crore
Operating Profit -
Rs.2076 crore
ROA – 1.83%
ROE – 19.87%
NII - Rs.3233 crore
NIM – 4.18%
[Core NIM – 3.79%]
Total RWA - Rs.177755 crore
Total CRAR - 22.42%
Tier 1 Capital – 20.26%
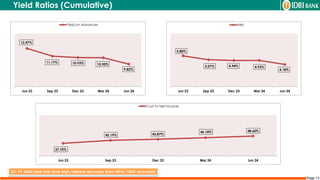
Yield on advances – 9.82%
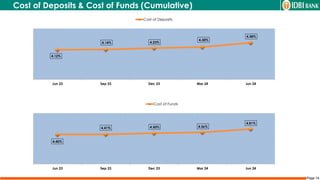
Cost of deposit – 4.58%
Cost of funds – 4.81%.
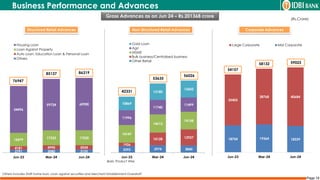
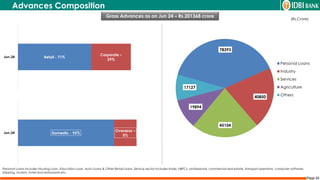
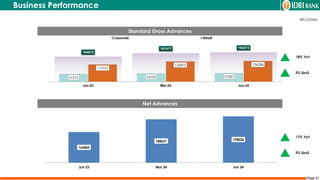
Net Adv. - Rs.194026 crore
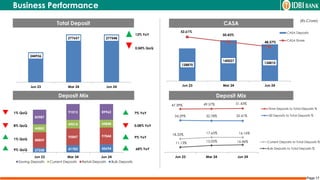
Deposit - Rs.277548 crore
CASA ratio - 48.57%
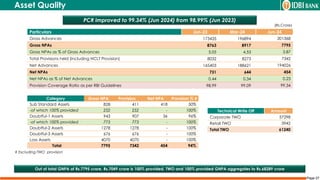
Net NPA – 0.23%
GNPA – 3.87%
PCR – 99.34%
Major Highlights for Q1 FY 2025 – Sustained Strong Performance](https://image.slidesharecdn.com/analystjune2024-240901044004-71168781/85/Analyst_June_2024-IDBI-Bank-presentation-5-320.jpg)
![Page 22
(Rs.Crore)
Particulars
Jun 23 Mar 24 Jun 24 Growth over
March-24
Amount % of ANBC Amount % of ANBC Amount % of ANBC
1 2 3 4 5 6 7 (8)=[(6)-(4)]
ANBC 173573 166052 174448
Priority Sector Advances (a+b+c) 72383 41.70 77921 46.93 78030 44.73 109
(a) Agriculture (i+ii+iii+iv) 32230 18.57 32254 19.42 31986 18.34 (268)
(i) Non-Corporate Farmers (NCF) 24430 14.07 25956 15.63 26193 15.02 237
(ii) Other Agri 1892 1.09 1711 1.03 1736 1.00 25
(iii) Indirect Agriculture (RIDF) 5907 3.40 4588 2.76 4057 2.33 (531)
(iv) PSLC (Agri) sale - -
(b) MSME (Micro, Medium & Small Enterprises) 21488 12.38 26822 16.15 27478 15.75 656
(c) Other Priority Sector Advances (i+ii+iii) 18665 10.75 18845 11.35 18566 10.64 (279)
(i) Housing 17783 10.25 18026 10.86 17759 10.18 (267)
(ii) Others 882 0.50 819 0.49 807 0.46 (12)
(iii) PSLC (General) sale - - -
Priority Sector
Basis: Sector Wise](https://image.slidesharecdn.com/analystjune2024-240901044004-71168781/85/Analyst_June_2024-IDBI-Bank-presentation-22-320.jpg)