Health Indicators of Sexual Minority
Youth Living in Rural and Non-rural
Communities
MYESHIA PRICE-FEENEY, PHD
MICHELE YBARRA, MPH PHD
KIMBERLY J MITCHELL, PHD
Society for the Scientific Study of
Sexuality: 2016 Annual Meeting
Phoenix, AZ – November 16-17, 2016
* Thank you for your interest in this presentation. Please note
that analyses included herein are preliminary. More recent,
finalized analyses may be available by contacting CiPHR.
Background: LGB+ Youth
Poorer health outcomes for LGB+ youth
• Gay and bisexual young men account for 72% of
new HIV infections among youth (CDC, 2012)
• LGB+ youth are more likely to be injured in
physical fight, experience dating violence, and
physically forced to have sex (CDC, 2011)
• LGB+ youth also report higher rates of
depression, emotional distress (Robinson et al.,
2013), substance abuse (Seil et al., 2014), and
attempted suicide (Birkett et al., 2009)
LGB+ youth are similarly resilient as heterosexual
youth when they feel socially, emotionally, and
physically safe and supported in schools and
families (Espelage et al., 2009; Bouris et al., 2010)
Background: Rural LGB+
Challenges faced might be more pronounced in rural communities
• Negative attitudes toward LGB+ people related to lack of diversity (Poteat, et al., 2009),
lower income (Herek, 2002), lower education levels (Kosciw et, al., 2009) and higher
concentration of conservative and religious individuals (Drumheller & McQuay, 2010)
• The availability of a sexual minority peer group is often limited or nonexistent (D’Augelli &
Hart, 1987)
Research is limited:
• Same-sex attracted girls living in rural communities report lower school belonging and higher
depressive symptoms (Galliher et al., 2004)
• Rural youth are equally likely to be out, but lower well-being and grade point averages (Kosciw
et al., 2015)
• Rural youth are more likely to experience harassment and assault related to sexual identity and
gender expression (Kosciw & Diaz, 2006)
Current Study
• We address gaps in the literature by examining comprehensive health indicators in a
nationally-representative sample of LGB+ and non-LGB youth
• To disentangle sexual identity and urbanicity, we compared rural sexual minority youth
to: 1) non-rural sexual minority youth, 2) rural heterosexual youth, and 3) non-rural
heterosexual youth
• Because sex could account for variability in experiences among sexual minority
individuals, we examined health indicators separately by sex
Methods
Participants
• Data are from Teen Health and Technology study, an online, national survey of sexual and
gender minority adolescents 13-18 yo as well as those who were not
• Recruited a) randomly from Harris Poll Online (HPOL) opt-in panel or b) national outreach by
Gay, Lesbian, & Straight Network (GLSEN)
• 5,542 (3,777 through HPOL and 1765 GLSEN)
• Missing data imputed using STATA “impute” command
• Data are weighted to approximate the national population of youth
Procedure
• Self-administered online survey
• Data collected between August 2010 and January 2011
• Median length 23 min (HPOL) and 34 min (GLSEN)
Methods
Sexual Identity
• “How would you describe your sexual identity or sexual orientation? Please select all that
apply”
• 17% endorsed two or more identities
• We created five exclusive categories: straight/heterosexual exclusively; bisexual, lesbian/gay;
queer; questioning, unsure, and other
Health indicators
• Self-appraised safety at school, home, etc
• Perceived social support
• Self-reported substance use (past 12 mo)
• Self-esteem
• Depressive symptomology
• Peer victimization
• Involvement in social or political activities
• Outness to others
• http://innovativepublichealth.org/projects/teen-health-and-technology/
Data Analyses
• Chi-square used to test differences in health indicators across all four groups: rural
sexual minority, non-rural sexual minority, rural heterosexual, and non-rural
heterosexual
• Unadjusted multinomial regression used to quantify relative differences between rural
sexual minority youth and the other three urbanicity-sexual identity categories
• The reciprocal was calculated to reflect the relative odds of being rural sexual minority vs
other three groups
• Summation of self-appraised safety, substance use, social or political involvement, and
outness examined to see if rural sexual minority youth experienced a higher quantity of
these characteristics
Results: Sample Characteristics
Demographic Characteristics (%)
All Youth
(n=5542)
Rural Sexual
Minority
(n = 594)
Non-Rural
Sexual
Minority
(n = 1568)
Rural
Heterosexual
(n =1130)
Non-Rural
Heterosexual
(n = 2250)
Female*** 53.87 66.42 59.13 51.63 47.23
Age (Range: 13-18, M; SE)*** 15.70 (.03) 15.78 (.12) 15.97 (.08) 15.54 (.06) 15.58 (.04)
Race/Ethnicitya***
White 59.88 72.99 49.03 74.12 52.73
Hispanic 19.31 14.13 25.71 12.68 21.35
Black/African American 12.66 5.27 12.76 7.33 19.03
Other Race 8.16 7.60 12.50 5.87 6.89
Sexual Identityb
Heterosexual 61.58 -- --
Gay/Lesbian/Queer 15.42 36.84 41.79
Bisexual 18.92 51.37 48.19
Questioning/Unsure/Other 4.08 11.79 10.02
Urbanicity
Rural 38.54
Suburban/Urban 61.46
Income*
Low Income 28.95 32.34 32.00 29.62 25.07
Middle/High Income 71.05 67.66 68.00 70.38 74.93
Results
Urbanicity
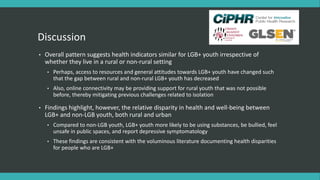
• Rural and non-rural sexual minority youth similar on all measured
health indicators
• Exception: rural sexual minority girls less likely to have low self-esteem
(OR=.63) and more likely to have been bullied (1.85) compared to
non-rural sexual minority girls
Sexual Identity
• Rural sexual minority youth differed from rural heterosexual and non-
rural heterosexual youth on nearly every measured health indicator
• More likely than heterosexual youth (both rural and non-rural) to have
used substances, poorer mental health outcomes, felt less safe (e.g.
place of worship, to-and-from school)
• Rural sexual minority youth were 2.5-9.1 times more likely than
heterosexual youth to be involved in social or political activities
compared to both hetero groups; esp taking part in community that
supports issue/cause
Results
Males
(n = 2377)
Females
(n = 3165)
Non-Rural Sexual
Minority
(n = 625)
Rural Heterosexual
(n = 491)
Non-Rural
Heterosexual
(n = 1013)
Non-Rural Sexual
Minority
(n = 943)
Rural Heterosexual
(n = 639)
Non-Rural
Heterosexual
(n = 1237)
Measures of Self-Appraised Safety
Did Not Feel Unsafe (reference)
Unsafe in One or More Places .93 (.47, 1.85) 1.79 (.85, 1.27) 1.54 (.54, 2.00) .81 (.49, 1.35) 1.89 (1.10, 3.23) 1.27 (.77, 2.08)
Substance Use
No Substance Use (reference)
Used 1 or 2 Substances in Past 12 months 1.43 (.74, 2.78) 3.23 (1.79, 5.88) 2.70 (1.49, 4.76) 1.18 (.72, 1.89) 3.33 (2.13, 5.26) 3.23 (2.08, 5.00)
Used 3 to 5 Substances in Past 12 months 1.41 (.57, 3.45) 3.45 (1.45, 8.33) 2.50 (1.10, 5.56) .88 (.52, 1.52) 5.88 (3.23, 11.11) 5.26 (3.03, 9.09)
Involvement in Social or Political Activities
No Involvement (reference)
Involved in 1 to 4 Social or Political Activities .78 (.26, 2.27) 2.38 (.94, 5.88) 2.00 (.81, 5.00) .33 (.15, .76) 2.08 (1.05, 4.17) 1.69 (.87, 3.33)
Involved in 5 to 8 Social or Political Activities .95 (.34, 2.70) 8.33 (3.57, 20.00) 8.33 (3.57, 20.00) .47 (.22, 1.02) 8.33 (4.55, 16.67) 6.67 (3.57, 12.50)
Outness
Not Out in Any Relationships (reference)
Out in 1 or 2 Relationships .75 (.31, 1.49) 1.32 (.77, 2.27)
Out in 3 to 6 Relationships .81 (.41, 1.59) 1.28 (.79, 2.04)
aCORs are the adjusted conditional odds of being rural sexual minority youth versus the category in question. Point estimates are adjusted for age, race/ethnicity, income, parents
combined education, gender identity, honesty while taking the survey, and not being alone while taking the survey.
Discussion
• Overall pattern suggests health indicators similar for LGB+ youth irrespective of
whether they live in a rural or non-rural setting
• Perhaps, access to resources and general attitudes towards LGB+ youth have changed such
that the gap between rural and non-rural LGB+ youth has decreased
• Also, online connectivity may be providing support for rural youth that was not possible
before, thereby mitigating previous challenges related to isolation
• Findings highlight, however, the relative disparity in health and well-being between
LGB+ and non-LGB youth, both rural and urban
• Compared to non-LGB youth, LGB+ youth more likely to be using substances, be bullied, feel
unsafe in public spaces, and report depressive symptomatology
• These findings are consistent with the voluminous literature documenting health disparities
for people who are LGB+
Limitations
• Data collected in 2012, before many currently pertinent LGBT rights issues (.e.g gay
marriage legalization; HB2)
• Rural and non-rural status was self-determined and may depend on one’s perspective
• Data are cross-sectional – temporality cannot be determined
• Because of sample sizes, we could not look within sexual minority group (e.g.
lesbian/gay versus bisexual)
• Findings do not necessarily generalize to gender
minority youth
Conclusion
• Findings suggest living in rural environment does not confer differential experience for
sexual minority youth
• One’s sexual identity, whether youth live in rural or non-rural settings, is associated
with a greater likelihood of risk behaviors and poorer mental health outcomes
• LGB+ youth, overall, are more likely to have more social or political involvement (online
and through text) than heterosexual youth
• Suggests they are possibly using these tools to feel connected to a community, gain support,
and be empowered
• Local sexual minority-inclusive services still needed for youth in rural communities
Acknowledgments
Thank you to the entire Teen Health and Technology study team: CiPHR,
CCRC, and GLSEN, who contributed to the planning and implementation of
the study.
For more information about the Teen Health and Technology study, contact:
Michele Ybarra, MPH PhD
Center for Innovative Public Health Research
P: 1 877 302 6858 ext. 801
F: 1 877 302 6858
michele@innovativepublichealth.org
National Institute of Child and Human Development (R01 HD057191)
The content is solely the responsibility of the authors and does not necessarily represent the official views
of the National Institute of Child Health and Human Development or the National Institutes of Health.
Health Indicators of Sexual Minority
Youth Living in Rural and Non-rural
Communities
MYESHIA PRICE-FEENEY, PHD
MICHELE YBARRA, MPH PHD
KIMBERLY J MITCHELL, PHD

SSSS 2016 Phoenix AZ 2

  • 1.
    Health Indicators ofSexual Minority Youth Living in Rural and Non-rural Communities MYESHIA PRICE-FEENEY, PHD MICHELE YBARRA, MPH PHD KIMBERLY J MITCHELL, PHD Society for the Scientific Study of Sexuality: 2016 Annual Meeting Phoenix, AZ – November 16-17, 2016 * Thank you for your interest in this presentation. Please note that analyses included herein are preliminary. More recent, finalized analyses may be available by contacting CiPHR.
  • 2.
    Background: LGB+ Youth Poorerhealth outcomes for LGB+ youth • Gay and bisexual young men account for 72% of new HIV infections among youth (CDC, 2012) • LGB+ youth are more likely to be injured in physical fight, experience dating violence, and physically forced to have sex (CDC, 2011) • LGB+ youth also report higher rates of depression, emotional distress (Robinson et al., 2013), substance abuse (Seil et al., 2014), and attempted suicide (Birkett et al., 2009) LGB+ youth are similarly resilient as heterosexual youth when they feel socially, emotionally, and physically safe and supported in schools and families (Espelage et al., 2009; Bouris et al., 2010)
  • 3.
    Background: Rural LGB+ Challengesfaced might be more pronounced in rural communities • Negative attitudes toward LGB+ people related to lack of diversity (Poteat, et al., 2009), lower income (Herek, 2002), lower education levels (Kosciw et, al., 2009) and higher concentration of conservative and religious individuals (Drumheller & McQuay, 2010) • The availability of a sexual minority peer group is often limited or nonexistent (D’Augelli & Hart, 1987) Research is limited: • Same-sex attracted girls living in rural communities report lower school belonging and higher depressive symptoms (Galliher et al., 2004) • Rural youth are equally likely to be out, but lower well-being and grade point averages (Kosciw et al., 2015) • Rural youth are more likely to experience harassment and assault related to sexual identity and gender expression (Kosciw & Diaz, 2006)
  • 4.
    Current Study • Weaddress gaps in the literature by examining comprehensive health indicators in a nationally-representative sample of LGB+ and non-LGB youth • To disentangle sexual identity and urbanicity, we compared rural sexual minority youth to: 1) non-rural sexual minority youth, 2) rural heterosexual youth, and 3) non-rural heterosexual youth • Because sex could account for variability in experiences among sexual minority individuals, we examined health indicators separately by sex
  • 5.
    Methods Participants • Data arefrom Teen Health and Technology study, an online, national survey of sexual and gender minority adolescents 13-18 yo as well as those who were not • Recruited a) randomly from Harris Poll Online (HPOL) opt-in panel or b) national outreach by Gay, Lesbian, & Straight Network (GLSEN) • 5,542 (3,777 through HPOL and 1765 GLSEN) • Missing data imputed using STATA “impute” command • Data are weighted to approximate the national population of youth Procedure • Self-administered online survey • Data collected between August 2010 and January 2011 • Median length 23 min (HPOL) and 34 min (GLSEN)
  • 6.
    Methods Sexual Identity • “Howwould you describe your sexual identity or sexual orientation? Please select all that apply” • 17% endorsed two or more identities • We created five exclusive categories: straight/heterosexual exclusively; bisexual, lesbian/gay; queer; questioning, unsure, and other Health indicators • Self-appraised safety at school, home, etc • Perceived social support • Self-reported substance use (past 12 mo) • Self-esteem • Depressive symptomology • Peer victimization • Involvement in social or political activities • Outness to others • http://innovativepublichealth.org/projects/teen-health-and-technology/
  • 7.
    Data Analyses • Chi-squareused to test differences in health indicators across all four groups: rural sexual minority, non-rural sexual minority, rural heterosexual, and non-rural heterosexual • Unadjusted multinomial regression used to quantify relative differences between rural sexual minority youth and the other three urbanicity-sexual identity categories • The reciprocal was calculated to reflect the relative odds of being rural sexual minority vs other three groups • Summation of self-appraised safety, substance use, social or political involvement, and outness examined to see if rural sexual minority youth experienced a higher quantity of these characteristics
  • 8.
    Results: Sample Characteristics DemographicCharacteristics (%) All Youth (n=5542) Rural Sexual Minority (n = 594) Non-Rural Sexual Minority (n = 1568) Rural Heterosexual (n =1130) Non-Rural Heterosexual (n = 2250) Female*** 53.87 66.42 59.13 51.63 47.23 Age (Range: 13-18, M; SE)*** 15.70 (.03) 15.78 (.12) 15.97 (.08) 15.54 (.06) 15.58 (.04) Race/Ethnicitya*** White 59.88 72.99 49.03 74.12 52.73 Hispanic 19.31 14.13 25.71 12.68 21.35 Black/African American 12.66 5.27 12.76 7.33 19.03 Other Race 8.16 7.60 12.50 5.87 6.89 Sexual Identityb Heterosexual 61.58 -- -- Gay/Lesbian/Queer 15.42 36.84 41.79 Bisexual 18.92 51.37 48.19 Questioning/Unsure/Other 4.08 11.79 10.02 Urbanicity Rural 38.54 Suburban/Urban 61.46 Income* Low Income 28.95 32.34 32.00 29.62 25.07 Middle/High Income 71.05 67.66 68.00 70.38 74.93
  • 9.
    Results Urbanicity • Rural andnon-rural sexual minority youth similar on all measured health indicators • Exception: rural sexual minority girls less likely to have low self-esteem (OR=.63) and more likely to have been bullied (1.85) compared to non-rural sexual minority girls Sexual Identity • Rural sexual minority youth differed from rural heterosexual and non- rural heterosexual youth on nearly every measured health indicator • More likely than heterosexual youth (both rural and non-rural) to have used substances, poorer mental health outcomes, felt less safe (e.g. place of worship, to-and-from school) • Rural sexual minority youth were 2.5-9.1 times more likely than heterosexual youth to be involved in social or political activities compared to both hetero groups; esp taking part in community that supports issue/cause
  • 10.
    Results Males (n = 2377) Females (n= 3165) Non-Rural Sexual Minority (n = 625) Rural Heterosexual (n = 491) Non-Rural Heterosexual (n = 1013) Non-Rural Sexual Minority (n = 943) Rural Heterosexual (n = 639) Non-Rural Heterosexual (n = 1237) Measures of Self-Appraised Safety Did Not Feel Unsafe (reference) Unsafe in One or More Places .93 (.47, 1.85) 1.79 (.85, 1.27) 1.54 (.54, 2.00) .81 (.49, 1.35) 1.89 (1.10, 3.23) 1.27 (.77, 2.08) Substance Use No Substance Use (reference) Used 1 or 2 Substances in Past 12 months 1.43 (.74, 2.78) 3.23 (1.79, 5.88) 2.70 (1.49, 4.76) 1.18 (.72, 1.89) 3.33 (2.13, 5.26) 3.23 (2.08, 5.00) Used 3 to 5 Substances in Past 12 months 1.41 (.57, 3.45) 3.45 (1.45, 8.33) 2.50 (1.10, 5.56) .88 (.52, 1.52) 5.88 (3.23, 11.11) 5.26 (3.03, 9.09) Involvement in Social or Political Activities No Involvement (reference) Involved in 1 to 4 Social or Political Activities .78 (.26, 2.27) 2.38 (.94, 5.88) 2.00 (.81, 5.00) .33 (.15, .76) 2.08 (1.05, 4.17) 1.69 (.87, 3.33) Involved in 5 to 8 Social or Political Activities .95 (.34, 2.70) 8.33 (3.57, 20.00) 8.33 (3.57, 20.00) .47 (.22, 1.02) 8.33 (4.55, 16.67) 6.67 (3.57, 12.50) Outness Not Out in Any Relationships (reference) Out in 1 or 2 Relationships .75 (.31, 1.49) 1.32 (.77, 2.27) Out in 3 to 6 Relationships .81 (.41, 1.59) 1.28 (.79, 2.04) aCORs are the adjusted conditional odds of being rural sexual minority youth versus the category in question. Point estimates are adjusted for age, race/ethnicity, income, parents combined education, gender identity, honesty while taking the survey, and not being alone while taking the survey.
  • 11.
    Discussion • Overall patternsuggests health indicators similar for LGB+ youth irrespective of whether they live in a rural or non-rural setting • Perhaps, access to resources and general attitudes towards LGB+ youth have changed such that the gap between rural and non-rural LGB+ youth has decreased • Also, online connectivity may be providing support for rural youth that was not possible before, thereby mitigating previous challenges related to isolation • Findings highlight, however, the relative disparity in health and well-being between LGB+ and non-LGB youth, both rural and urban • Compared to non-LGB youth, LGB+ youth more likely to be using substances, be bullied, feel unsafe in public spaces, and report depressive symptomatology • These findings are consistent with the voluminous literature documenting health disparities for people who are LGB+
  • 12.
    Limitations • Data collectedin 2012, before many currently pertinent LGBT rights issues (.e.g gay marriage legalization; HB2) • Rural and non-rural status was self-determined and may depend on one’s perspective • Data are cross-sectional – temporality cannot be determined • Because of sample sizes, we could not look within sexual minority group (e.g. lesbian/gay versus bisexual) • Findings do not necessarily generalize to gender minority youth
  • 13.
    Conclusion • Findings suggestliving in rural environment does not confer differential experience for sexual minority youth • One’s sexual identity, whether youth live in rural or non-rural settings, is associated with a greater likelihood of risk behaviors and poorer mental health outcomes • LGB+ youth, overall, are more likely to have more social or political involvement (online and through text) than heterosexual youth • Suggests they are possibly using these tools to feel connected to a community, gain support, and be empowered • Local sexual minority-inclusive services still needed for youth in rural communities
  • 14.
    Acknowledgments Thank you tothe entire Teen Health and Technology study team: CiPHR, CCRC, and GLSEN, who contributed to the planning and implementation of the study. For more information about the Teen Health and Technology study, contact: Michele Ybarra, MPH PhD Center for Innovative Public Health Research P: 1 877 302 6858 ext. 801 F: 1 877 302 6858 michele@innovativepublichealth.org National Institute of Child and Human Development (R01 HD057191) The content is solely the responsibility of the authors and does not necessarily represent the official views of the National Institute of Child Health and Human Development or the National Institutes of Health.
  • 15.
    Health Indicators ofSexual Minority Youth Living in Rural and Non-rural Communities MYESHIA PRICE-FEENEY, PHD MICHELE YBARRA, MPH PHD KIMBERLY J MITCHELL, PHD