Download to read offline

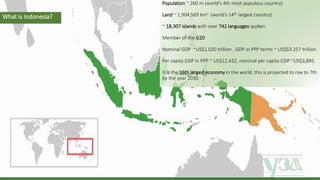
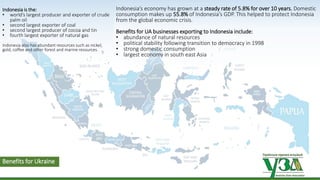
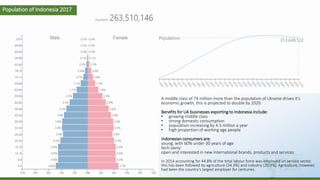

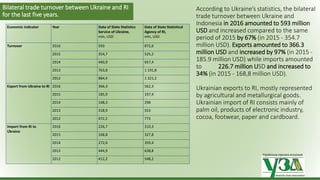
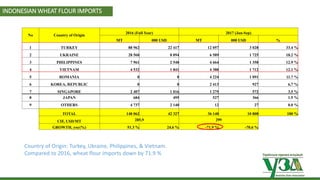
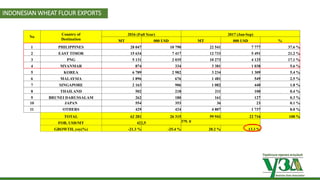
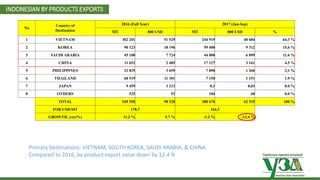
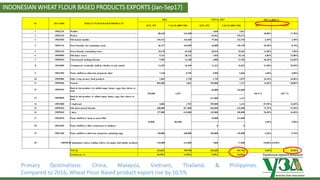


The document outlines the economic relationship between Ukraine and Indonesia, highlighting Indonesia's growing economy and its status as a significant importer of Ukrainian agricultural products. It details benefits for Ukrainian businesses, including Indonesia's vast domestic market and natural resources. The trade turnover between both nations has increased significantly, demonstrating potential opportunities in various sectors such as wheat and flour exports.


