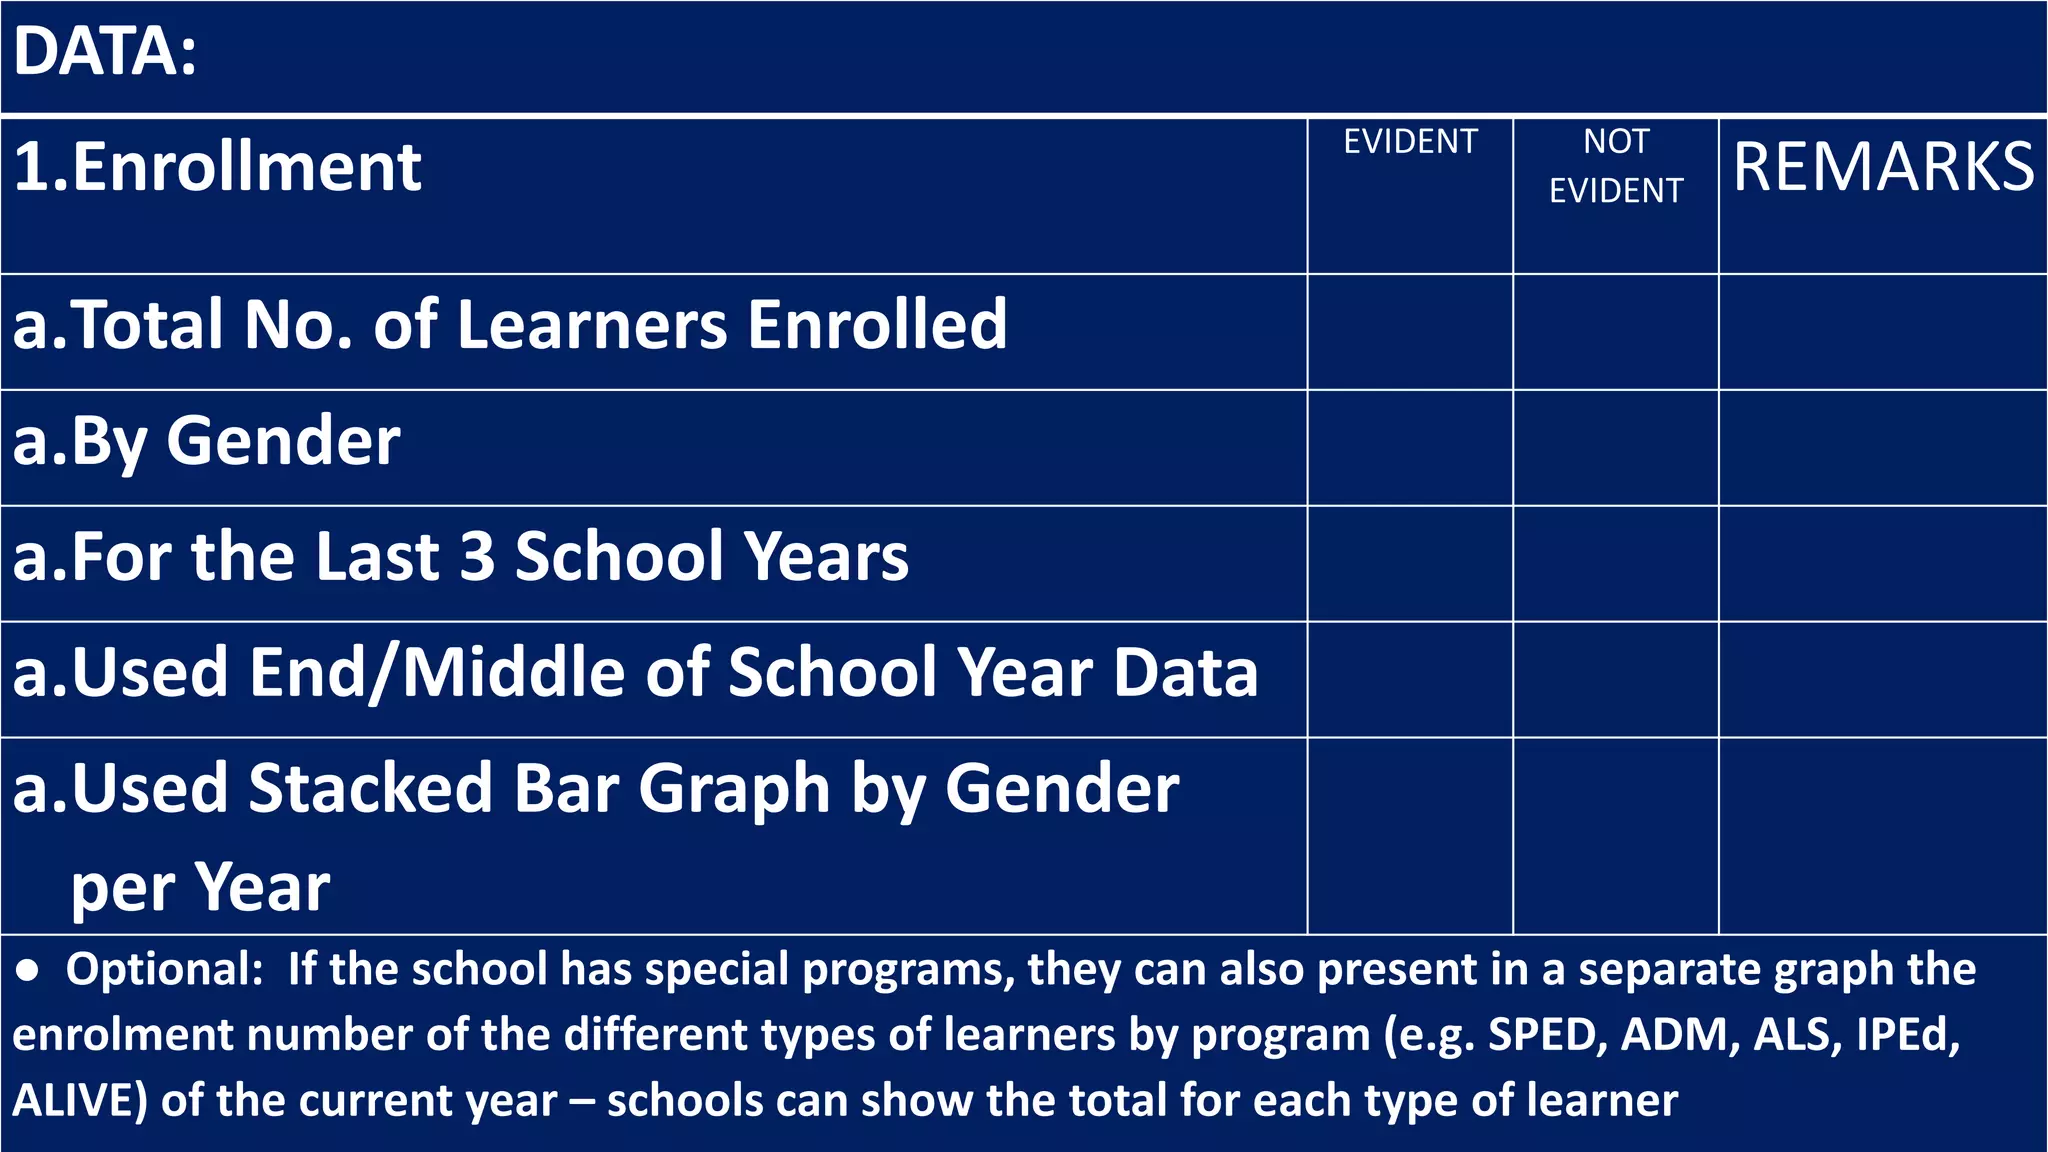
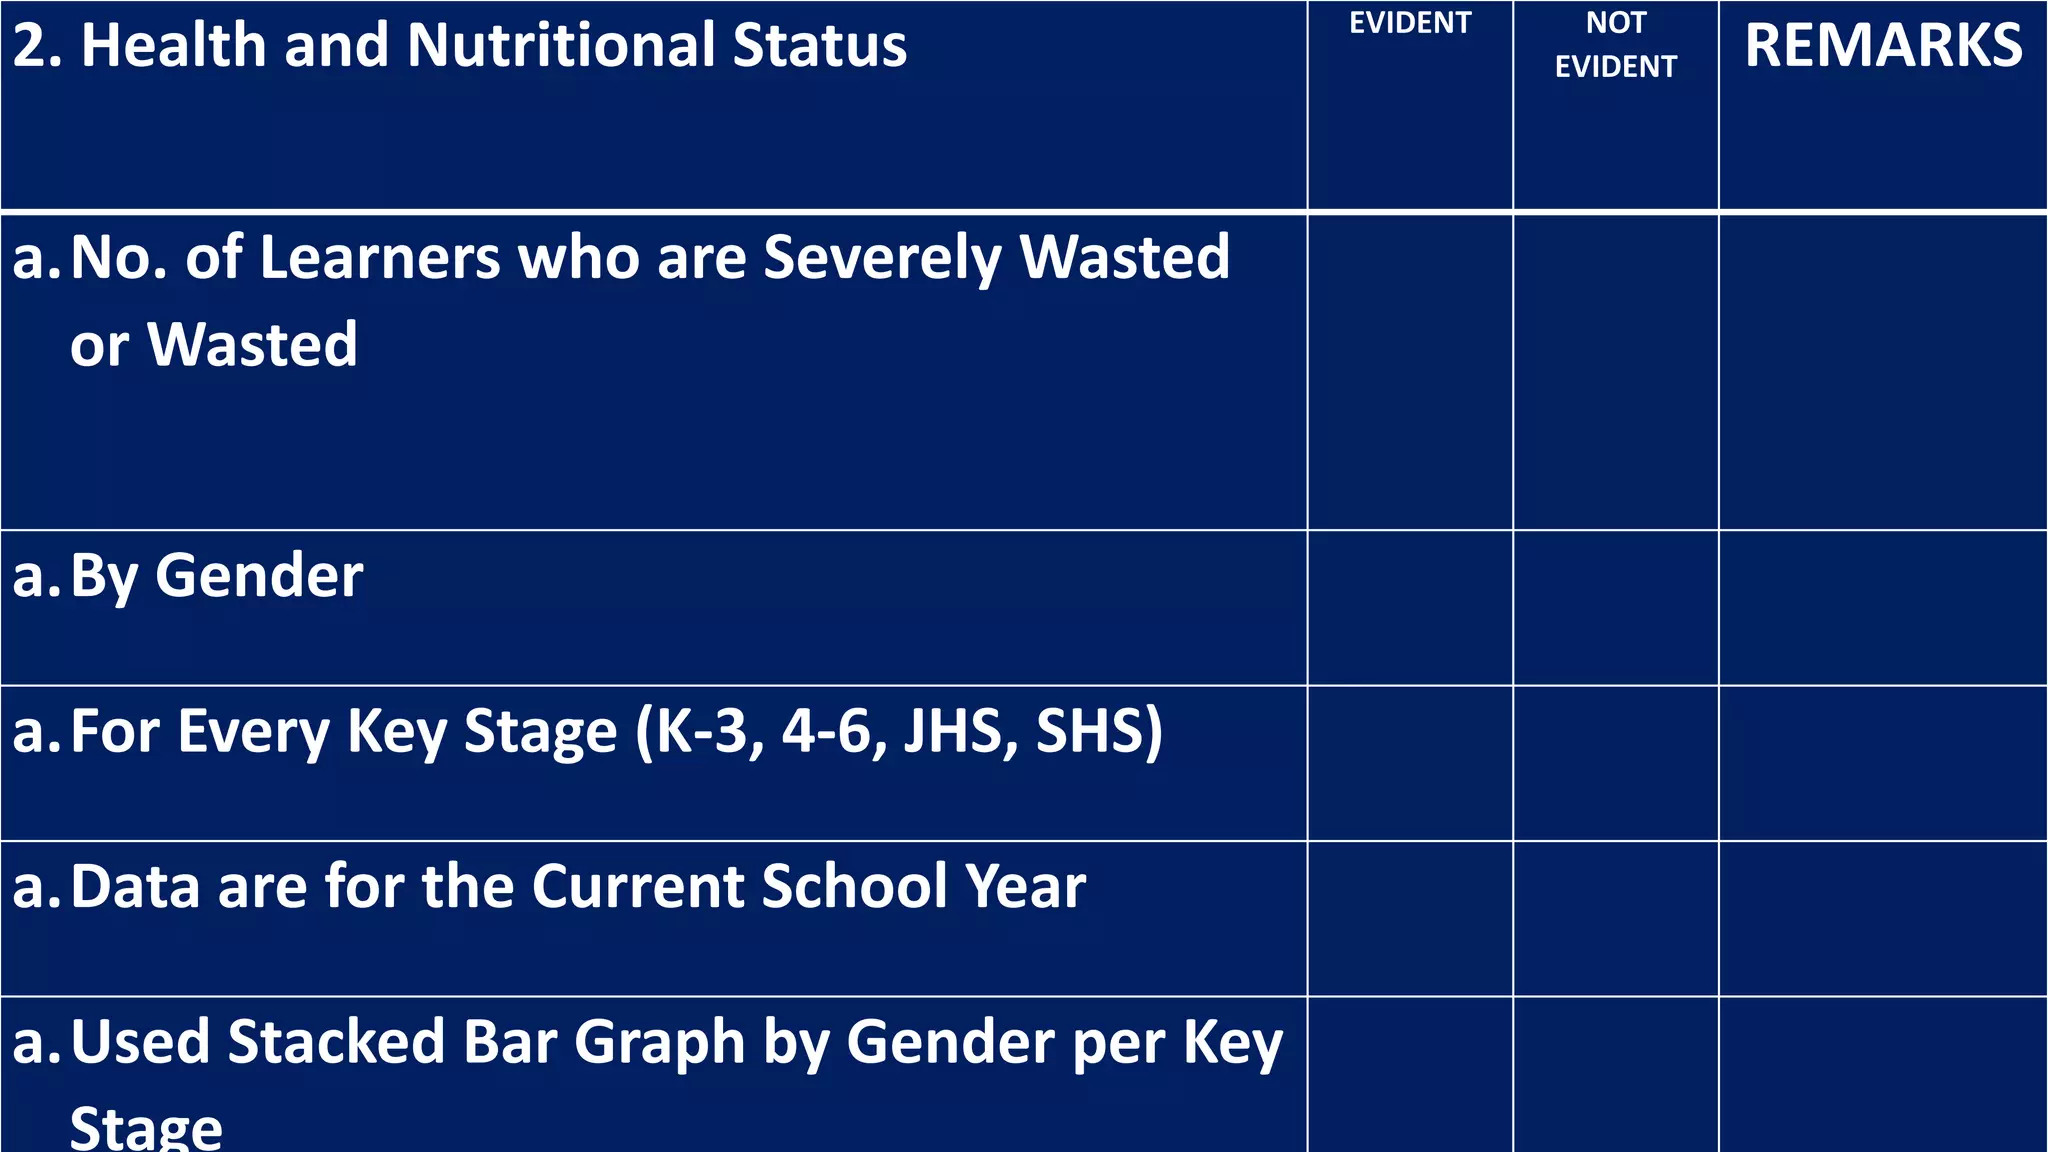
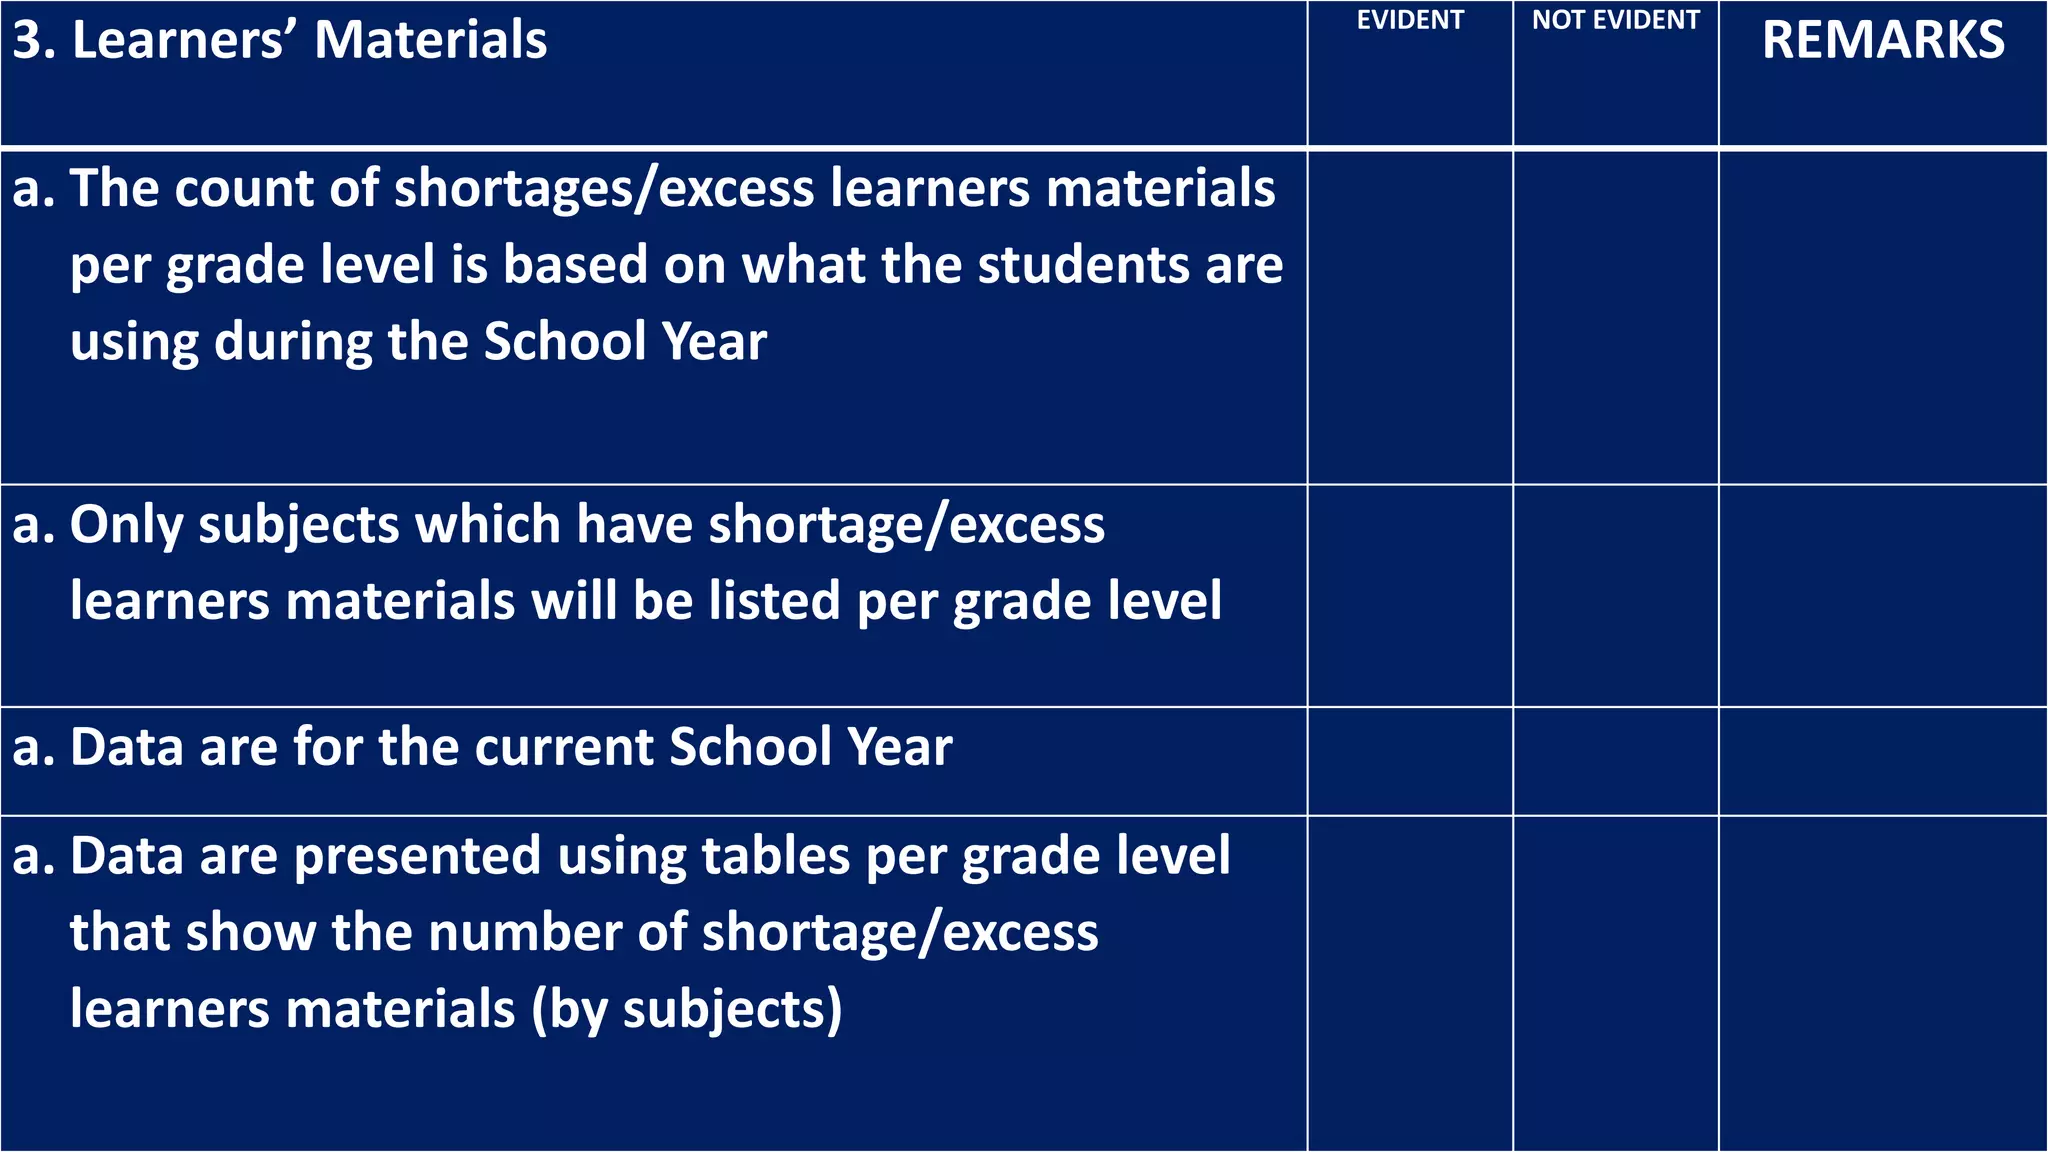
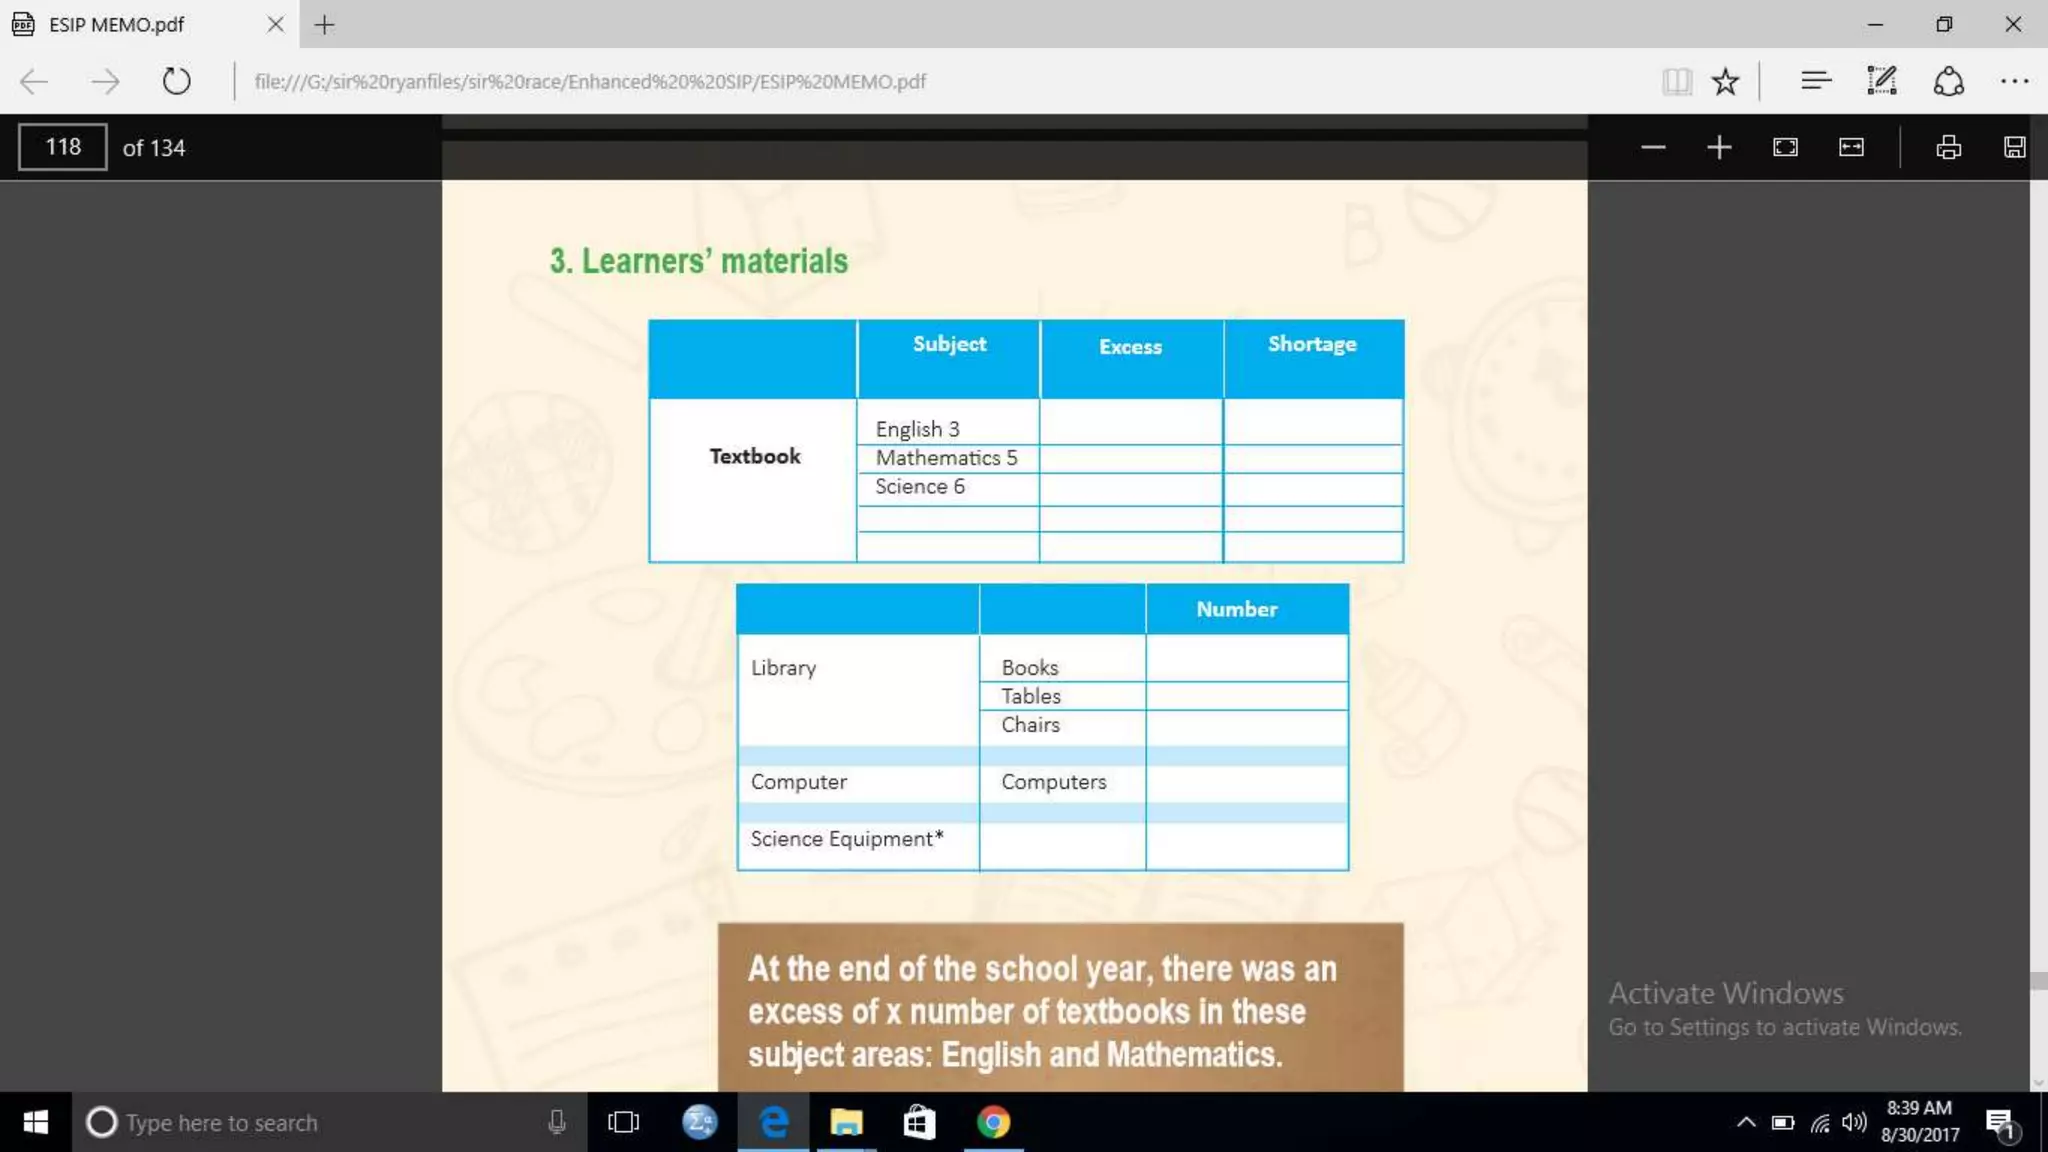
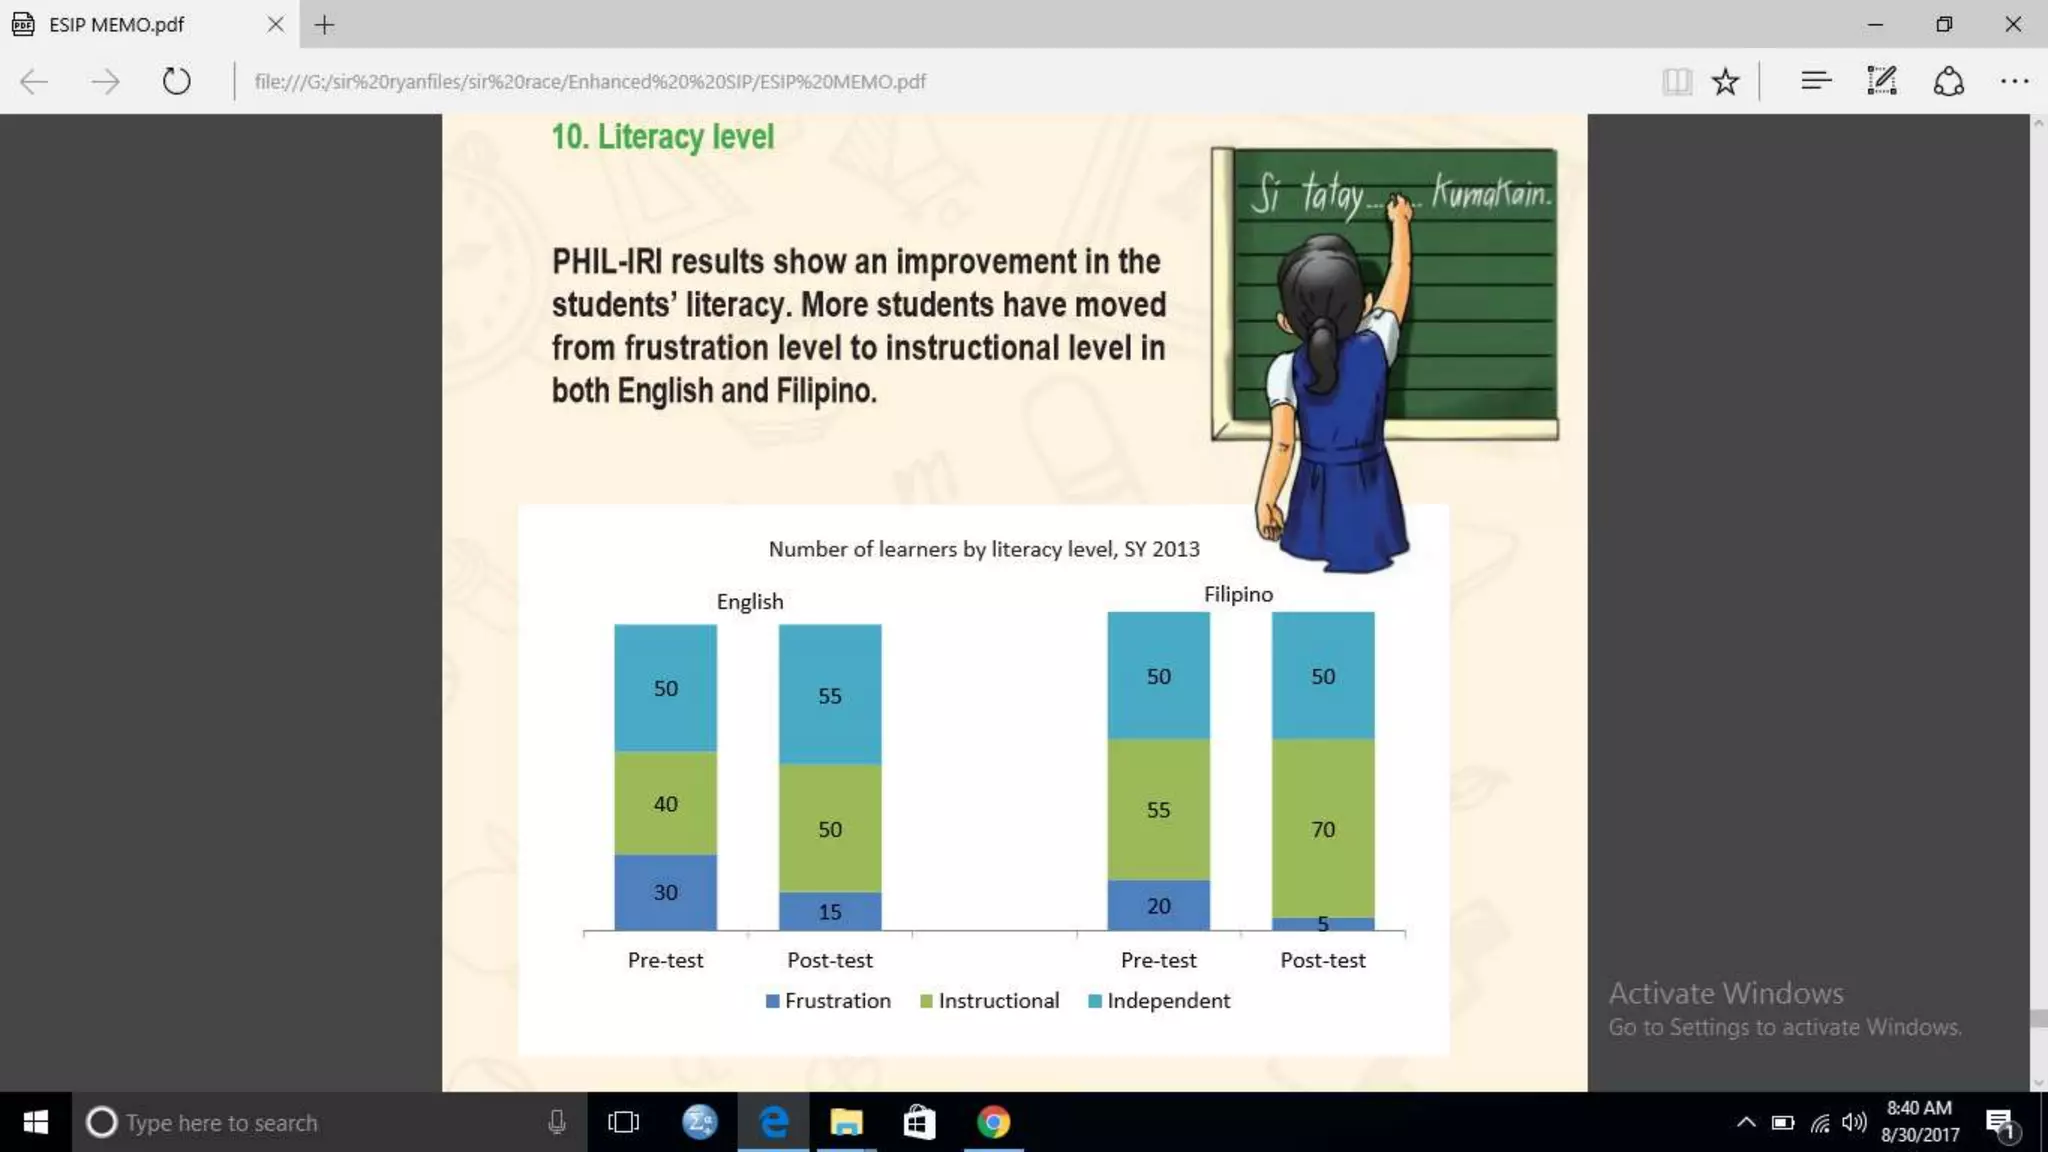
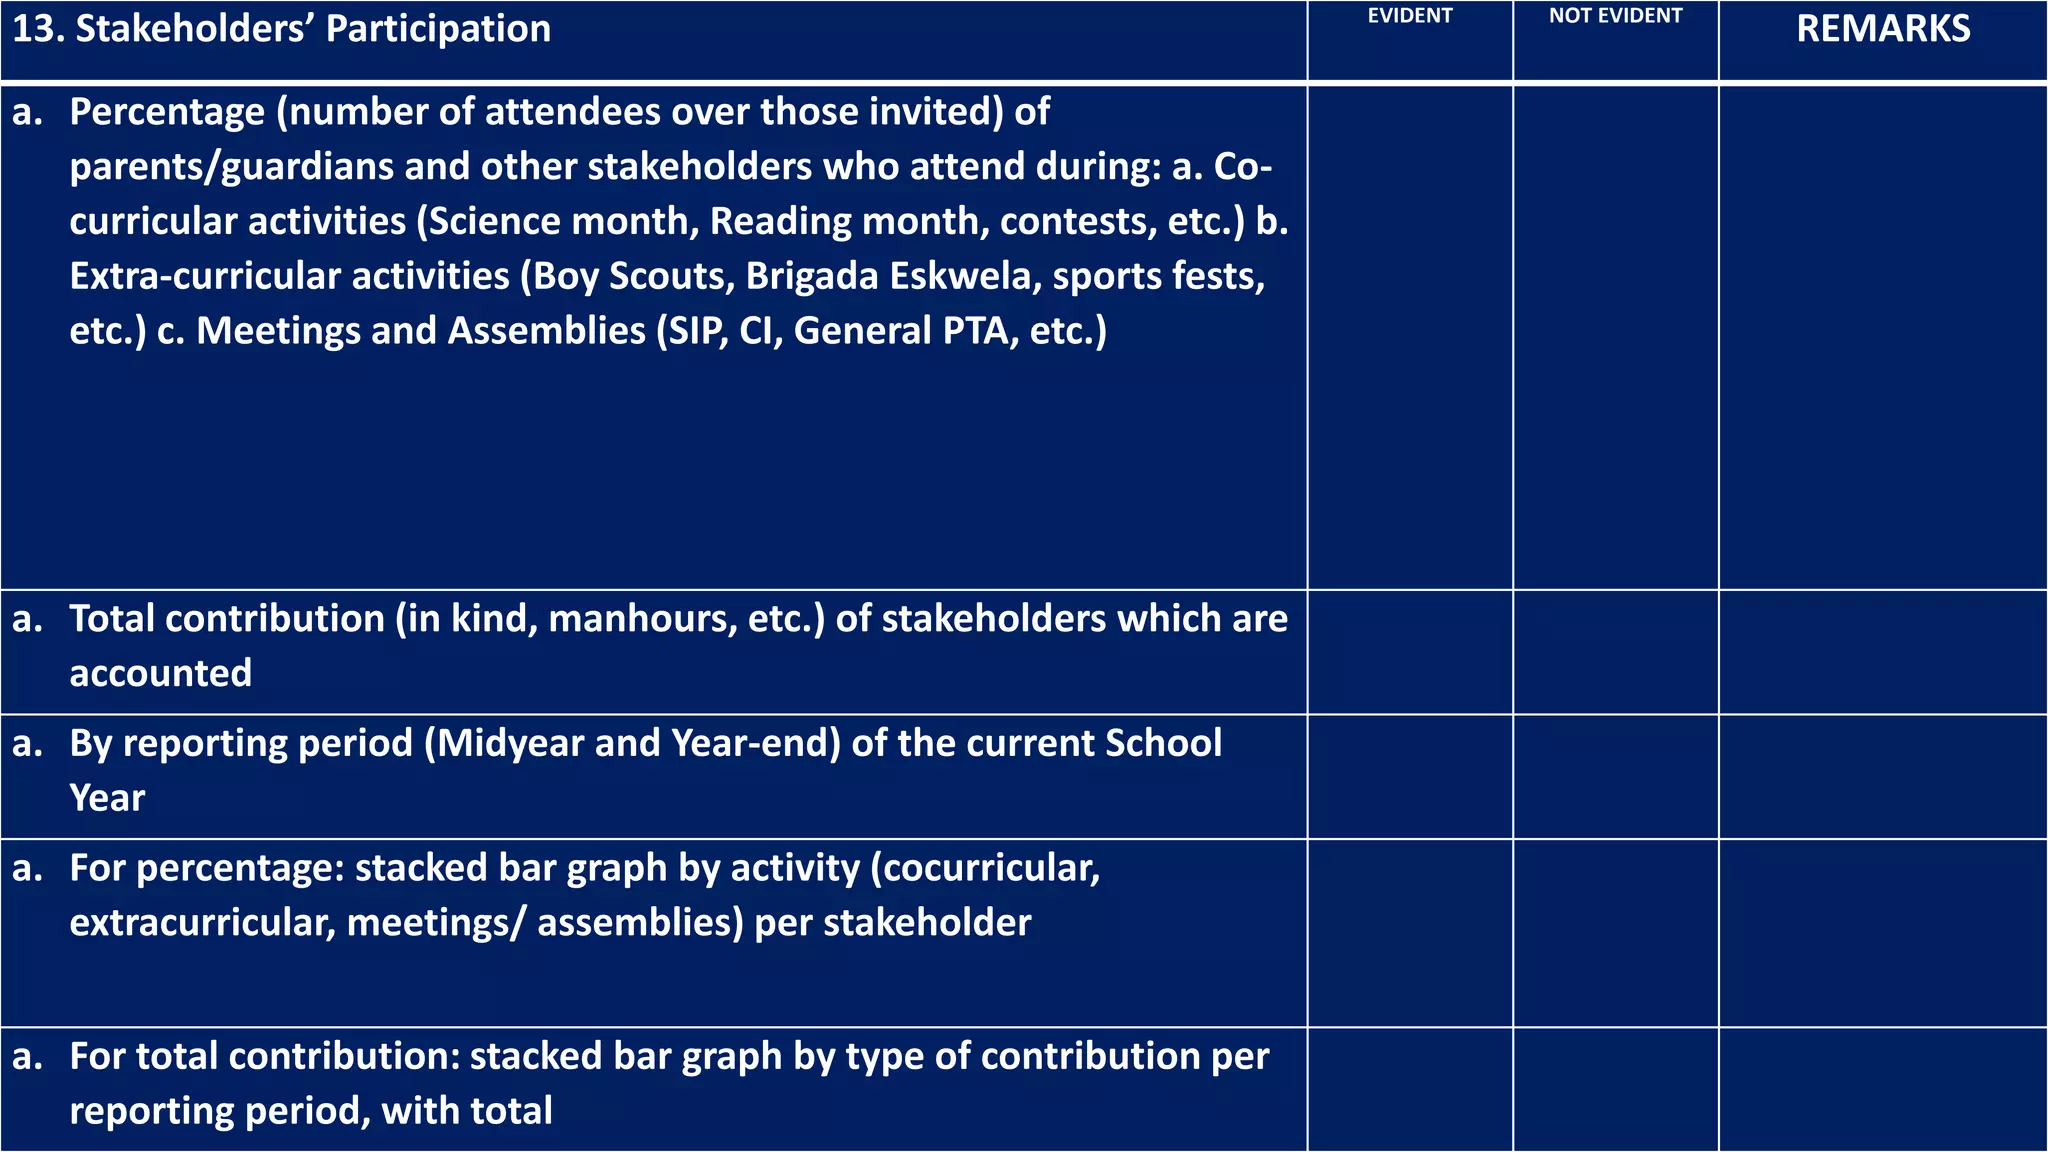
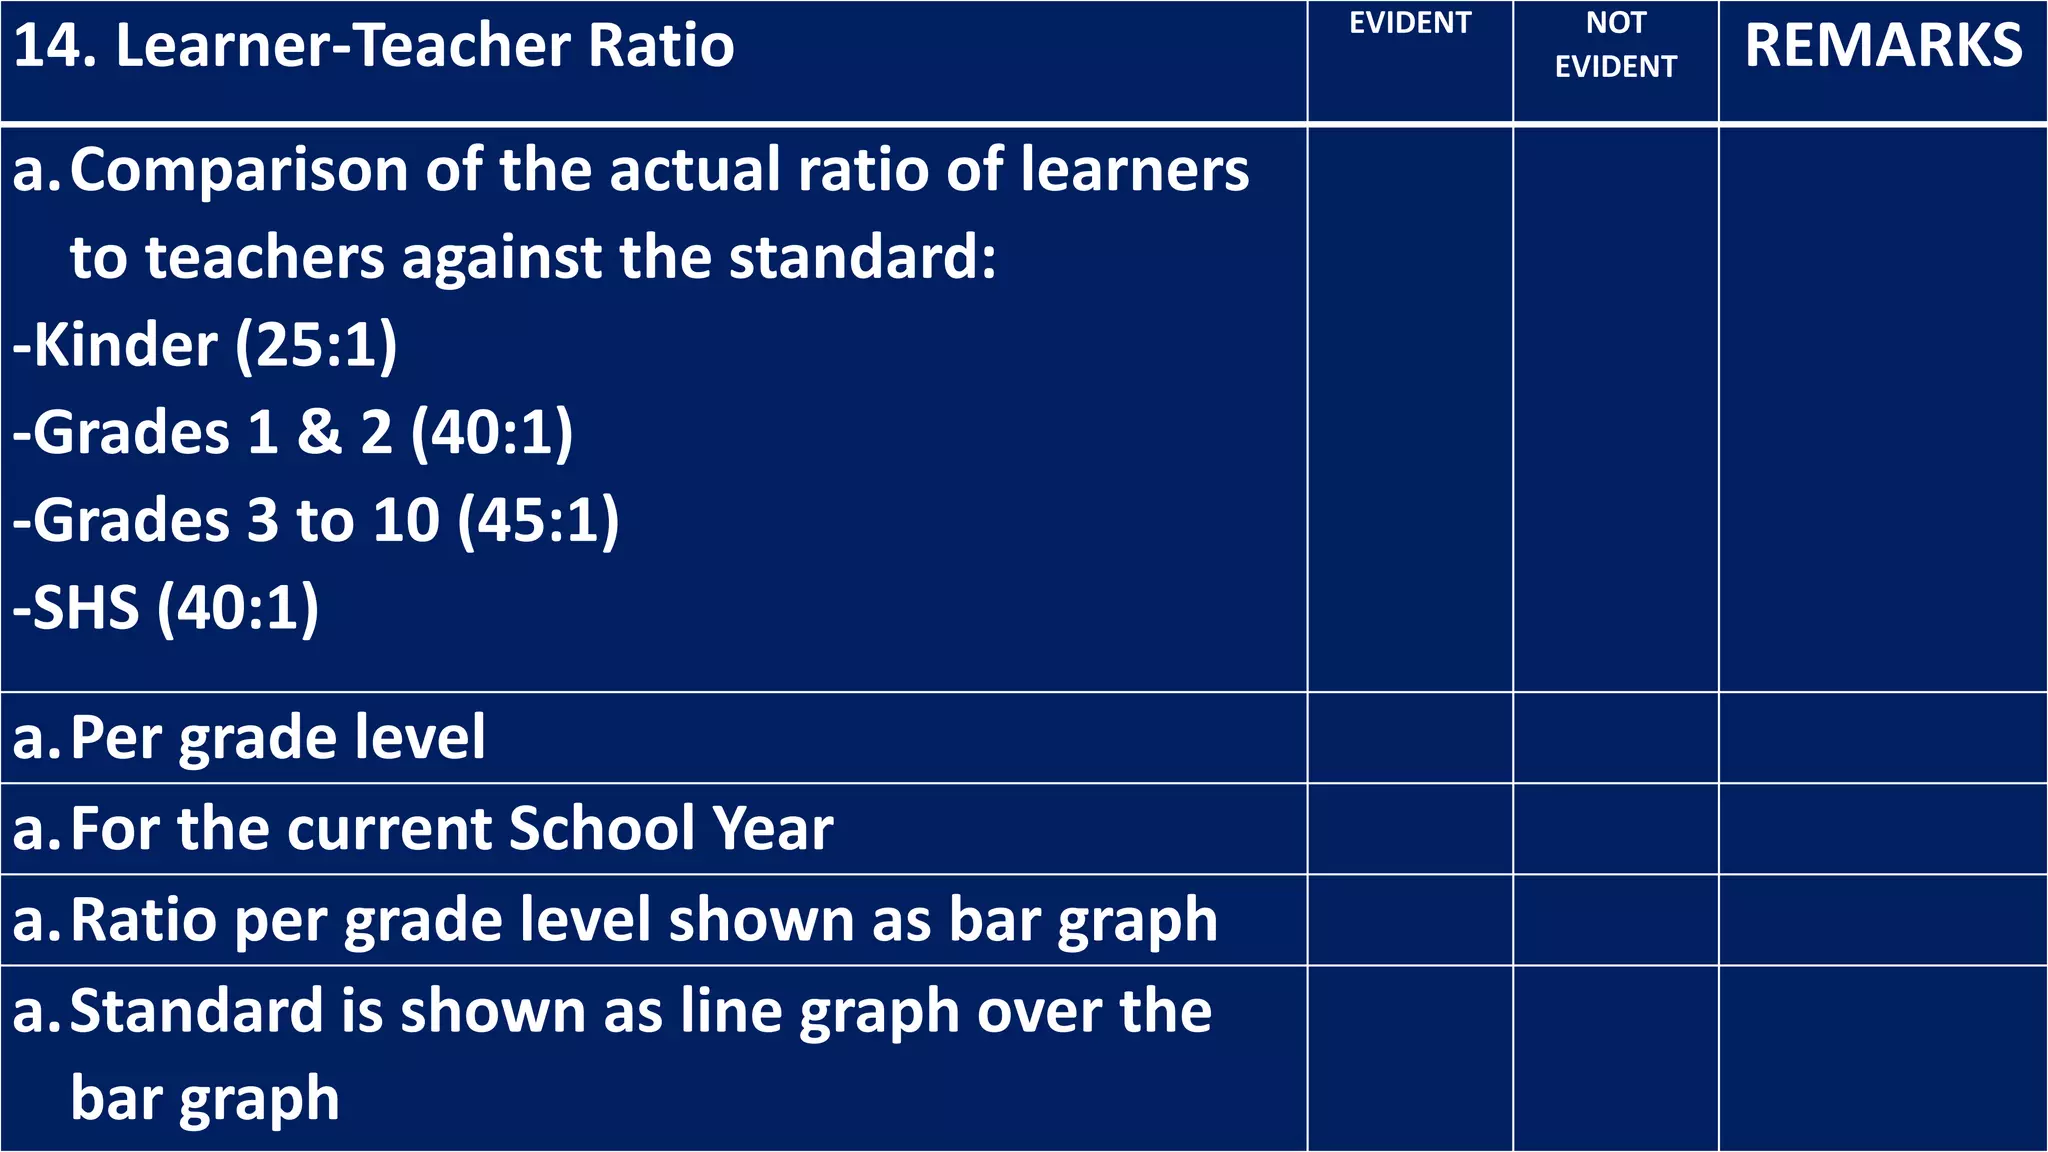
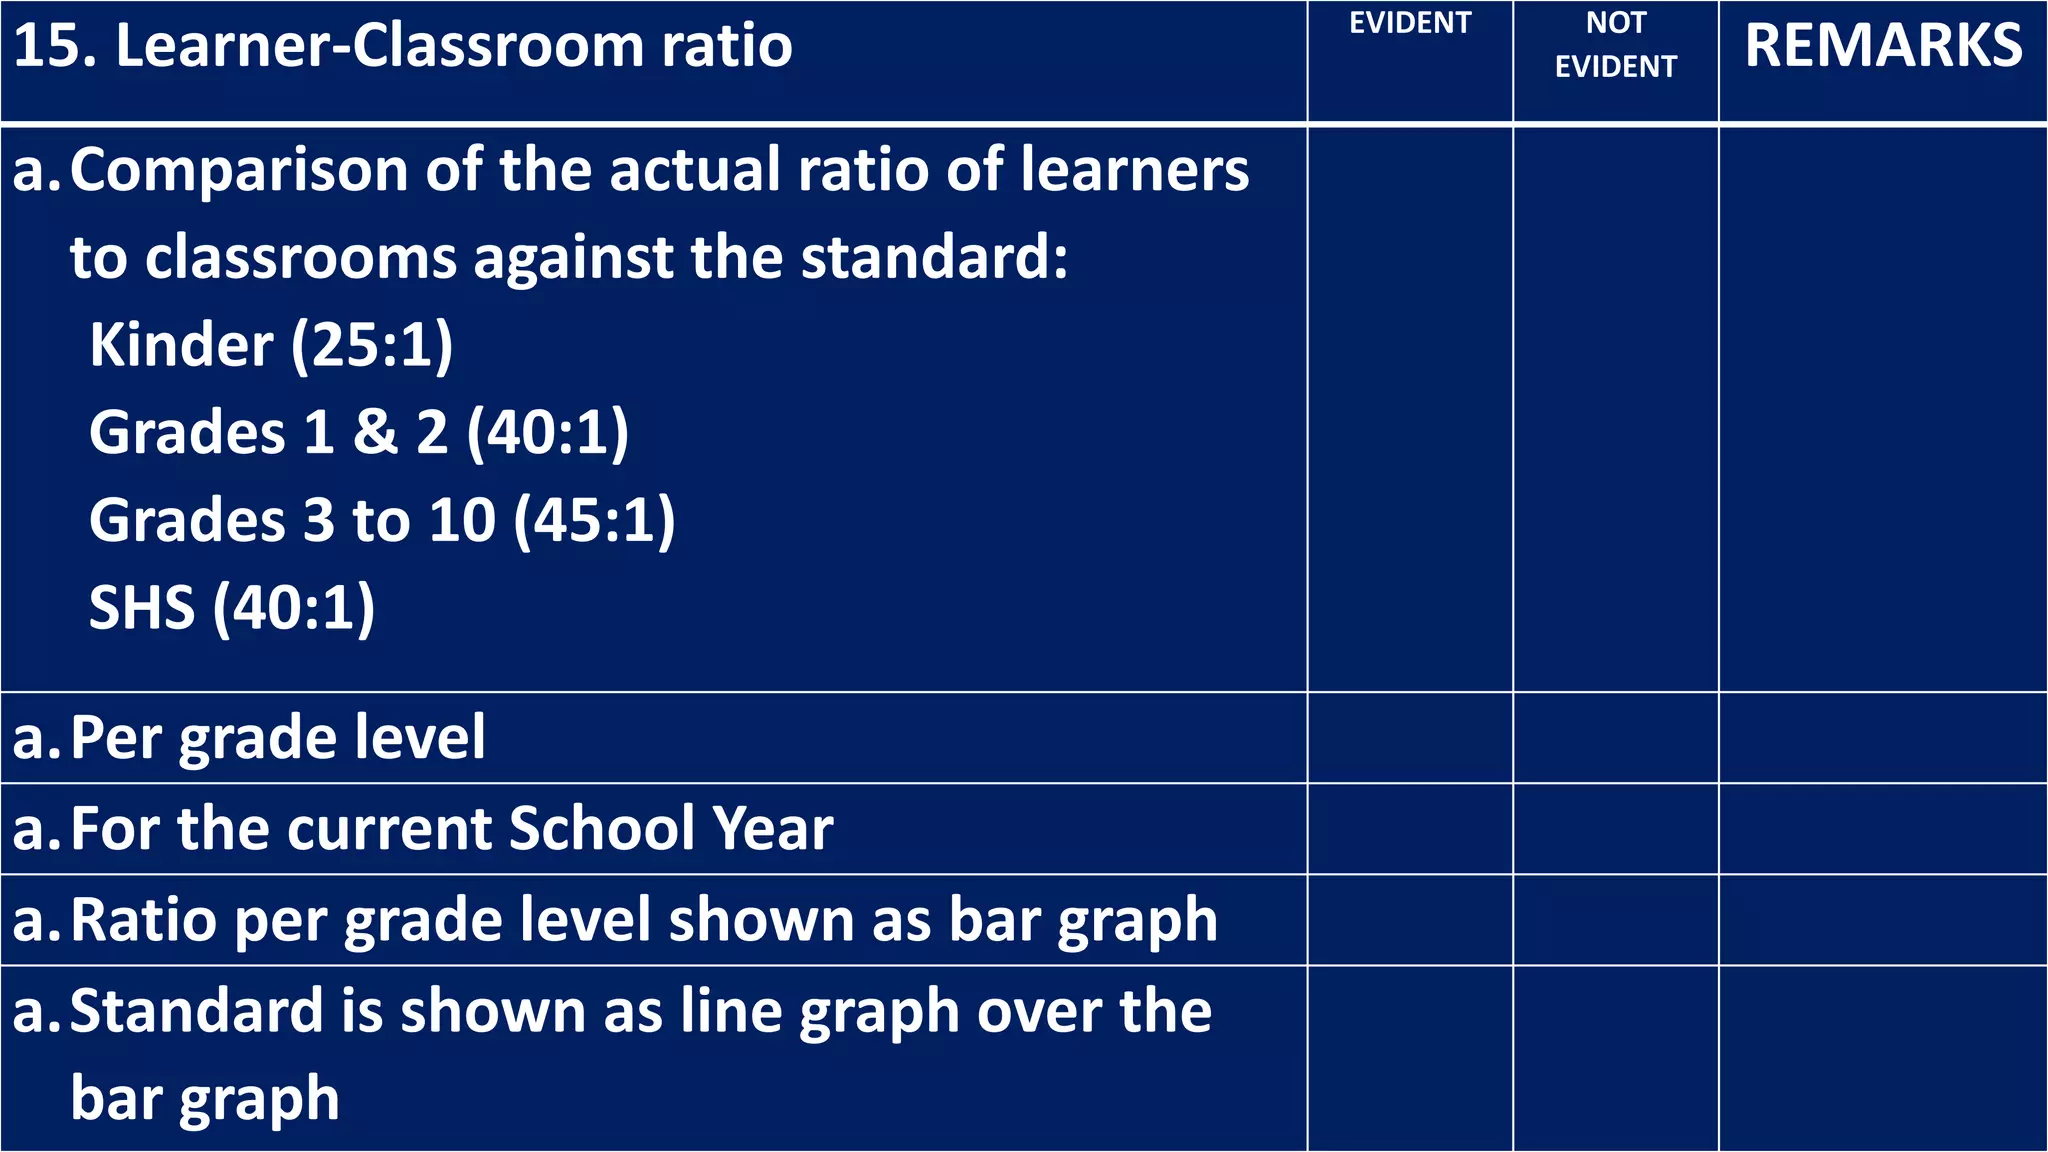
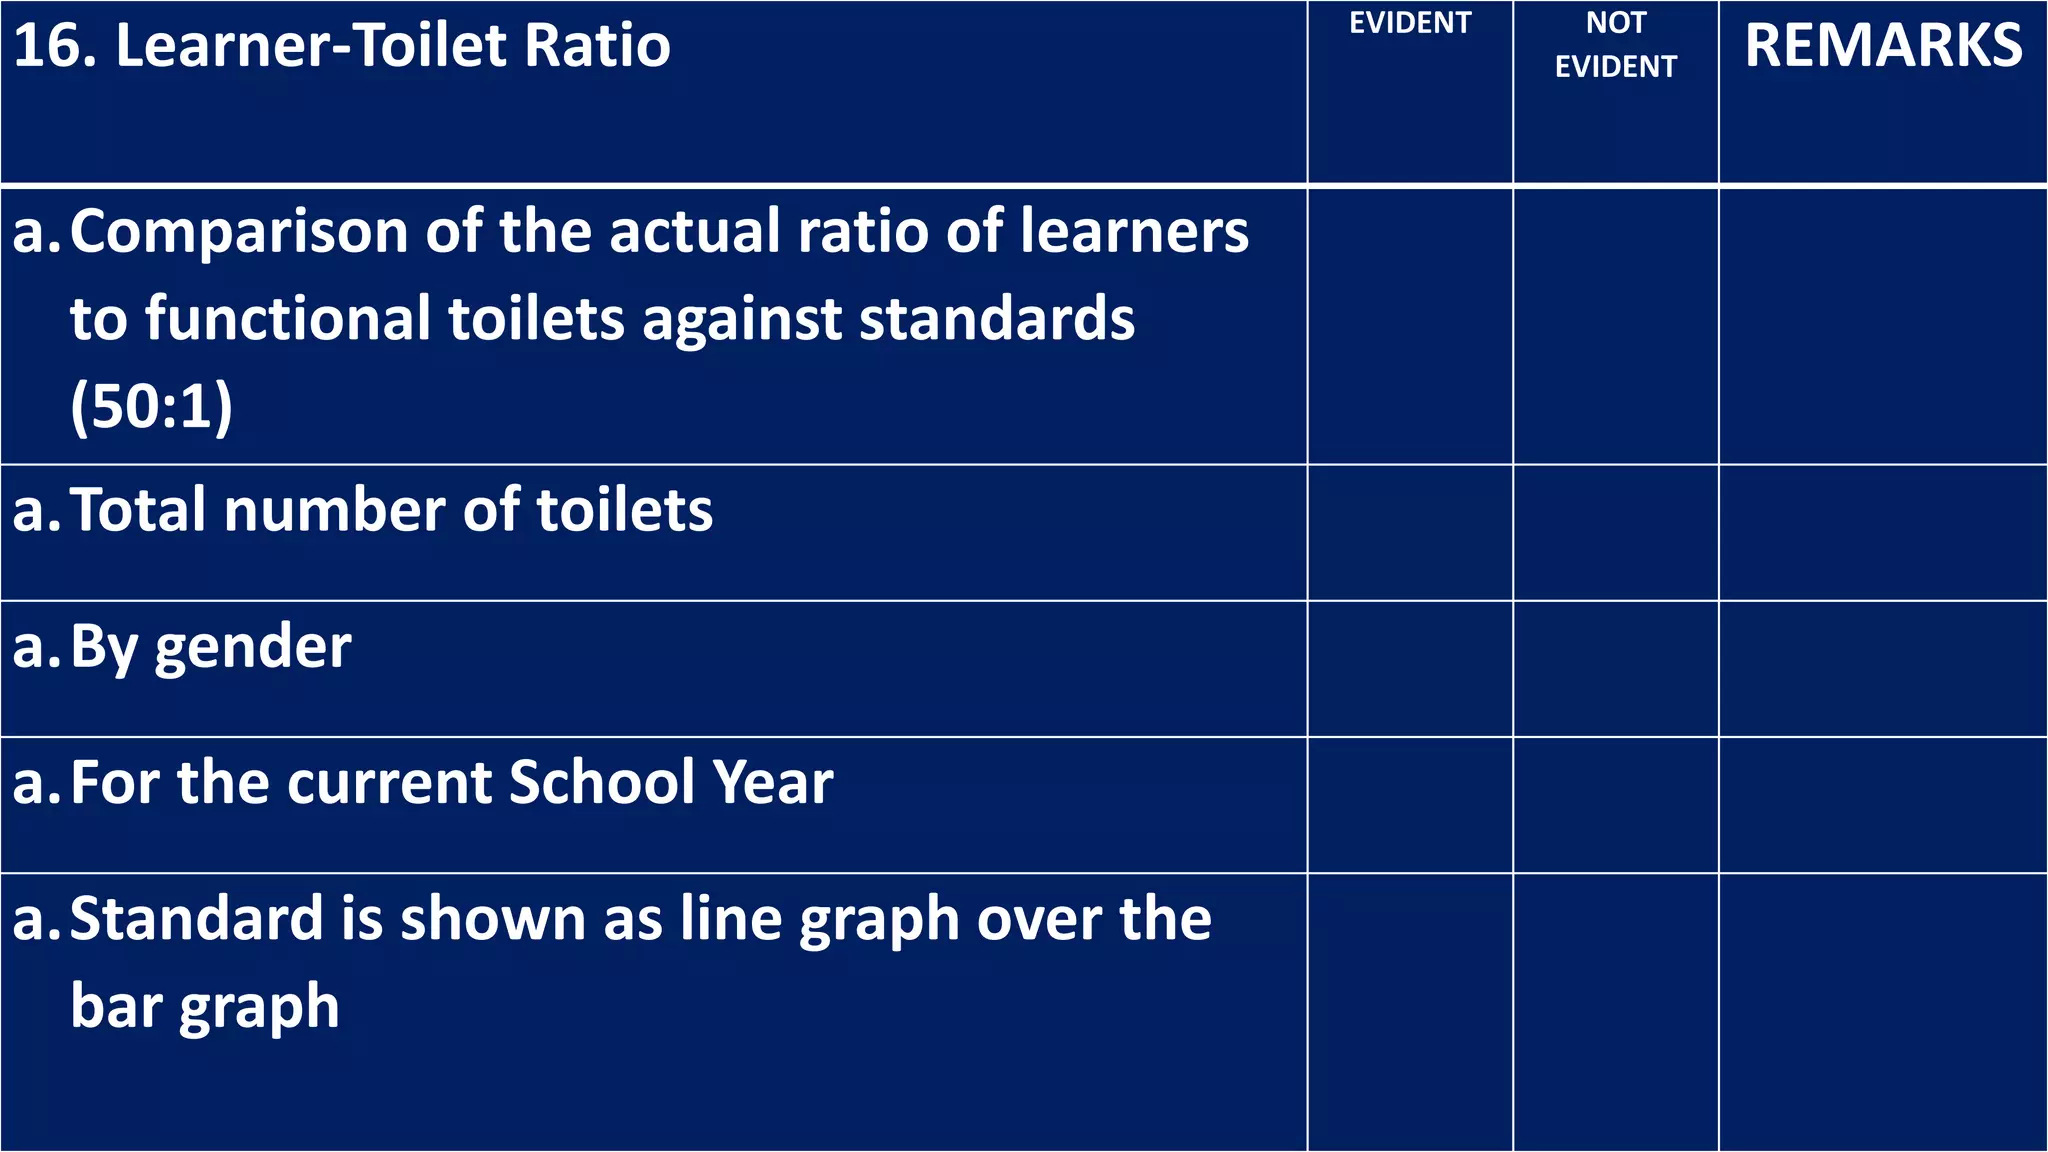
DATA:
1.Enrollment EVIDENT NOT
EVIDENT REMARKS
a.Total No. of Learners Enrolled
a.By Gender
a.For the Last 3 School Years
a.Used End/Middle of School Year Data
a.Used Stacked Bar Graph by Gender
per Year
● Optional: If the school has special programs, they can also present in a separate graph the
enrolment number of the different types of learners by program (e.g. SPED, ADM, ALS, IPEd,
ALIVE) of the current year – schools can show the total for each type of learner
2. Health and Nutritional Status EVIDENT NOT
EVIDENT REMARKS
a.No. of Learners who are Severely Wasted
or Wasted
a.By Gender
a.For Every Key Stage (K-3, 4-6, JHS, SHS)
a.Data are for the Current School Year
a.Used Stacked Bar Graph by Gender per Key
Stage
3. Learners’ Materials EVIDENT NOT EVIDENT
REMARKS
a. The count of shortages/excess learners materials
per grade level is based on what the students are
using during the School Year
a. Only subjects which have shortage/excess
learners materials will be listed per grade level
a. Data are for the current School Year
a. Data are presented using tables per grade level
that show the number of shortage/excess
learners materials (by subjects)
4. Teachers’ Professional Development EVIDENT NOT
EVIDENT REMARKS
a.Number of teachers who attended
training/further studies
a.By kind/type of professional development
(e.g. ICT, Further studies, INSET, LAC, etc)
a.For the current School Year
a.Bar graph by kind/type of professional
development
5. Funding Sources EVIDENT NOT
EVIDENT REMARKS
a.Funding amount and sources (MOOE, LGU,
canteen, donors, etc.)
a.For the current School Year
a.Pie graph by funding source
6. School Awards and Recognitions EVIDENT NOT
EVIDENT REMARKS
a.Top 3 awards/ recognition from award-
giving bodies duly recognized by DepEd
a.Listing by title, award-giving body, level
(school, division, regional, national,
international)
a.Categorized into student, teacher, school
head, and school awards
a.For the current School Year
a.Presented using tables.
7. Number and Rate of Dropouts by Causes EVIDENT NOT EVIDENT
REMARKS
a. Count and percentage of learners who do not
finish a particular grade level. (It does not
capture learners who finish a grade level but do
not enrol in the next grade level the following
school year)
a. Five (5) major causes of dropout in the school
a. For the last 3 years
a. Stacked bar graph by causes per year; percentage
is shown through a line graph over the bar graph
8. Percentage of learners who completed the
School Year (Promotion Rate)
EVIDENT NOT
EVIDENT REMARKS
a.Percentage of learners who completed the
school year (Number of promoted learners
over number of total learners x 100)
a.Per grade level
a.For the current School Year
a.Presented using bar graph
9. National Achievement Test (NAT) – by
Mean Percentage Score (MPS)
EVIDENT NOT
EVIDENT REMARKS
a.MPS per subject
a.Grade 6 or 10 or 12 results
a.For the current School Year
a.Bar graph by MPS of each subject
*Use the average of the 1st, 2nd, 3rd, and 4th Quarterly Assessment
Results (QAR).
10. Literacy Level EVIDENT NOT
EVIDENT REMARKS
a.Total number of learners who are in the
frustration, instructional, and independent
levels for English and Filipino (oral and
silent reading)
a.Should show pre and post test results
a.For the current School Year
a.Bar graphs showing oral and silent reading
results (one for English and Filipino)
* If PHIL-IRI is used, will cover grades 2-6 only
* In the absence of a tool to measure literacy, schools can use PHIL-IRI
results or any existing tool to measure literacy
11. School-Based Management Assessment
Level
EVIDENT NOT
EVIDENT REMARKS
a.SBM Level and its corresponding
qualitative interpretation
12. Child-Friendly School Survey result EVIDENT NOT
EVIDENT REMARKS
a.Points and Status
a.For the current School Year
13. Stakeholders’ Participation EVIDENT NOT EVIDENT
REMARKS
a. Percentage (number of attendees over those invited) of
parents/guardians and other stakeholders who attend during: a. Co-
curricular activities (Science month, Reading month, contests, etc.) b.
Extra-curricular activities (Boy Scouts, Brigada Eskwela, sports fests,
etc.) c. Meetings and Assemblies (SIP, CI, General PTA, etc.)
a. Total contribution (in kind, manhours, etc.) of stakeholders which are
accounted
a. By reporting period (Midyear and Year-end) of the current School
Year
a. For percentage: stacked bar graph by activity (cocurricular,
extracurricular, meetings/ assemblies) per stakeholder
a. For total contribution: stacked bar graph by type of contribution per
reporting period, with total
14. Learner-Teacher Ratio EVIDENT NOT
EVIDENT REMARKS
a.Comparison of the actual ratio of learners
to teachers against the standard:
-Kinder (25:1)
-Grades 1 & 2 (40:1)
-Grades 3 to 10 (45:1)
-SHS (40:1)
a.Per grade level
a.For the current School Year
a.Ratio per grade level shown as bar graph
a.Standard is shown as line graph over the
bar graph
15. Learner-Classroom ratio EVIDENT NOT
EVIDENT REMARKS
a.Comparison of the actual ratio of learners
to classrooms against the standard:
Kinder (25:1)
Grades 1 & 2 (40:1)
Grades 3 to 10 (45:1)
SHS (40:1)
a.Per grade level
a.For the current School Year
a.Ratio per grade level shown as bar graph
a.Standard is shown as line graph over the
bar graph
16. Learner-Toilet Ratio EVIDENT NOT
EVIDENT REMARKS
a.Comparison of the actual ratio of learners
to functional toilets against standards
(50:1)
a.Total number of toilets
a.By gender
a.For the current School Year
a.Standard is shown as line graph over the
bar graph
17. Learner-Seat Ratio EVIDENT NOT
EVIDENT REMARKS
a.Comparison of the actual ratio of learners
to seats against the standard (1:1)
a.Total number of chairs
a.For the current School Year
a.Standard is shown as line graph over the
bar graph
18. Status of Annual Implementation Plan
(AIP)/Continuous Improvement (CI) Projects*
EVIDENT NOT
EVIDENT REMARKS
a.Top three (3) Priority Projects
a.Target vs. Actual Accomplishment
a.Percent of accomplishment based on the
target
19. Other Stakeholders’ Accomplishments EVIDENT NOT
EVIDENT REMARKS
a.Top three (3) stakeholders’
accomplishments/initiatives/activities
* Initiatives/activities independent from the PIA/CI projects (e.g.
activities of the SGC, SPG/SSG, etc.)
SRC-DATA.pptx

SRC-DATA.pptx

  • 1.
    DATA: 1.Enrollment EVIDENT NOT EVIDENTREMARKS a.Total No. of Learners Enrolled a.By Gender a.For the Last 3 School Years a.Used End/Middle of School Year Data a.Used Stacked Bar Graph by Gender per Year ● Optional: If the school has special programs, they can also present in a separate graph the enrolment number of the different types of learners by program (e.g. SPED, ADM, ALS, IPEd, ALIVE) of the current year – schools can show the total for each type of learner
  • 3.
    2. Health andNutritional Status EVIDENT NOT EVIDENT REMARKS a.No. of Learners who are Severely Wasted or Wasted a.By Gender a.For Every Key Stage (K-3, 4-6, JHS, SHS) a.Data are for the Current School Year a.Used Stacked Bar Graph by Gender per Key Stage
  • 5.
    3. Learners’ MaterialsEVIDENT NOT EVIDENT REMARKS a. The count of shortages/excess learners materials per grade level is based on what the students are using during the School Year a. Only subjects which have shortage/excess learners materials will be listed per grade level a. Data are for the current School Year a. Data are presented using tables per grade level that show the number of shortage/excess learners materials (by subjects)
  • 7.
    4. Teachers’ ProfessionalDevelopment EVIDENT NOT EVIDENT REMARKS a.Number of teachers who attended training/further studies a.By kind/type of professional development (e.g. ICT, Further studies, INSET, LAC, etc) a.For the current School Year a.Bar graph by kind/type of professional development
  • 9.
    5. Funding SourcesEVIDENT NOT EVIDENT REMARKS a.Funding amount and sources (MOOE, LGU, canteen, donors, etc.) a.For the current School Year a.Pie graph by funding source
  • 11.
    6. School Awardsand Recognitions EVIDENT NOT EVIDENT REMARKS a.Top 3 awards/ recognition from award- giving bodies duly recognized by DepEd a.Listing by title, award-giving body, level (school, division, regional, national, international) a.Categorized into student, teacher, school head, and school awards a.For the current School Year a.Presented using tables.
  • 13.
    7. Number andRate of Dropouts by Causes EVIDENT NOT EVIDENT REMARKS a. Count and percentage of learners who do not finish a particular grade level. (It does not capture learners who finish a grade level but do not enrol in the next grade level the following school year) a. Five (5) major causes of dropout in the school a. For the last 3 years a. Stacked bar graph by causes per year; percentage is shown through a line graph over the bar graph
  • 15.
    8. Percentage oflearners who completed the School Year (Promotion Rate) EVIDENT NOT EVIDENT REMARKS a.Percentage of learners who completed the school year (Number of promoted learners over number of total learners x 100) a.Per grade level a.For the current School Year a.Presented using bar graph
  • 17.
    9. National AchievementTest (NAT) – by Mean Percentage Score (MPS) EVIDENT NOT EVIDENT REMARKS a.MPS per subject a.Grade 6 or 10 or 12 results a.For the current School Year a.Bar graph by MPS of each subject *Use the average of the 1st, 2nd, 3rd, and 4th Quarterly Assessment Results (QAR).
  • 19.
    10. Literacy LevelEVIDENT NOT EVIDENT REMARKS a.Total number of learners who are in the frustration, instructional, and independent levels for English and Filipino (oral and silent reading) a.Should show pre and post test results a.For the current School Year a.Bar graphs showing oral and silent reading results (one for English and Filipino) * If PHIL-IRI is used, will cover grades 2-6 only * In the absence of a tool to measure literacy, schools can use PHIL-IRI results or any existing tool to measure literacy
  • 21.
    11. School-Based ManagementAssessment Level EVIDENT NOT EVIDENT REMARKS a.SBM Level and its corresponding qualitative interpretation 12. Child-Friendly School Survey result EVIDENT NOT EVIDENT REMARKS a.Points and Status a.For the current School Year
  • 23.
    13. Stakeholders’ ParticipationEVIDENT NOT EVIDENT REMARKS a. Percentage (number of attendees over those invited) of parents/guardians and other stakeholders who attend during: a. Co- curricular activities (Science month, Reading month, contests, etc.) b. Extra-curricular activities (Boy Scouts, Brigada Eskwela, sports fests, etc.) c. Meetings and Assemblies (SIP, CI, General PTA, etc.) a. Total contribution (in kind, manhours, etc.) of stakeholders which are accounted a. By reporting period (Midyear and Year-end) of the current School Year a. For percentage: stacked bar graph by activity (cocurricular, extracurricular, meetings/ assemblies) per stakeholder a. For total contribution: stacked bar graph by type of contribution per reporting period, with total
  • 25.
    14. Learner-Teacher RatioEVIDENT NOT EVIDENT REMARKS a.Comparison of the actual ratio of learners to teachers against the standard: -Kinder (25:1) -Grades 1 & 2 (40:1) -Grades 3 to 10 (45:1) -SHS (40:1) a.Per grade level a.For the current School Year a.Ratio per grade level shown as bar graph a.Standard is shown as line graph over the bar graph
  • 27.
    15. Learner-Classroom ratioEVIDENT NOT EVIDENT REMARKS a.Comparison of the actual ratio of learners to classrooms against the standard: Kinder (25:1) Grades 1 & 2 (40:1) Grades 3 to 10 (45:1) SHS (40:1) a.Per grade level a.For the current School Year a.Ratio per grade level shown as bar graph a.Standard is shown as line graph over the bar graph
  • 29.
    16. Learner-Toilet RatioEVIDENT NOT EVIDENT REMARKS a.Comparison of the actual ratio of learners to functional toilets against standards (50:1) a.Total number of toilets a.By gender a.For the current School Year a.Standard is shown as line graph over the bar graph
  • 31.
    17. Learner-Seat RatioEVIDENT NOT EVIDENT REMARKS a.Comparison of the actual ratio of learners to seats against the standard (1:1) a.Total number of chairs a.For the current School Year a.Standard is shown as line graph over the bar graph
  • 33.
    18. Status ofAnnual Implementation Plan (AIP)/Continuous Improvement (CI) Projects* EVIDENT NOT EVIDENT REMARKS a.Top three (3) Priority Projects a.Target vs. Actual Accomplishment a.Percent of accomplishment based on the target
  • 35.
    19. Other Stakeholders’Accomplishments EVIDENT NOT EVIDENT REMARKS a.Top three (3) stakeholders’ accomplishments/initiatives/activities * Initiatives/activities independent from the PIA/CI projects (e.g. activities of the SGC, SPG/SSG, etc.)