This document contains data and performance targets for DepEd Zambales across several key areas:
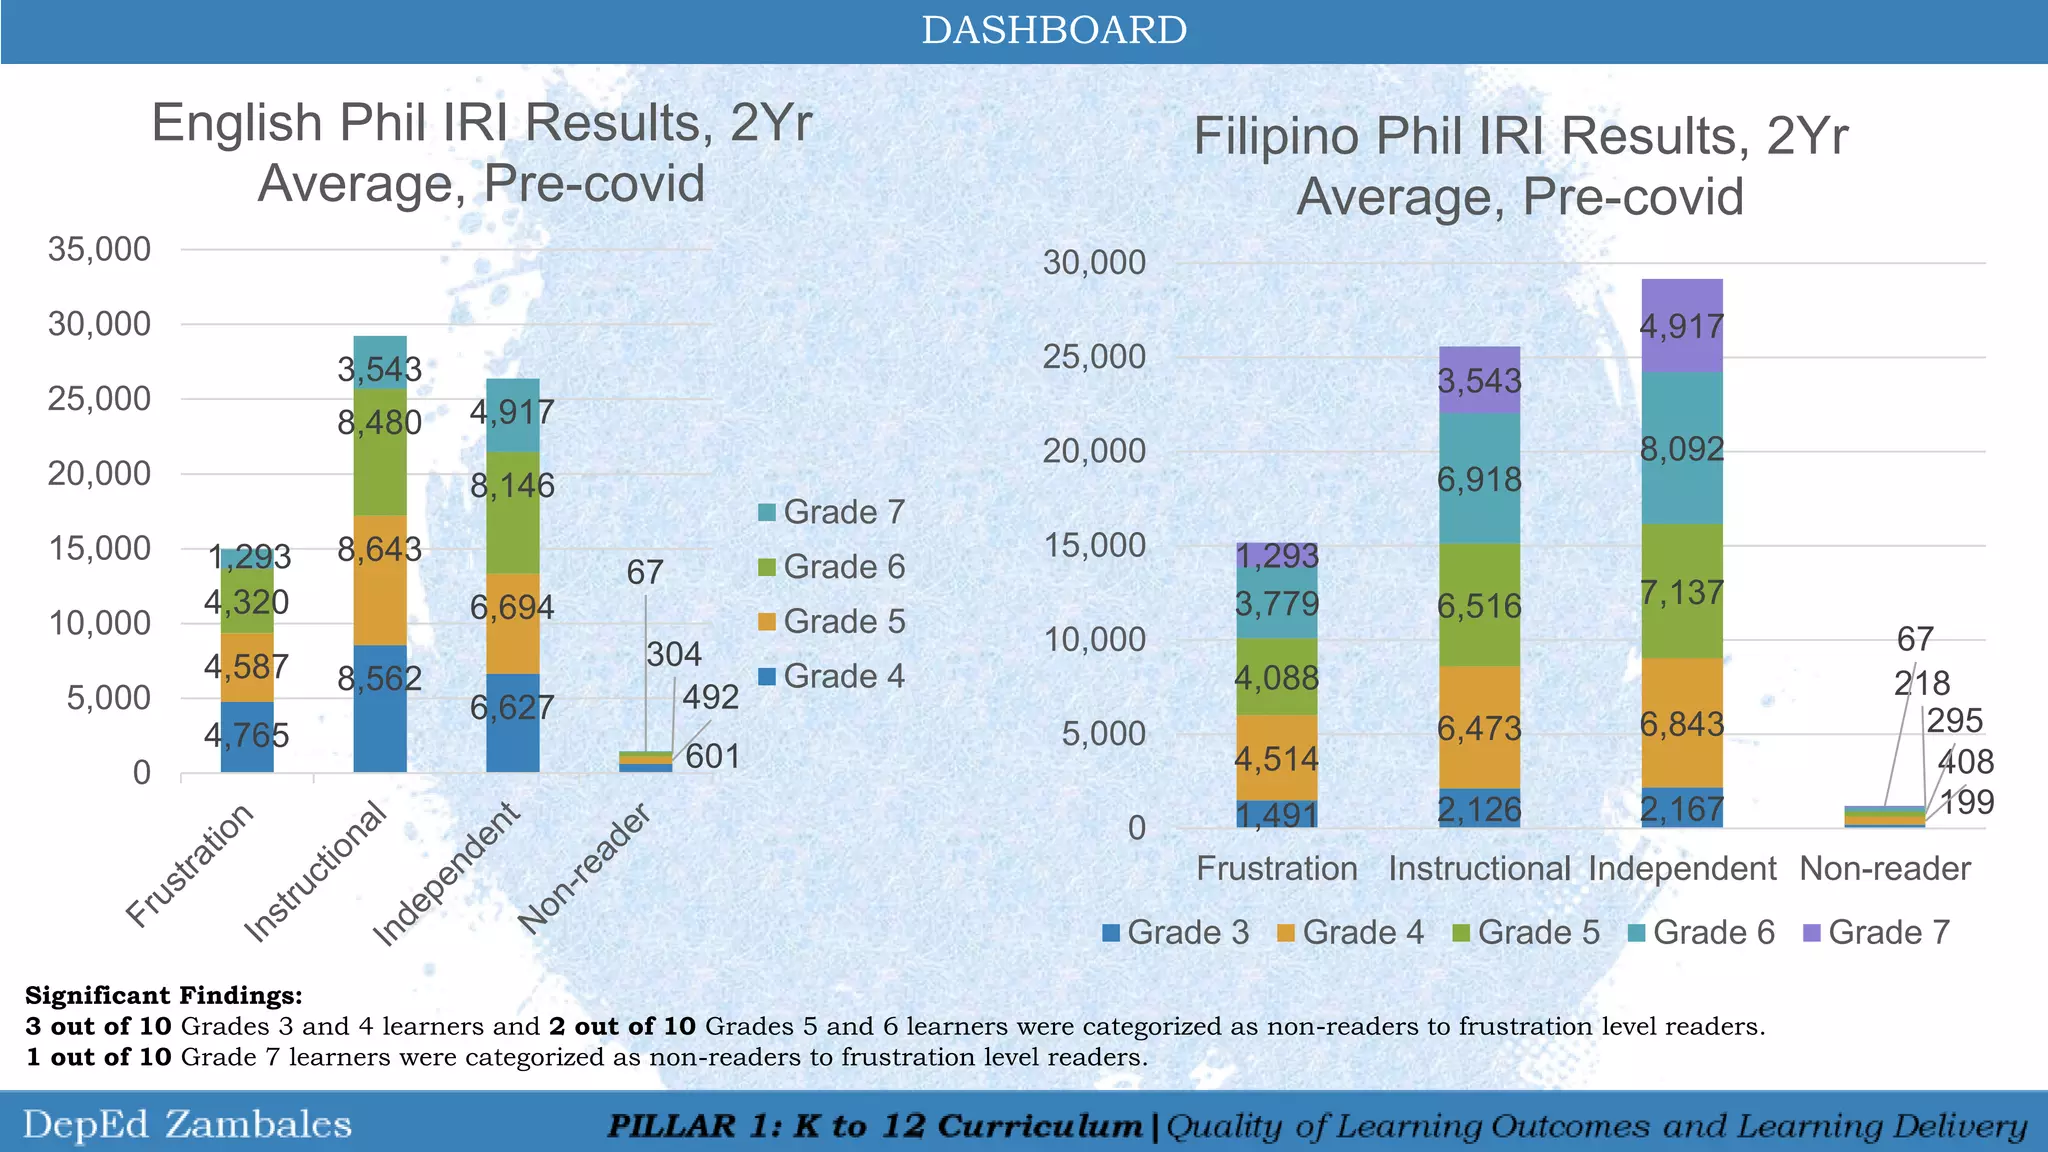
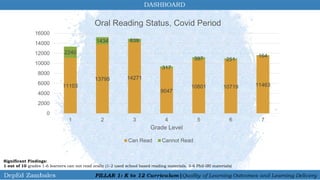
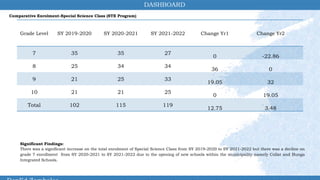
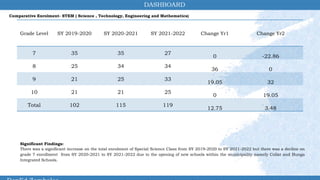
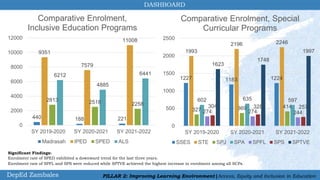
- Reading proficiency data from pre-Covid shows many students reading below grade level. Enrollment increased across programs but declined in some grades and programs.
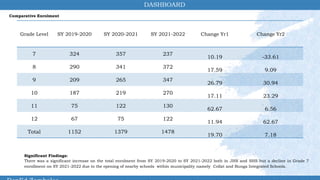
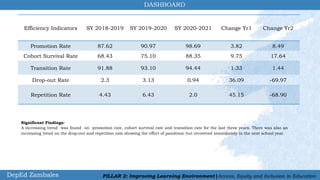
- Efficiency indicators like promotion and completion rates increased from 2018-2021 while dropout and repetition decreased.
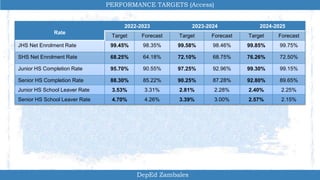
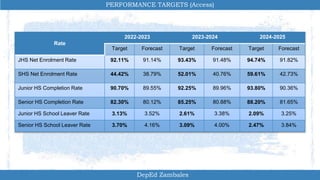
- Access targets forecast steady increases in net enrollment and completion rates for JHS and SHS through 2025.
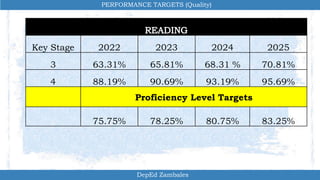
- Quality targets predict increases in proficiency levels at Key Stages 3 and 4 through 2025.
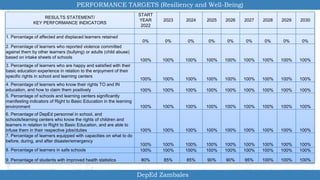
- Resiliency targets aim for 100% achievement across indicators of rights, preparedness, and safety through 2030.