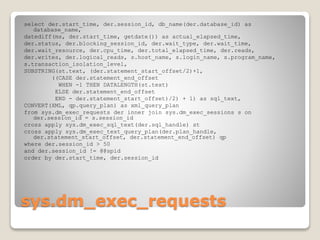
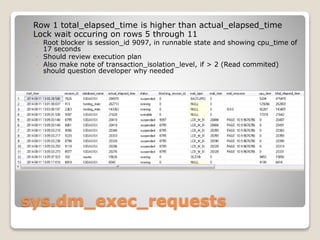
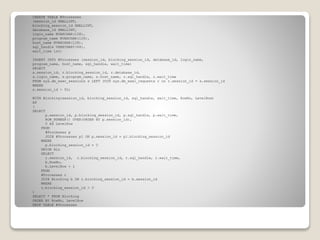
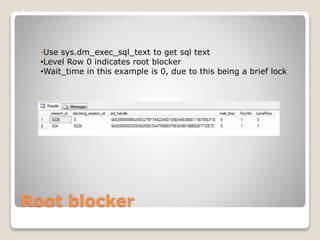
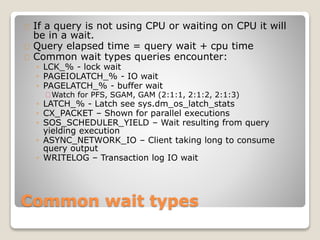
Dynamic Management Views (DMVs) provide a wealth of information for identifying and tuning poorly performing SQL. This presentation describe approaches to using DMV's to proactively or reactively tune SQL Server. This presentation also describe some of the blind spots or potentially inaccuracies that may exist in the DMV data.
This is the presentation on ASH that I did with Graham Wood at RMOUG 2014 and that represents the final best effort to capture essential and advanced ASH content as started in a presentation Uri Shaft and I gave at a small conference in Denmark sometime in 2012 perhaps. The presentation is also available publicly through the RMOUG website, so I felt at liberty to post it myself here. If it disappears it would likely be because I have been asked to remove it by Oracle.
About the course:
This Oracle performance tuning online course is designed for the audience who want to learn basics and core concepts of Oracle PT. You will be learning about Introduction, basic tuning diagnostics, how to use automatic workload repository, defining of problems, how to create AWR baselines, monitoring of applications Etc. All Oracle performance tuning classes will be live and interactive.
Course Target:
Oracle performance tuning online training is designed to teach you fundamentals of PT.
Understand basic tuning diagnostics.
Learn how to use Automatic workload repository.
Obtain knowledge of using metrics and alerts.
Clear understanding of how to monitor applications.
Need to identify problem SQL statements
Learn how to influence the optimizer.
Understand SQL performance management.
Tuning the shared pool, I/0, Buffer cache, PGA and temporary space.
Course Targeted Audience:
Any candidate can join our Oracle performance tuning online course.
People who are from professional background can join.
Researches can also participate in this course.
Prerequisites:
Candidates with basic knowledge of computer.
Basics of database are recommended.
Training Format:
Kernel Training provides Oracle performance tuning online course led by real time expert.
Registered Candidates can interact with instructor in live interactive sessions.
Candidates will have life time access to learning material.
Companies Using Oracle PT:
Major international IT companies perform Oracle performance tuning for their operations.
Design and develop with performance in mind
Establish a tuning environment
Index wisely
Reduce parsing
Take advantage of Cost Based Optimizer
Avoid accidental table scans
Optimize necessary table scans
Optimize joins
Use array processing
Consider PL/SQL for “tricky” SQL
In this practical and script-focused session, Presenter William Assaf discusses best practices regarding SQL Server administration, maintenance, optimizations and monitoring using Dynamic Management Views. DMV's are essential tools for the SQL administrator, but have a wide range of applications by developers, network engineers and DBAs.
It Depends - Database admin for developers - Rev 20151205Maggie Pint
Do you feel like most interactions with your DBA/IT team result in statement ""It Depends""? Do you wonder what metrics your DBA is evaluating to make assertions about the system? Do you want to know key tips for performance tuning applications? A former DBA turned full-stack web developer will take you through some of the metrics and tools that DBAs use to evaluate performance so that you can more easily communicate with your DBA or troubleshoot your SQL server personally.
PostgreSQL High-Performance Cheat Sheets contains quick methods to find performance issues.
Summary of the course so that when problems arise, you are able to easily uncover what are the performance bottlenecks.
Ajuste (tuning) del rendimiento de SQL Server 2008Eduardo Castro
En el siguiente webcast http://msevents.microsoft.com/CUI/EventDetail.aspx?EventID=1032438450&Culture=es-AR analizamos las herramientas de desempeño de SQL Server 2008 y cómo utilizarlas.
Saludos,
Ing. Eduardo Castro Martínez, PhD – Microsoft SQL Server MVP
http://mswindowscr.org
http://comunidadwindows.org
Costa Rica
Technorati Tags: SQL Server
LiveJournal Tags: SQL Server
del.icio.us Tags: SQL Server
http://ecastrom.blogspot.com
http://ecastrom.wordpress.com
http://ecastrom.spaces.live.com
http://universosql.blogspot.com
http://todosobresql.blogspot.com
http://todosobresqlserver.wordpress.com
http://mswindowscr.org/blogs/sql/default.aspx
http://citicr.org/blogs/noticias/default.aspx
http://sqlserverpedia.blogspot.com/
Les comparto la presentación utilizada en la charla sobre optimización de desempeño de SQL Server.
Saludos,
Eduardo Castro Martinez
http://ecastrom.blogspot.com
http://comunidadwindows.org
Optimizing the queries you send to the database can greatly increase the database's performance, but what do you know about all those strange MySQL variables that can be played with to get even more power from the database? Join me as we go over some of the basics of the various MySQL settings you can twitch, tweak and massage to get the most out of your MySQL server.
Similar to SQL Server Performance Tuning with DMVs (20)
Adjusting primitives for graph : SHORT REPORT / NOTESSubhajit Sahu
Graph algorithms, like PageRank Compressed Sparse Row (CSR) is an adjacency-list based graph representation that is
Multiply with different modes (map)
1. Performance of sequential execution based vs OpenMP based vector multiply.
2. Comparing various launch configs for CUDA based vector multiply.
Sum with different storage types (reduce)
1. Performance of vector element sum using float vs bfloat16 as the storage type.
Sum with different modes (reduce)
1. Performance of sequential execution based vs OpenMP based vector element sum.
2. Performance of memcpy vs in-place based CUDA based vector element sum.
3. Comparing various launch configs for CUDA based vector element sum (memcpy).
4. Comparing various launch configs for CUDA based vector element sum (in-place).
Sum with in-place strategies of CUDA mode (reduce)
1. Comparing various launch configs for CUDA based vector element sum (in-place).
06-04-2024 - NYC Tech Week - Discussion on Vector Databases, Unstructured Data and AI
Round table discussion of vector databases, unstructured data, ai, big data, real-time, robots and Milvus.
A lively discussion with NJ Gen AI Meetup Lead, Prasad and Procure.FYI's Co-Found
Levelwise PageRank with Loop-Based Dead End Handling Strategy : SHORT REPORT ...Subhajit Sahu
Abstract — Levelwise PageRank is an alternative method of PageRank computation which decomposes the input graph into a directed acyclic block-graph of strongly connected components, and processes them in topological order, one level at a time. This enables calculation for ranks in a distributed fashion without per-iteration communication, unlike the standard method where all vertices are processed in each iteration. It however comes with a precondition of the absence of dead ends in the input graph. Here, the native non-distributed performance of Levelwise PageRank was compared against Monolithic PageRank on a CPU as well as a GPU. To ensure a fair comparison, Monolithic PageRank was also performed on a graph where vertices were split by components. Results indicate that Levelwise PageRank is about as fast as Monolithic PageRank on the CPU, but quite a bit slower on the GPU. Slowdown on the GPU is likely caused by a large submission of small workloads, and expected to be non-issue when the computation is performed on massive graphs.
Chatty Kathy - UNC Bootcamp Final Project Presentation - Final Version - 5.23...John Andrews
SlideShare Description for "Chatty Kathy - UNC Bootcamp Final Project Presentation"
Title: Chatty Kathy: Enhancing Physical Activity Among Older Adults
Description:
Discover how Chatty Kathy, an innovative project developed at the UNC Bootcamp, aims to tackle the challenge of low physical activity among older adults. Our AI-driven solution uses peer interaction to boost and sustain exercise levels, significantly improving health outcomes. This presentation covers our problem statement, the rationale behind Chatty Kathy, synthetic data and persona creation, model performance metrics, a visual demonstration of the project, and potential future developments. Join us for an insightful Q&A session to explore the potential of this groundbreaking project.
Project Team: Jay Requarth, Jana Avery, John Andrews, Dr. Dick Davis II, Nee Buntoum, Nam Yeongjin & Mat Nicholas
Quantitative Data AnalysisReliability Analysis (Cronbach Alpha) Common Method...2023240532
Quantitative data Analysis
Overview
Reliability Analysis (Cronbach Alpha)
Common Method Bias (Harman Single Factor Test)
Frequency Analysis (Demographic)
Descriptive Analysis
2. DMV’s
Released as part of SQL 2005
Matured in SQL 2008
Lighter weight and more focused than
older sp_who and sysprocesses
◦ Sysprocesses pulled all sessions regardless of
whether active or not. In general higher
resource usage to query even when qualified
with predicates
◦ DMV’s are a bit more normalized, so may need
to join more views to get back similar info to
sysprocesses
3. DMV’s
Great source of information
◦ Most views contain point in time information
◦ If not point in time information is cumulative
Good to understand blind spots or
inaccuracies in data
◦ This will give confidence in information or at
least let you know how to change monitoring
approach to make up for potential inaccuracies
4. Tuning Approaches
Proactive Tuning
◦ Find potential hotspots and problem queries
before they become a problem
◦ Good to have a few queries in your toolbox
Reactive Tuning
◦ A problem is reported and you must work
quickly to find root cause and fix the issue
◦ Good to have queries from toolbox, but more
important to understand views so you can build
diagnostic queries on the fly quickly
5. Proactive Tuning
sys.dm_exec_query_stats
Contains row for every statement/execution plan
combination in cache: (sql_handle,
statement_start_offset, statement_end_offset,
plan_handle)
◦ SQL_HANDLE references a specific sql batch or stored
procedure. It’s actually MD5 Hash of SQL Text.
◦ STATEMENT_START_OFFSET and
STATEMENT_END_OFFSET reference a statement within
the batch or stored procedure
◦ PLAN_HANDLE references the execution plan for a sql
batch or stored procedure.
A single sql_handle can reference multiple
plan_handles
6. Multiple PLAN_HANDLEs
Multiple plan handles can exist if there are more
than one execution plan for a given sql handle
This can be explained by querying
sys.dm_exec_plan_attributes
Apart from explaining multiple plans, has useful
info such as what DB the statement executed in
7. Back to sys.dm_exec_query_stats
Contains cumulative statistics on query since it
was created in cache
◦ Worker (CPU) time
◦ Logical IO
◦ Physical IO
◦ Row Counts (Not available until SQL 2012 or SQL Azure)
◦ Elapsed Time
◦ Execution Counts
◦ CLR Time
Also contains
◦ Min Values
◦ Max Values
◦ Last Values
8. sys.dm_exec_query_stats
Data only as good as how long it has been cached CREATION_TIME shows
when created
High PLAN_GENERATION_NUM is indicator of high number of recompiles, also
indicates that statistics are getting reset frequently.
PLAN_GENERATION_NUM increments across the batch or stored procedure, not
for each statement
SELECT sql_handle, statement_start_offset,
plan_generation_num, creation_time
FROM sys.dm_exec_query_stats
WHERE sql_handle = 0x03000A001565FE1C47D4550081A300000100000000000000
9. What’s not in
sys.dm_exec_query_stats
Statements that do not complete
◦ .Net has default command timeout of 30 seconds,
long executions that are aborted will not show up
◦ May need to monitor with XE (Extended Events),
sys.dm_exec_requests, or Profiler
◦ Can detect aborted statements by tracing Attention
event in Profiler or XE (Attention event not available
till 2012)
OPEN Cursor
◦ Fetch appears, but not OPEN Cursor
DDL
10. Query Fingerprints
Similar statements generate different
sql_handle even for minor differences
◦ When using ADO.Net, different string lengths
will cause parameterized SQL to have different
sql_handle’s
◦ Dynamic SQL will cause sql_handle to have
different sql_handle’s
These scenarios make performance tuning
difficult
Query Fingerprints QUERY_HASH and
PLAN_HASH take this into account
11. Query Fingerprints
DECLARE @CustomerID INT
SELECT * FROM Customer
WHERE CustomerID =
@CustomerID
SELECT * FROM Customer
WHERE CustomerID = 523
These two statements have same QUERY_HASH:
12. Query Fingerprints
Not available until SQL 2008
Only DML will have query hash, otherwise
a QUERY_HASH of 0x0000000000000000
appears
◦ Backup
◦ Cursor Fetch
◦ DDL
13. sys.dm_exec_sql_text
Use to get actual SQL text from a SQL_HANDLE or PLAN_HANDLE
Cannot use QUERY_HASH or PLAN_HASH with this
Good alternative to trace when capturing SQL text when creating plan guides
Warning: dbid is null most of the time, only for stored procs will it be
populated
If you need to get an individual statement within batch or stored procedure use
following:
declare @statement_start_offset int
declare @statement_end_offset int
declare @sql_handle varbinary(64)
SELECT SUBSTRING(est.text, (@statement_start_offset/2)+1,
((CASE @statement_end_offset
WHEN -1 THEN DATALENGTH(est.text)
ELSE @statement_end_offset
END - @statement_start_offset)/2) + 1)
FROM sys.dm_exec_sql_text(@sql_handle) est
14. sys.dm_exec_query_plan &
sys.dm_exec_text_query_plan
Useful to get plan from plan cache
sys.dm_exec_query_plan returns plan
handle as XML so you can just click on it
to open plan in SSMS
sys.dm_exec_text_query_plan returns
plan handle as NVARCHAR(MAX)
◦ Doesn’t have size limitation (max nesting of
128) as sys.dm_exec_query_plan.
◦ Can also be queried by statement_start_offset
and statement_end_offset to get a specific plan
15. CREATE TABLE #Stats
(
dbname NVARCHAR(128),
query_hash VARBINARY(8),
sql_handle_count INT,
query_plan_hash VARBINARY(8),
statement_text NVARCHAR(MAX),
execution_count BIGINT,
total_worker_time BIGINT,
avg_worker_time BIGINT,
total_physical_reads BIGINT,
avg_physical_reads BIGINT,
total_logical_reads BIGINT,
avg_logical_reads BIGINT,
total_elapsed_time BIGINT,
avg_elapsed_time BIGINT,
total_clr_time BIGINT,
avg_clr_time BIGINT)
INSERT INTO #Stats (dbname, query_hash, sql_handle_count, query_plan_hash, execution_count, total_worker_time,
avg_worker_time, total_physical_reads, avg_physical_reads, total_logical_reads, avg_logical_reads,
total_elapsed_time, avg_elapsed_time, total_clr_time, avg_clr_time)
SELECT TOP 50 DB_NAME(CONVERT(INT, epa.value)), query_hash, count(distinct sql_handle), query_plan_hash,
SUM(execution_count) AS execution_count,
SUM(total_worker_time) AS total_worker_time,
SUM(total_worker_time)/SUM(execution_count) AS avg_worker_time,
SUM(total_physical_reads) AS total_physical_reads,
SUM(total_physical_reads)/SUM(execution_count) AS avg_physical_reads,
SUM(total_logical_reads) AS total_logical_reads,
SUM(total_logical_reads)/SUM(execution_count) AS avg_logical_reads,
SUM(total_elapsed_time) AS total_elapsed_time,
SUM(total_elapsed_time)/SUM(execution_count) AS avg_elapsed_time,
SUM(total_clr_time) AS total_clr_time,
SUM(total_clr_time)/SUM(execution_count) AS avg_clr_time
FROM sys.dm_exec_query_stats eqs
CROSS APPLY sys.dm_exec_plan_attributes(eqs.plan_handle) epa
WHERE attribute = 'dbid' AND eqs.query_hash != 0x0000000000000000
GROUP BY DB_NAME(CONVERT(INT, epa.value)),
query_hash, query_plan_hash
ORDER BY SUM(total_elapsed_time) DESC /* change this order by if you want to get top cpu consumers or top avg_elapsed_time */
SELECT * FROM #Stats
16. CREATE TABLE #Statements
(query_hash VARBINARY(8),
sql_handle VARBINARY(64),
plan_handle VARBINARY(64),
statement_start_offset int,
statement_end_offset int,
execution_count bigint,
row_num int)
INSERT INTO #Statements
SELECT eqs0.query_hash, eqs.sql_handle, eqs.plan_handle,
eqs.statement_start_offset, eqs.statement_end_offset,
eqs.execution_count,
RANK() OVER (PARTITION BY eqs.QUERY_HASH ORDER BY eqs.execution_count DESC) AS RowNum
FROM #Stats eqs0 INNER JOIN sys.dm_exec_query_stats eqs ON eqs.query_hash = eqs0.query_hash
SELECT eqs.query_hash, eqs.row_num, eqs.execution_count, SUBSTRING(est.text, (eqs.statement_start_offset/2)+1,
((CASE eqs.statement_end_offset
WHEN -1 THEN DATALENGTH(est.text)
ELSE eqs.statement_end_offset
END - eqs.statement_start_offset)/2) + 1) AS SQLText,
CONVERT(XML, eqp.query_plan)
FROM #Statements eqs CROSS APPLY sys.dm_exec_sql_text(eqs.sql_handle) est
CROSS APPLY sys.dm_exec_text_query_plan(eqs.plan_handle, eqs.statement_start_offset, eqs.statement_end_offset) eqp
WHERE eqs.row_num <= 5
ORDER BY eqs.query_hash, eqs.row_num
17. Analyzing the output
•Top set of results is query’s listed by order of total_elapsed_time
•Make note of sql_handle_count, that might indicate query
using dynamic sql
•Bottom set of results are the sql text for the query_hash’s lsited
above
•Make note of execution_count, the top 5 are chosen by
execution_count
18. sys.dm_exec_requests
Good for monitoring currently executing
requests
A request can be uniquely identified by
START_TIME and SESSION_ID.
Normally monitor this by polling and
looking for long executions, or sessions
with WAIT_EVENT
19. sys.dm_exec_requests
Query by SESSION_ID > 50 to avoid
system processes
ORDER BY START_TIME, SESSION_ID will
help display same session in same spot
and have longest executions bubble up to
the top
Calculate actual elapsed time by doing
DATEDIFF(ms, START_TIME, GETDATE())
20. sys.dm_exec_requests caveats
QUERY_HASH and PLAN_HASH are NULL in SQL Azure DB and
SQL 2014 Prior to Update 1
In SQL 2008 R2 and prior CPU_TIME is only for the parent task,
not for child tasks. This introduces a blind spot when monitoring
a query executing in Parallel. Use sysprocesses instead
TOTAL_ELAPSED_TIME takes into account parallel execution so it
is not wall clock time, it will report a value higher than wall clock
time
select start_time, session_id, total_elapsed_time,
datediff(ms, start_time, getdate()) as actual_elapsed_time
from sys.dm_exec_requests where session_id > 50
21. sys.dm_exec_requests caveats
select distinct a.start_time, a.session_id, a.wait_type,
b.wait_type as task_wait_type, b.waiting_task_address from
sys.dm_exec_requests a
inner join sys.dm_os_waiting_tasks b on a.session_id = b.session_id
where a.session_id > 50 and a.wait_type is not null
•WAIT information is only for parent task. This usually results in CXPACKET
being reported as WAIT_TYPE
•Query sys.dm_os_waiting_tasks to see details on root cause of wait
22. sys.dm_exec_requests
select der.start_time, der.session_id, db_name(der.database_id) as
database_name,
datediff(ms, der.start_time, getdate()) as actual_elapsed_time,
der.status, der.blocking_session_id, der.wait_type, der.wait_time,
der.wait_resource, der.cpu_time, der.total_elapsed_time, der.reads,
der.writes, der.logical_reads, s.host_name, s.login_name, s.program_name,
s.transaction_isolation_level,
SUBSTRING(st.text, (der.statement_start_offset/2)+1,
((CASE der.statement_end_offset
WHEN -1 THEN DATALENGTH(st.text)
ELSE der.statement_end_offset
END - der.statement_start_offset)/2) + 1) as sql_text,
CONVERT(XML, qp.query_plan) as xml_query_plan
from sys.dm_exec_requests der inner join sys.dm_exec_sessions s on
der.session_id = s.session_id
cross apply sys.dm_exec_sql_text(der.sql_handle) st
cross apply sys.dm_exec_text_query_plan(der.plan_handle,
der.statement_start_offset, der.statement_end_offset) qp
where der.session_id > 50
and der.session_id != @@spid
order by der.start_time, der.session_id
23. sys.dm_exec_requests
Row 1 total_elapsed_time is higher than actual_elapsed_time
Lock wait occuring on rows 5 through 11
◦ Root blocker is session_id 9097, in runnable state and showing cpu_time of
17 seconds
◦ Should review execution plan
◦ Also make note of transaction_isolation_level, if > 2 (Read commited)
should question developer why needed
24. CREATE TABLE #Processes
(session_id SMALLINT,
blocking_session_id SMALLINT,
database_id SMALLINT,
login_name NVARCHAR(128),
program_name NVARCHAR(128),
host_name NVARCHAR(128),
sql_handle VARBINARY(64),
wait_time int)
INSERT INTO #Processes (session_id, blocking_session_id, database_id, login_name,
program_name, host_name, sql_handle, wait_time)
SELECT
s.session_id, r.blocking_session_id, r.database_id,
s.login_name, s.program_name, s.host_name, r.sql_handle, r.wait_time
FROM sys.dm_exec_sessions s LEFT JOIN sys.dm_exec_requests r on r.session_id = s.session_id
WHERE
s.session_id > 50;
WITH Blocking(session_id, blocking_session_id, sql_handle, wait_time, RowNo, LevelRow)
AS
(
SELECT
p.session_id, p.blocking_session_id, p.sql_handle, p.wait_time,
ROW_NUMBER() OVER(ORDER BY p.session_id),
0 AS LevelRow
FROM
#Processes p
JOIN #Processes p1 ON p.session_id = p1.blocking_session_id
WHERE
p.blocking_session_id = 0
UNION ALL
SELECT
r.session_id, r.blocking_session_id, r.sql_handle, r.wait_time,
b.RowNo,
b.LevelRow + 1
FROM
#Processes r
JOIN Blocking b ON r.blocking_session_id = b.session_id
WHERE
r.blocking_session_id > 0
)
SELECT * FROM Blocking
ORDER BY RowNo, LevelRow
DROP TABLE #Processes
25. Root blocker
•Use sys.dm_exec_sql_text to get sql text
•Level Row 0 indicates root blocker
•Wait_time in this example is 0, due to this being a brief lock
26. Common wait types
If a query is not using CPU or waiting on CPU it will
be in a wait.
Query elapsed time = query wait + cpu time
Common wait types queries encounter:
◦ LCK_% - lock wait
◦ PAGEIOLATCH_% - IO wait
◦ PAGELATCH_% - buffer wait
Watch for PFS, SGAM, GAM (2:1:1, 2:1:2, 2:1:3)
◦ LATCH_% - Latch see sys.dm_os_latch_stats
◦ CX_PACKET – Shown for parallel executions
◦ SOS_SCHEDULER_YIELD – Wait resulting from query
yielding execution
◦ ASYNC_NETWORK_IO – Client taking long to consume
query output
◦ WRITELOG – Transaction log IO wait
27. Wrap up
There are many dmv’s not covered in this
◦ I didn’t get too deep into waits
(sys.dm_os_wait_stats or sys.dm_db_wait_stats)
These are just a starting point
DMV’s aren’t end all be all
◦ Trace via profiler (sometimes necessary evil)
◦ Extended events (great, but not until 2012)
Contact me directly with questions:
franklin.yamamoto@lucede.com or on twitter
@SQLGrease
Max Values are useful for identifying outliers in performance. If you see low average elapsed times, but have a high max value it might indicate a query is having sporadic performance issues. Good to monitor last value real time to see if most executions are low response times
Finds root blocker, sql_handles involved, and wait time for all sessions in block tree