Download as PDF, PPTX


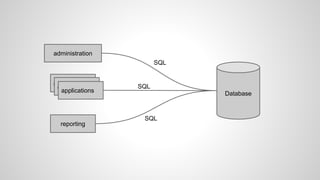


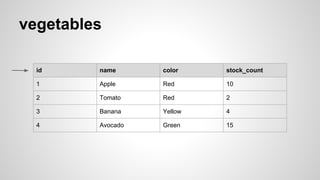
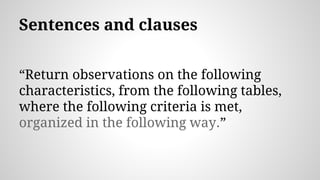
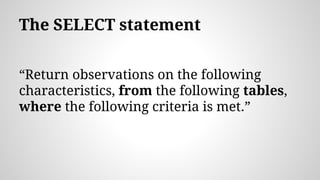
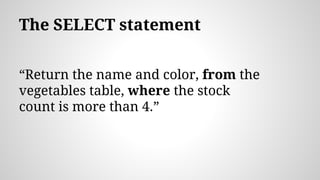
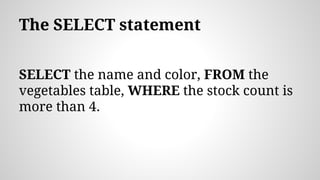
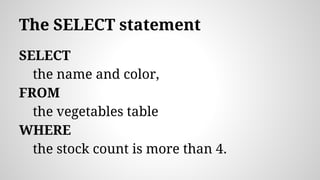
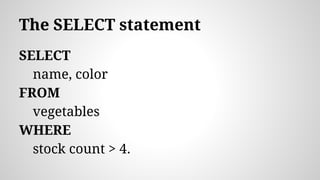
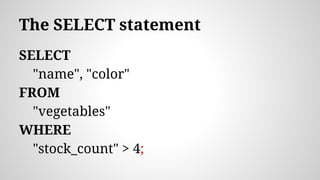


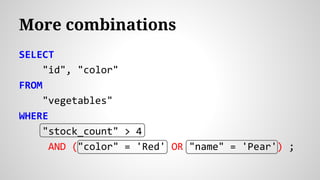
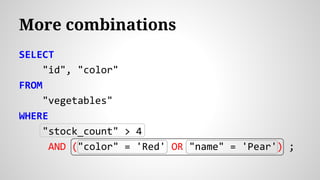
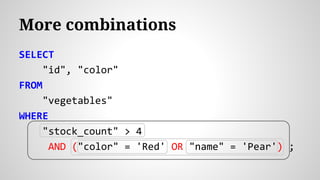

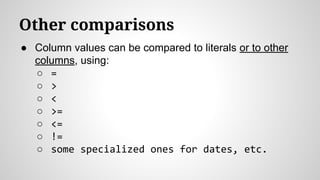
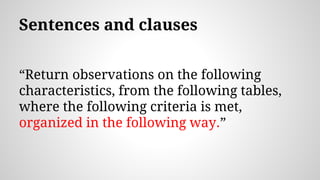
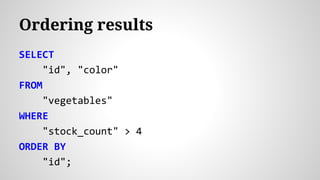
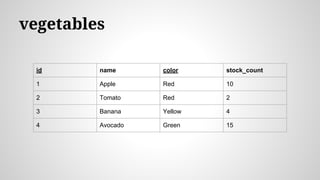

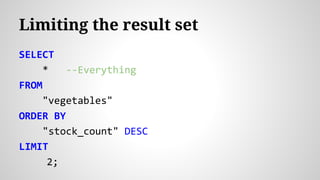


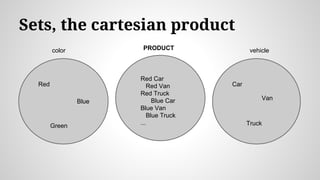
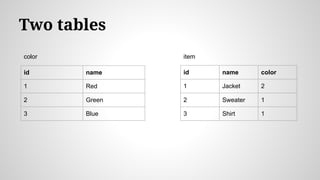
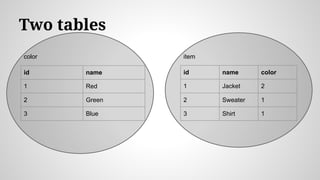
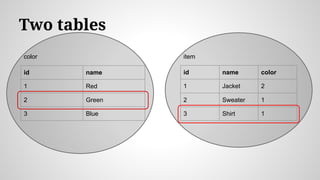

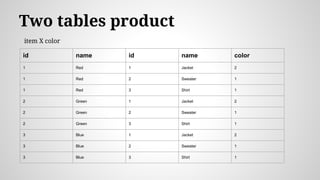

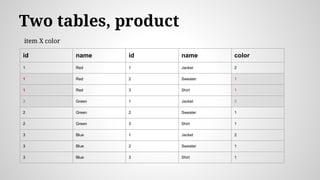
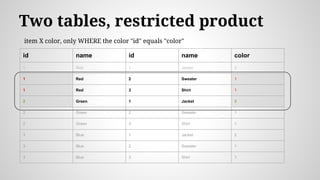
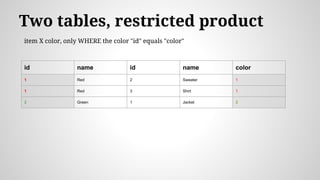
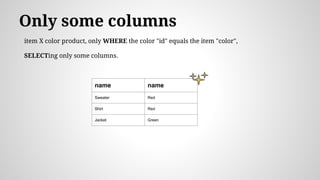
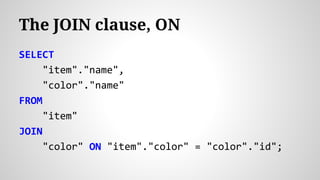
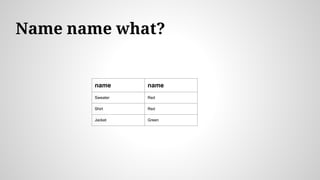
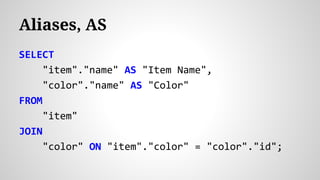

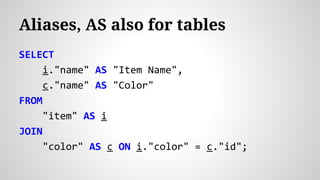

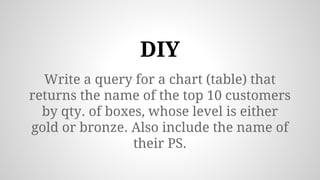

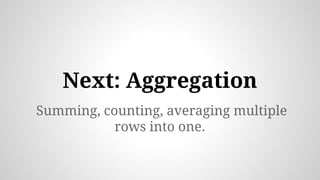


The document provides an overview of SQL (Structured Query Language) principles, including defining a database, querying, and manipulating data. It discusses key SQL concepts such as the structure of tables, SELECT statements, filtering results, and joining tables, and highlights the importance of ordering and limiting result sets. Various examples throughout illustrate how to write SQL queries for specific data retrieval tasks.


![[DSC Europe 25] Andrzej Kowalczyk - AI - how to start small and grow in the f...](https://cdn.slidesharecdn.com/ss_thumbnails/oy1zmo94qv6vpcqjvno2-andrzej-kowalczyk-ai-how-to-start-small-and-grow-in-the-future-1-260119121559-cf093b23-thumbnail.jpg?width=640&height=640&fit=bounds)


![[DSC Europe 25] Elena Menshikova - AI-Powered Operational Excellence: Revolut...](https://cdn.slidesharecdn.com/ss_thumbnails/es6nholbqy3zaao2c2yd-2-elena-menshikova-data-ai-in-decision-making-260115093812-4fba8b38-thumbnail.jpg?width=640&height=640&fit=bounds)


