SlideShare a Scribd company logo
1 of 7
HOMEWORK 1 Data Analysis for Hospitality Managers
(Due: Apr. 15th
)
Rahel Hailu
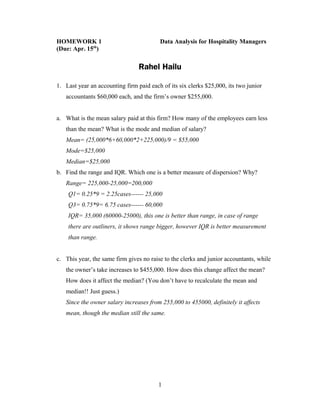
1. Last year an accounting firm paid each of its six clerks $25,000, its two junior
accountants $60,000 each, and the firm’s owner $255,000.
a. What is the mean salary paid at this firm? How many of the employees earn less
than the mean? What is the mode and median of salary?
Mean= (25,000*6+60,000*2+225,000)/9 = $55,000
Mode=$25,000
Median=$25,000
b. Find the range and IQR. Which one is a better measure of dispersion? Why?
Range= 225,000-25,000=200,000
Q1= 0.25*9 = 2.25cases------ 25,000
Q3= 0.75*9= 6.75 cases------ 60,000
IQR= 35,000 (60000-25000), this one is better than range, in case of range
there are outliners, it shows range bigger, however IQR is better measurement
than range.
c. This year, the same firm gives no raise to the clerks and junior accountants, while
the owner’s take increases to $455,000. How does this change affect the mean?
How does it affect the median? (You don’t have to recalculate the mean and
median!! Just guess.)
Since the owner salary increases from 255,000 to 455000, definitely it affects
mean, though the median still the same.
1
(SPSS)
Using the data file “marketing” to answer following questions.
1. There are 8 variables except for ID. Fill the box below.
Variables Level of
Measurement
Appropriate
Central Tendency
Measure
Appropriate
Dispersion
Measure
Visday Nominal Mode None
Vistime Nominal Mode None
Menu Nominal Mode None
recommend Ordinal Median IQR
Satisfied Ordinal Median IQR
Amount Scale Median/ mean SD
Income Ordinal Mode/ Median SD
frequency Scale Mode/Median SD
2. Produce a frequency table and a bar chart for “menu”.
menu category
Frequency Percent Valid Percent
Cumulative
Percent
Valid healthy food 141 31.3 31.3 31.3
seasonal food 210 46.7 46.7 78.0
regular food 99 22.0 22.0 100.0
Total 450 100.0 100.0
2
3. Produce a proper kind of graph to show the distribution of “amount.”
4. Based on the graph you made in question 3, describe the shape of the distribution.
Guess which one would be higher, mean or median? Why?
Positive skewness - long tail in the right side.
Long tail in the right side, - Mean is higher than median;
5. Confirm your answer to the question 4 by finding appropriate measures of central
tendency.
Refer to question #1, “Amount” is scale. Therefore, Central tendency are mean
and median
6. Find the range, IQR, and standard deviation of the variable “amount”.
The Range is 74,300
The IQR is 75%-25%-- 14,900 (36,900-22,000).
And the SD is 11120.853
3
Statistics
amount spent
N Valid 450
Missing 0
Mean 29940.00
Median 29750.00
Range 74300
Percentiles 25 22000.00
50 29750.00
75 36900.00
7. Find the median, range, and IQR of “amount” for each of daytime visitors and
evening visitors, separately.
Statistics vistime = 1
amount spent
N
Valid 180
Missing 0
Median 25100.00
Range 40500
Percentiles
25 20300.00
50 25100.00
75 30825.00
Statistics vistime = 2
amount spent
N
Valid 270
Missing 0
Median 32650.00
Range 73200
Percentiles
25 26200.00
50 32650.00
75 37900.00
4
8. Make a box-plot for amount for all visitors, and also for daytime visitors and
evening visitors, separately. Describe what you find in a couple of sentences.
In comparison to the amount for daytime and night time visitors, evening visitors amount
are higher than daytime visitors. Therefore, amount for evening consumers are superior
than daytime.
5
9. Get the means and standard deviations for each of daytime visitors and evening
visitors. Which group spent more? Which group is diverse in the amount spent?
Statistics- Daytime
amount spent
N
Valid 180
Missing 0
Mean 25490.00
Std. Deviation 8556.771
Statistics- Evening
amount spent
N
Valid 270
Missing 0
Mean 32906.67
Std. Deviation 11645.716
Mean and the SD - evening visitors paying are higher than daytime visitors.
-Evening visitors spent more than daytime.
- Std. Deviation shows, distribution diverse of the amount. Henceforth, the
evening visitors groups have diversification than the daytimevisitors.
10. Final question. Do you think that the difference between the two groups (daytime
vs. evening) in the mean amount is large enough to conclude that one group spent
more than the other? Why or why not? (This topic will be covered in the
inferential statistics later. For now, just guess and tell your ‘impression.’)
I could not determine the mean of day and evening groups spent than one each
other’s, because there are still insignificant error in the sample.
6

More Related Content

Similar to Homework 1 Data Analysis for Hospitality Managers

Dream Success International
Dream Success InternationalDream Success International
Dream Success Internationalguest916de2
 
How to Build Pay Grades and Salary Ranges
How to Build Pay Grades and Salary RangesHow to Build Pay Grades and Salary Ranges
How to Build Pay Grades and Salary RangesPayScale, Inc.
 
Introduction to Six Sigma (Basic)
Introduction to Six Sigma (Basic)Introduction to Six Sigma (Basic)
Introduction to Six Sigma (Basic)Narendra Narendra
 
The Power of KPIs
The Power of KPIsThe Power of KPIs
The Power of KPIsPatti Peets
 
How Leaders See Data? (Level 1)
How Leaders See Data? (Level 1)How Leaders See Data? (Level 1)
How Leaders See Data? (Level 1)Narendra Narendra
 
What are the odds of making that number risk analysis with crystal ball - O...
What are the odds of making that number   risk analysis with crystal ball - O...What are the odds of making that number   risk analysis with crystal ball - O...
What are the odds of making that number risk analysis with crystal ball - O...p6academy
 
Medical Practice Business Consulting Presentation
Medical Practice Business Consulting PresentationMedical Practice Business Consulting Presentation
Medical Practice Business Consulting Presentationjohncoxford
 
Jigsaw Mortgage Dex Data Analysis Competition Winner Presentation - Shyam An...
 Jigsaw Mortgage Dex Data Analysis Competition Winner Presentation - Shyam An... Jigsaw Mortgage Dex Data Analysis Competition Winner Presentation - Shyam An...
Jigsaw Mortgage Dex Data Analysis Competition Winner Presentation - Shyam An...Jigsaw Academy
 
Eleventy Marketing Intelligence presentation
Eleventy Marketing Intelligence presentationEleventy Marketing Intelligence presentation
Eleventy Marketing Intelligence presentationJeff Birkner
 
7. Plan, perform, and evaluate samples for substantive procedures IPPTChap009...
7. Plan, perform, and evaluate samples for substantive procedures IPPTChap009...7. Plan, perform, and evaluate samples for substantive procedures IPPTChap009...
7. Plan, perform, and evaluate samples for substantive procedures IPPTChap009...55296
 
Roi Presentation
Roi PresentationRoi Presentation
Roi Presentationjanwatson
 
present worth analysis.ppt
present worth analysis.pptpresent worth analysis.ppt
present worth analysis.pptashwinigupta38
 
Show Me the Money: Incentive Comp for SaaS
Show Me the Money: Incentive Comp for SaaSShow Me the Money: Incentive Comp for SaaS
Show Me the Money: Incentive Comp for SaaSKeychain Logic
 
Qnt 275 final exam new 2016
Qnt 275 final exam new 2016Qnt 275 final exam new 2016
Qnt 275 final exam new 2016Adams-ASs
 
Really simple analysis for extremely powerful insights - Data Curry
Really simple analysis for extremely powerful insights - Data CurryReally simple analysis for extremely powerful insights - Data Curry
Really simple analysis for extremely powerful insights - Data CurryData Curry
 
Lsmto lean canvas ranking by profit forecasting
Lsmto lean canvas ranking by profit forecastingLsmto lean canvas ranking by profit forecasting
Lsmto lean canvas ranking by profit forecastingPeter LePiane
 
Go buyside United States Compensation Study
Go buyside United States Compensation StudyGo buyside United States Compensation Study
Go buyside United States Compensation StudyGoBuyside
 
How to Enter the Data Analytics Industry?
How to Enter the Data Analytics Industry?How to Enter the Data Analytics Industry?
How to Enter the Data Analytics Industry?Ganes Kesari
 

Similar to Homework 1 Data Analysis for Hospitality Managers (20)

Dream Success International
Dream Success InternationalDream Success International
Dream Success International
 
How to Build Pay Grades and Salary Ranges
How to Build Pay Grades and Salary RangesHow to Build Pay Grades and Salary Ranges
How to Build Pay Grades and Salary Ranges
 
Introduction to Six Sigma (Basic)
Introduction to Six Sigma (Basic)Introduction to Six Sigma (Basic)
Introduction to Six Sigma (Basic)
 
The Power of KPIs
The Power of KPIsThe Power of KPIs
The Power of KPIs
 
How Leaders See Data? (Level 1)
How Leaders See Data? (Level 1)How Leaders See Data? (Level 1)
How Leaders See Data? (Level 1)
 
What are the odds of making that number risk analysis with crystal ball - O...
What are the odds of making that number   risk analysis with crystal ball - O...What are the odds of making that number   risk analysis with crystal ball - O...
What are the odds of making that number risk analysis with crystal ball - O...
 
Medical Practice Business Consulting Presentation
Medical Practice Business Consulting PresentationMedical Practice Business Consulting Presentation
Medical Practice Business Consulting Presentation
 
Presentation
PresentationPresentation
Presentation
 
Jigsaw Mortgage Dex Data Analysis Competition Winner Presentation - Shyam An...
 Jigsaw Mortgage Dex Data Analysis Competition Winner Presentation - Shyam An... Jigsaw Mortgage Dex Data Analysis Competition Winner Presentation - Shyam An...
Jigsaw Mortgage Dex Data Analysis Competition Winner Presentation - Shyam An...
 
Eleventy Marketing Intelligence presentation
Eleventy Marketing Intelligence presentationEleventy Marketing Intelligence presentation
Eleventy Marketing Intelligence presentation
 
Chapter 09
Chapter 09 Chapter 09
Chapter 09
 
7. Plan, perform, and evaluate samples for substantive procedures IPPTChap009...
7. Plan, perform, and evaluate samples for substantive procedures IPPTChap009...7. Plan, perform, and evaluate samples for substantive procedures IPPTChap009...
7. Plan, perform, and evaluate samples for substantive procedures IPPTChap009...
 
Roi Presentation
Roi PresentationRoi Presentation
Roi Presentation
 
present worth analysis.ppt
present worth analysis.pptpresent worth analysis.ppt
present worth analysis.ppt
 
Show Me the Money: Incentive Comp for SaaS
Show Me the Money: Incentive Comp for SaaSShow Me the Money: Incentive Comp for SaaS
Show Me the Money: Incentive Comp for SaaS
 
Qnt 275 final exam new 2016
Qnt 275 final exam new 2016Qnt 275 final exam new 2016
Qnt 275 final exam new 2016
 
Really simple analysis for extremely powerful insights - Data Curry
Really simple analysis for extremely powerful insights - Data CurryReally simple analysis for extremely powerful insights - Data Curry
Really simple analysis for extremely powerful insights - Data Curry
 
Lsmto lean canvas ranking by profit forecasting
Lsmto lean canvas ranking by profit forecastingLsmto lean canvas ranking by profit forecasting
Lsmto lean canvas ranking by profit forecasting
 
Go buyside United States Compensation Study
Go buyside United States Compensation StudyGo buyside United States Compensation Study
Go buyside United States Compensation Study
 
How to Enter the Data Analytics Industry?
How to Enter the Data Analytics Industry?How to Enter the Data Analytics Industry?
How to Enter the Data Analytics Industry?
 

Recently uploaded

A Call to Action for Generative AI in 2024
A Call to Action for Generative AI in 2024A Call to Action for Generative AI in 2024
A Call to Action for Generative AI in 2024Results
 
The Codex of Business Writing Software for Real-World Solutions 2.pptx
The Codex of Business Writing Software for Real-World Solutions 2.pptxThe Codex of Business Writing Software for Real-World Solutions 2.pptx
The Codex of Business Writing Software for Real-World Solutions 2.pptxMalak Abu Hammad
 
Unblocking The Main Thread Solving ANRs and Frozen Frames
Unblocking The Main Thread Solving ANRs and Frozen FramesUnblocking The Main Thread Solving ANRs and Frozen Frames
Unblocking The Main Thread Solving ANRs and Frozen FramesSinan KOZAK
 
Understanding the Laravel MVC Architecture
Understanding the Laravel MVC ArchitectureUnderstanding the Laravel MVC Architecture
Understanding the Laravel MVC ArchitecturePixlogix Infotech
 
🐬 The future of MySQL is Postgres 🐘
🐬  The future of MySQL is Postgres   🐘🐬  The future of MySQL is Postgres   🐘
🐬 The future of MySQL is Postgres 🐘RTylerCroy
 
Slack Application Development 101 Slides
Slack Application Development 101 SlidesSlack Application Development 101 Slides
Slack Application Development 101 Slidespraypatel2
 
How to Troubleshoot Apps for the Modern Connected Worker
How to Troubleshoot Apps for the Modern Connected WorkerHow to Troubleshoot Apps for the Modern Connected Worker
How to Troubleshoot Apps for the Modern Connected WorkerThousandEyes
 
SQL Database Design For Developers at php[tek] 2024
SQL Database Design For Developers at php[tek] 2024SQL Database Design For Developers at php[tek] 2024
SQL Database Design For Developers at php[tek] 2024Scott Keck-Warren
 
08448380779 Call Girls In Friends Colony Women Seeking Men
08448380779 Call Girls In Friends Colony Women Seeking Men08448380779 Call Girls In Friends Colony Women Seeking Men
08448380779 Call Girls In Friends Colony Women Seeking MenDelhi Call girls
 
How to convert PDF to text with Nanonets
How to convert PDF to text with NanonetsHow to convert PDF to text with Nanonets
How to convert PDF to text with Nanonetsnaman860154
 
GenCyber Cyber Security Day Presentation
GenCyber Cyber Security Day PresentationGenCyber Cyber Security Day Presentation
GenCyber Cyber Security Day PresentationMichael W. Hawkins
 
#StandardsGoals for 2024: What’s new for BISAC - Tech Forum 2024
#StandardsGoals for 2024: What’s new for BISAC - Tech Forum 2024#StandardsGoals for 2024: What’s new for BISAC - Tech Forum 2024
#StandardsGoals for 2024: What’s new for BISAC - Tech Forum 2024BookNet Canada
 
Kalyanpur ) Call Girls in Lucknow Finest Escorts Service 🍸 8923113531 🎰 Avail...
Kalyanpur ) Call Girls in Lucknow Finest Escorts Service 🍸 8923113531 🎰 Avail...Kalyanpur ) Call Girls in Lucknow Finest Escorts Service 🍸 8923113531 🎰 Avail...
Kalyanpur ) Call Girls in Lucknow Finest Escorts Service 🍸 8923113531 🎰 Avail...gurkirankumar98700
 
08448380779 Call Girls In Civil Lines Women Seeking Men
08448380779 Call Girls In Civil Lines Women Seeking Men08448380779 Call Girls In Civil Lines Women Seeking Men
08448380779 Call Girls In Civil Lines Women Seeking MenDelhi Call girls
 
My Hashitalk Indonesia April 2024 Presentation
My Hashitalk Indonesia April 2024 PresentationMy Hashitalk Indonesia April 2024 Presentation
My Hashitalk Indonesia April 2024 PresentationRidwan Fadjar
 
Injustice - Developers Among Us (SciFiDevCon 2024)
Injustice - Developers Among Us (SciFiDevCon 2024)Injustice - Developers Among Us (SciFiDevCon 2024)
Injustice - Developers Among Us (SciFiDevCon 2024)Allon Mureinik
 
CNv6 Instructor Chapter 6 Quality of Service
CNv6 Instructor Chapter 6 Quality of ServiceCNv6 Instructor Chapter 6 Quality of Service
CNv6 Instructor Chapter 6 Quality of Servicegiselly40
 
Google AI Hackathon: LLM based Evaluator for RAG
Google AI Hackathon: LLM based Evaluator for RAGGoogle AI Hackathon: LLM based Evaluator for RAG
Google AI Hackathon: LLM based Evaluator for RAGSujit Pal
 
Enhancing Worker Digital Experience: A Hands-on Workshop for Partners
Enhancing Worker Digital Experience: A Hands-on Workshop for PartnersEnhancing Worker Digital Experience: A Hands-on Workshop for Partners
Enhancing Worker Digital Experience: A Hands-on Workshop for PartnersThousandEyes
 
Breaking the Kubernetes Kill Chain: Host Path Mount
Breaking the Kubernetes Kill Chain: Host Path MountBreaking the Kubernetes Kill Chain: Host Path Mount
Breaking the Kubernetes Kill Chain: Host Path MountPuma Security, LLC
 

Recently uploaded (20)

A Call to Action for Generative AI in 2024
A Call to Action for Generative AI in 2024A Call to Action for Generative AI in 2024
A Call to Action for Generative AI in 2024
 
The Codex of Business Writing Software for Real-World Solutions 2.pptx
The Codex of Business Writing Software for Real-World Solutions 2.pptxThe Codex of Business Writing Software for Real-World Solutions 2.pptx
The Codex of Business Writing Software for Real-World Solutions 2.pptx
 
Unblocking The Main Thread Solving ANRs and Frozen Frames
Unblocking The Main Thread Solving ANRs and Frozen FramesUnblocking The Main Thread Solving ANRs and Frozen Frames
Unblocking The Main Thread Solving ANRs and Frozen Frames
 
Understanding the Laravel MVC Architecture
Understanding the Laravel MVC ArchitectureUnderstanding the Laravel MVC Architecture
Understanding the Laravel MVC Architecture
 
🐬 The future of MySQL is Postgres 🐘
🐬  The future of MySQL is Postgres   🐘🐬  The future of MySQL is Postgres   🐘
🐬 The future of MySQL is Postgres 🐘
 
Slack Application Development 101 Slides
Slack Application Development 101 SlidesSlack Application Development 101 Slides
Slack Application Development 101 Slides
 
How to Troubleshoot Apps for the Modern Connected Worker
How to Troubleshoot Apps for the Modern Connected WorkerHow to Troubleshoot Apps for the Modern Connected Worker
How to Troubleshoot Apps for the Modern Connected Worker
 
SQL Database Design For Developers at php[tek] 2024
SQL Database Design For Developers at php[tek] 2024SQL Database Design For Developers at php[tek] 2024
SQL Database Design For Developers at php[tek] 2024
 
08448380779 Call Girls In Friends Colony Women Seeking Men
08448380779 Call Girls In Friends Colony Women Seeking Men08448380779 Call Girls In Friends Colony Women Seeking Men
08448380779 Call Girls In Friends Colony Women Seeking Men
 
How to convert PDF to text with Nanonets
How to convert PDF to text with NanonetsHow to convert PDF to text with Nanonets
How to convert PDF to text with Nanonets
 
GenCyber Cyber Security Day Presentation
GenCyber Cyber Security Day PresentationGenCyber Cyber Security Day Presentation
GenCyber Cyber Security Day Presentation
 
#StandardsGoals for 2024: What’s new for BISAC - Tech Forum 2024
#StandardsGoals for 2024: What’s new for BISAC - Tech Forum 2024#StandardsGoals for 2024: What’s new for BISAC - Tech Forum 2024
#StandardsGoals for 2024: What’s new for BISAC - Tech Forum 2024
 
Kalyanpur ) Call Girls in Lucknow Finest Escorts Service 🍸 8923113531 🎰 Avail...
Kalyanpur ) Call Girls in Lucknow Finest Escorts Service 🍸 8923113531 🎰 Avail...Kalyanpur ) Call Girls in Lucknow Finest Escorts Service 🍸 8923113531 🎰 Avail...
Kalyanpur ) Call Girls in Lucknow Finest Escorts Service 🍸 8923113531 🎰 Avail...
 
08448380779 Call Girls In Civil Lines Women Seeking Men
08448380779 Call Girls In Civil Lines Women Seeking Men08448380779 Call Girls In Civil Lines Women Seeking Men
08448380779 Call Girls In Civil Lines Women Seeking Men
 
My Hashitalk Indonesia April 2024 Presentation
My Hashitalk Indonesia April 2024 PresentationMy Hashitalk Indonesia April 2024 Presentation
My Hashitalk Indonesia April 2024 Presentation
 
Injustice - Developers Among Us (SciFiDevCon 2024)
Injustice - Developers Among Us (SciFiDevCon 2024)Injustice - Developers Among Us (SciFiDevCon 2024)
Injustice - Developers Among Us (SciFiDevCon 2024)
 
CNv6 Instructor Chapter 6 Quality of Service
CNv6 Instructor Chapter 6 Quality of ServiceCNv6 Instructor Chapter 6 Quality of Service
CNv6 Instructor Chapter 6 Quality of Service
 
Google AI Hackathon: LLM based Evaluator for RAG
Google AI Hackathon: LLM based Evaluator for RAGGoogle AI Hackathon: LLM based Evaluator for RAG
Google AI Hackathon: LLM based Evaluator for RAG
 
Enhancing Worker Digital Experience: A Hands-on Workshop for Partners
Enhancing Worker Digital Experience: A Hands-on Workshop for PartnersEnhancing Worker Digital Experience: A Hands-on Workshop for Partners
Enhancing Worker Digital Experience: A Hands-on Workshop for Partners
 
Breaking the Kubernetes Kill Chain: Host Path Mount
Breaking the Kubernetes Kill Chain: Host Path MountBreaking the Kubernetes Kill Chain: Host Path Mount
Breaking the Kubernetes Kill Chain: Host Path Mount
 

Homework 1 Data Analysis for Hospitality Managers

  • 1. HOMEWORK 1 Data Analysis for Hospitality Managers (Due: Apr. 15th ) Rahel Hailu 1. Last year an accounting firm paid each of its six clerks $25,000, its two junior accountants $60,000 each, and the firm’s owner $255,000. a. What is the mean salary paid at this firm? How many of the employees earn less than the mean? What is the mode and median of salary? Mean= (25,000*6+60,000*2+225,000)/9 = $55,000 Mode=$25,000 Median=$25,000 b. Find the range and IQR. Which one is a better measure of dispersion? Why? Range= 225,000-25,000=200,000 Q1= 0.25*9 = 2.25cases------ 25,000 Q3= 0.75*9= 6.75 cases------ 60,000 IQR= 35,000 (60000-25000), this one is better than range, in case of range there are outliners, it shows range bigger, however IQR is better measurement than range. c. This year, the same firm gives no raise to the clerks and junior accountants, while the owner’s take increases to $455,000. How does this change affect the mean? How does it affect the median? (You don’t have to recalculate the mean and median!! Just guess.) Since the owner salary increases from 255,000 to 455000, definitely it affects mean, though the median still the same. 1
  • 2. (SPSS) Using the data file “marketing” to answer following questions. 1. There are 8 variables except for ID. Fill the box below. Variables Level of Measurement Appropriate Central Tendency Measure Appropriate Dispersion Measure Visday Nominal Mode None Vistime Nominal Mode None Menu Nominal Mode None recommend Ordinal Median IQR Satisfied Ordinal Median IQR Amount Scale Median/ mean SD Income Ordinal Mode/ Median SD frequency Scale Mode/Median SD 2. Produce a frequency table and a bar chart for “menu”. menu category Frequency Percent Valid Percent Cumulative Percent Valid healthy food 141 31.3 31.3 31.3 seasonal food 210 46.7 46.7 78.0 regular food 99 22.0 22.0 100.0 Total 450 100.0 100.0 2
  • 3. 3. Produce a proper kind of graph to show the distribution of “amount.” 4. Based on the graph you made in question 3, describe the shape of the distribution. Guess which one would be higher, mean or median? Why? Positive skewness - long tail in the right side. Long tail in the right side, - Mean is higher than median; 5. Confirm your answer to the question 4 by finding appropriate measures of central tendency. Refer to question #1, “Amount” is scale. Therefore, Central tendency are mean and median 6. Find the range, IQR, and standard deviation of the variable “amount”. The Range is 74,300 The IQR is 75%-25%-- 14,900 (36,900-22,000). And the SD is 11120.853 3
  • 4. Statistics amount spent N Valid 450 Missing 0 Mean 29940.00 Median 29750.00 Range 74300 Percentiles 25 22000.00 50 29750.00 75 36900.00 7. Find the median, range, and IQR of “amount” for each of daytime visitors and evening visitors, separately. Statistics vistime = 1 amount spent N Valid 180 Missing 0 Median 25100.00 Range 40500 Percentiles 25 20300.00 50 25100.00 75 30825.00 Statistics vistime = 2 amount spent N Valid 270 Missing 0 Median 32650.00 Range 73200 Percentiles 25 26200.00 50 32650.00 75 37900.00 4
  • 5. 8. Make a box-plot for amount for all visitors, and also for daytime visitors and evening visitors, separately. Describe what you find in a couple of sentences. In comparison to the amount for daytime and night time visitors, evening visitors amount are higher than daytime visitors. Therefore, amount for evening consumers are superior than daytime. 5
  • 6. 9. Get the means and standard deviations for each of daytime visitors and evening visitors. Which group spent more? Which group is diverse in the amount spent? Statistics- Daytime amount spent N Valid 180 Missing 0 Mean 25490.00 Std. Deviation 8556.771 Statistics- Evening amount spent N Valid 270 Missing 0 Mean 32906.67 Std. Deviation 11645.716 Mean and the SD - evening visitors paying are higher than daytime visitors. -Evening visitors spent more than daytime. - Std. Deviation shows, distribution diverse of the amount. Henceforth, the evening visitors groups have diversification than the daytimevisitors. 10. Final question. Do you think that the difference between the two groups (daytime vs. evening) in the mean amount is large enough to conclude that one group spent more than the other? Why or why not? (This topic will be covered in the inferential statistics later. For now, just guess and tell your ‘impression.’) I could not determine the mean of day and evening groups spent than one each other’s, because there are still insignificant error in the sample. 6
  • 7. 9. Get the means and standard deviations for each of daytime visitors and evening visitors. Which group spent more? Which group is diverse in the amount spent? Statistics- Daytime amount spent N Valid 180 Missing 0 Mean 25490.00 Std. Deviation 8556.771 Statistics- Evening amount spent N Valid 270 Missing 0 Mean 32906.67 Std. Deviation 11645.716 Mean and the SD - evening visitors paying are higher than daytime visitors. -Evening visitors spent more than daytime. - Std. Deviation shows, distribution diverse of the amount. Henceforth, the evening visitors groups have diversification than the daytimevisitors. 10. Final question. Do you think that the difference between the two groups (daytime vs. evening) in the mean amount is large enough to conclude that one group spent more than the other? Why or why not? (This topic will be covered in the inferential statistics later. For now, just guess and tell your ‘impression.’) I could not determine the mean of day and evening groups spent than one each other’s, because there are still insignificant error in the sample. 6