Download as PDF, PPTX

![Green Metrics
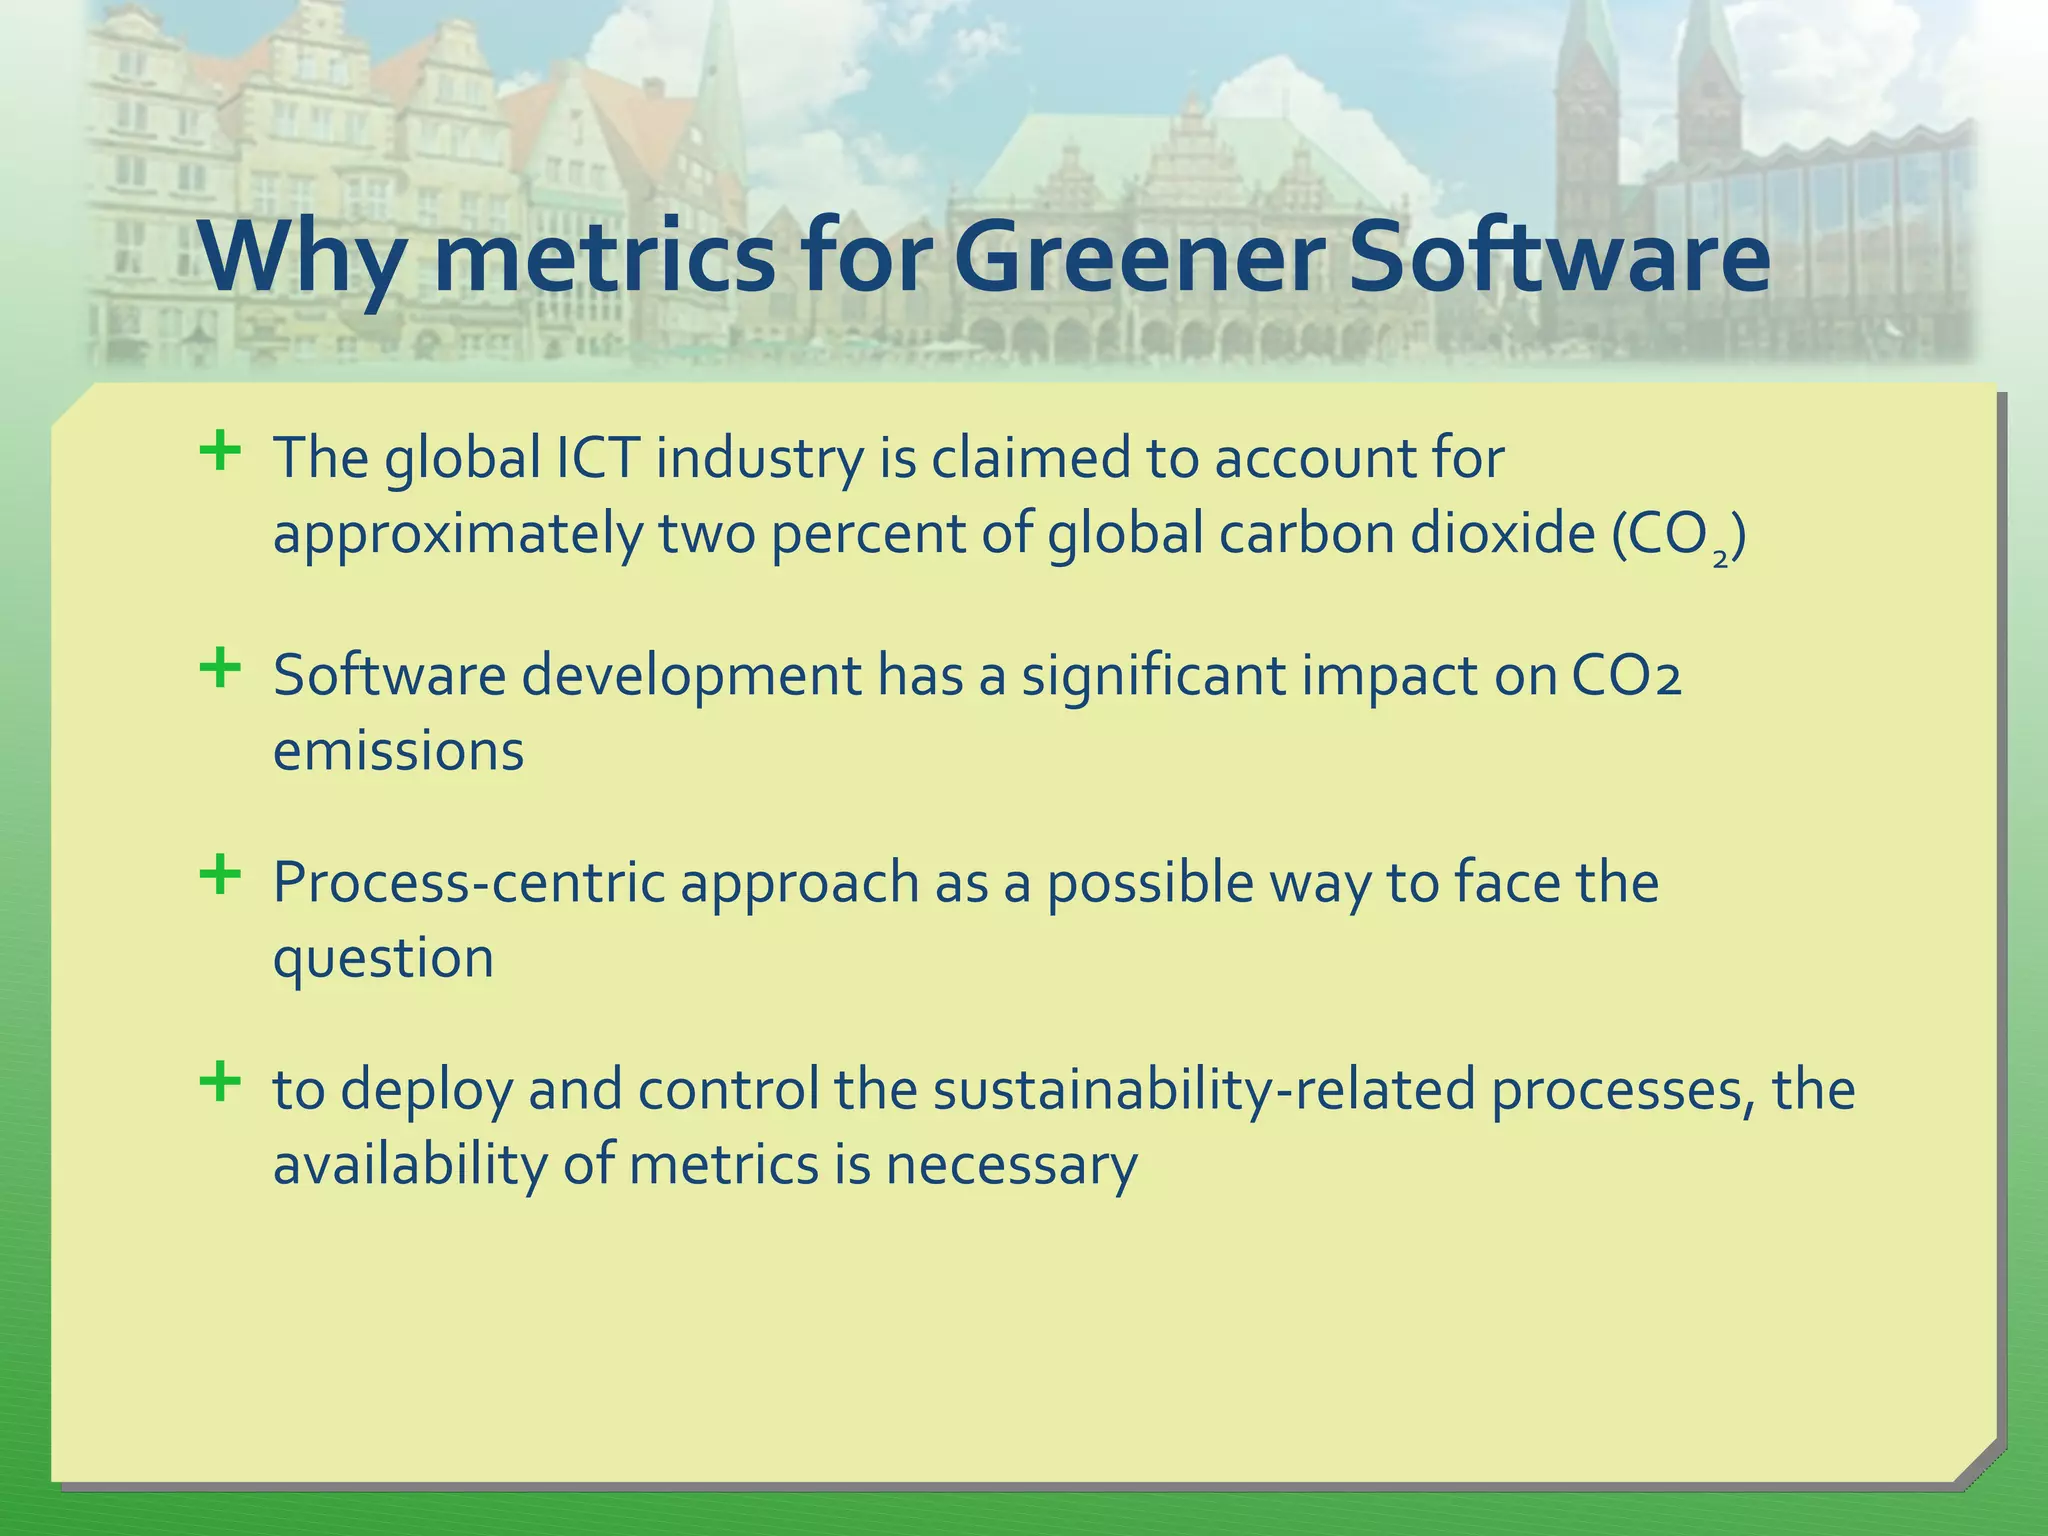
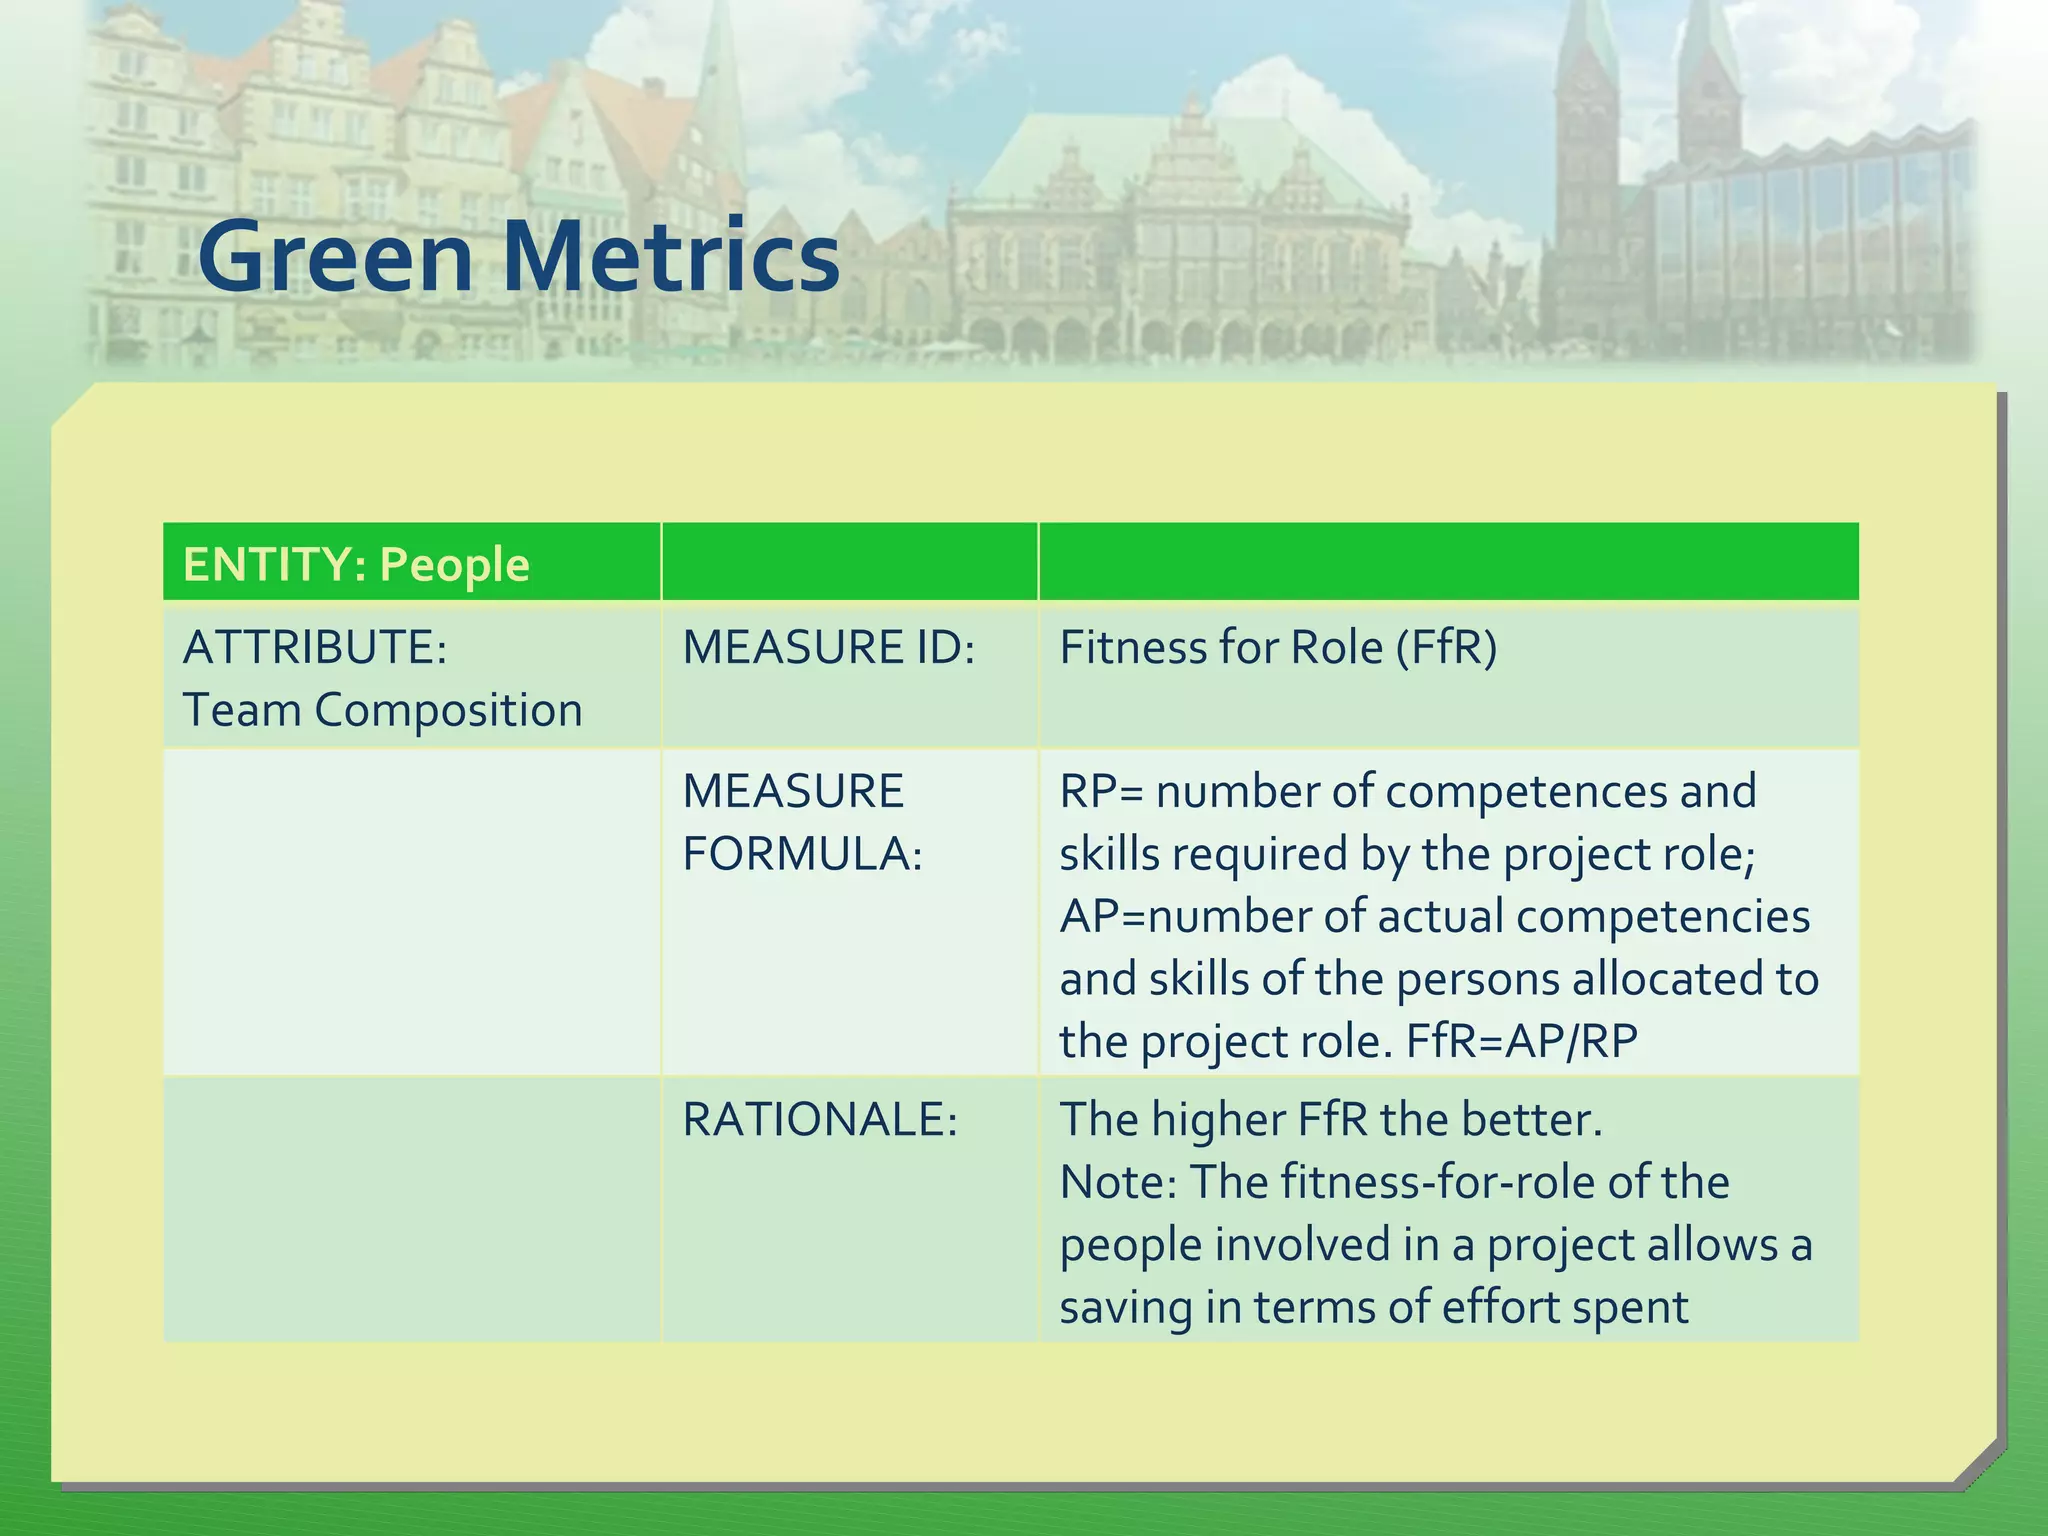
ENTITY:
Process
ATTRIBUTE: MEASURE ID: Peaks and Lows (PAL)
Process Efficiency MEASURE
FORMULA:
UCL= Upper Control Level; LCL =
Lower Control Level; PAL = amount
of work days the effort spent is out
of the range [UCL, LCL]
RATIONALE: The lower PAL the better.](https://image.slidesharecdn.com/spice2013greenmetrics-130627015744-phpapp02/75/Derivation-of-Green-Metrics-for-Software-20-2048.jpg)
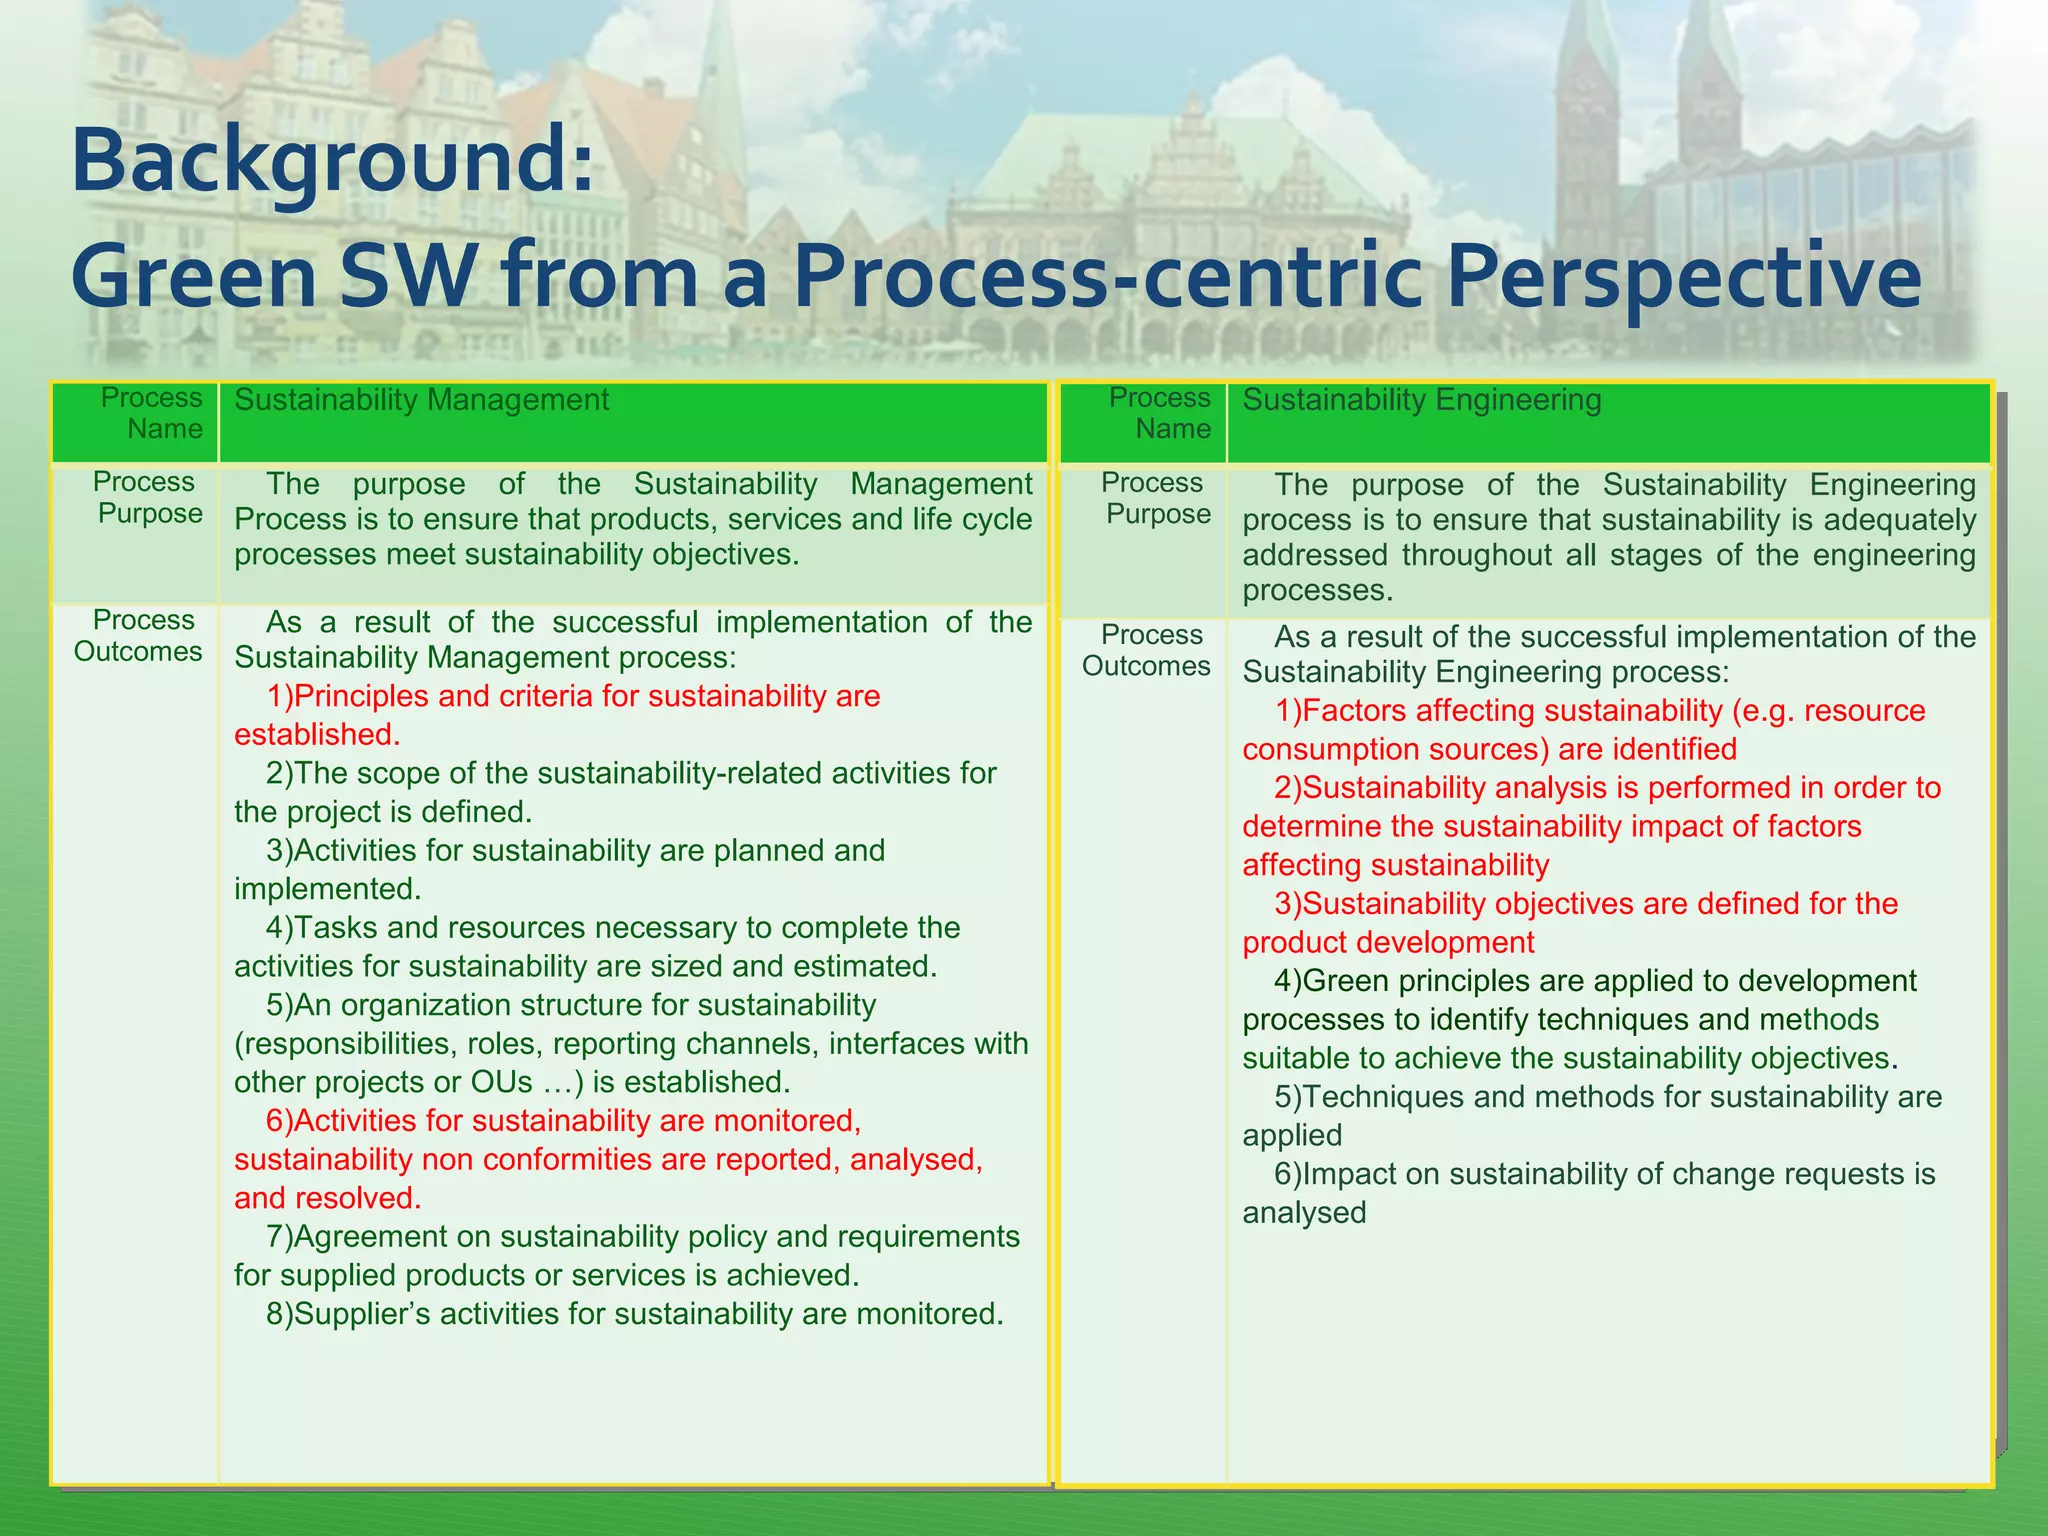
![Green Metrics
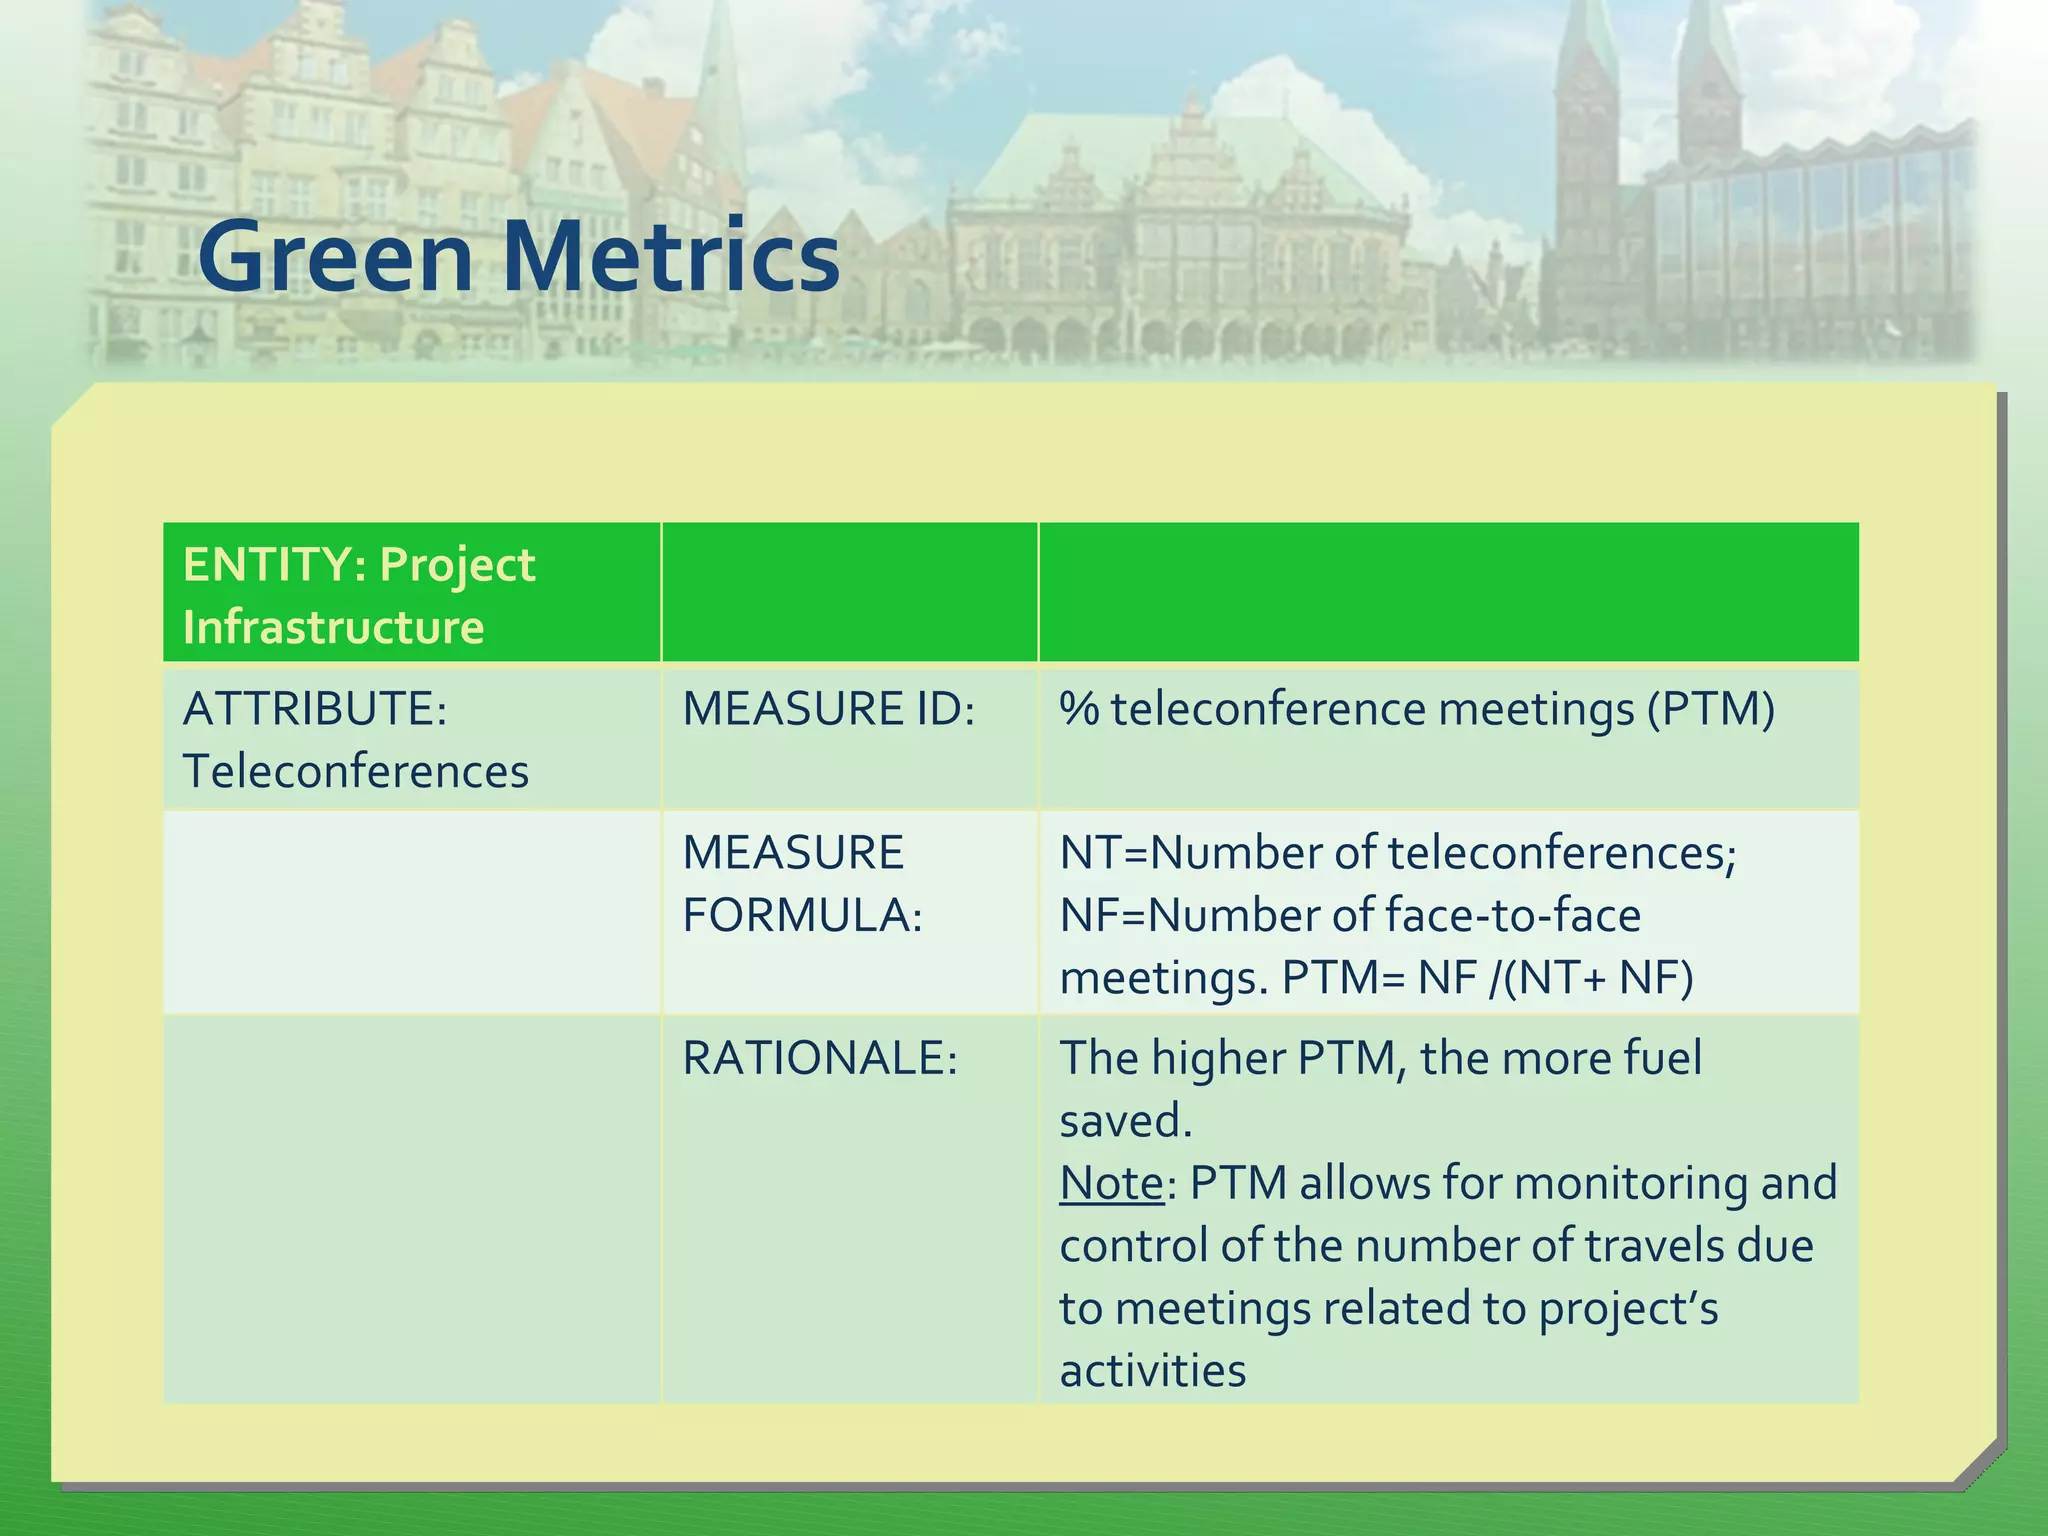
ENTITY:
Process
ATTRIBUTE: MEASURE ID: ISO/IEC 15504 Process Attributes
Ratings (PAR)
Process Capability MEASURE
FORMULA:
[Refer ISO/IEC 15504 ]
RATIONALE: The higher PAR, the better](https://image.slidesharecdn.com/spice2013greenmetrics-130627015744-phpapp02/75/Derivation-of-Green-Metrics-for-Software-22-2048.jpg)
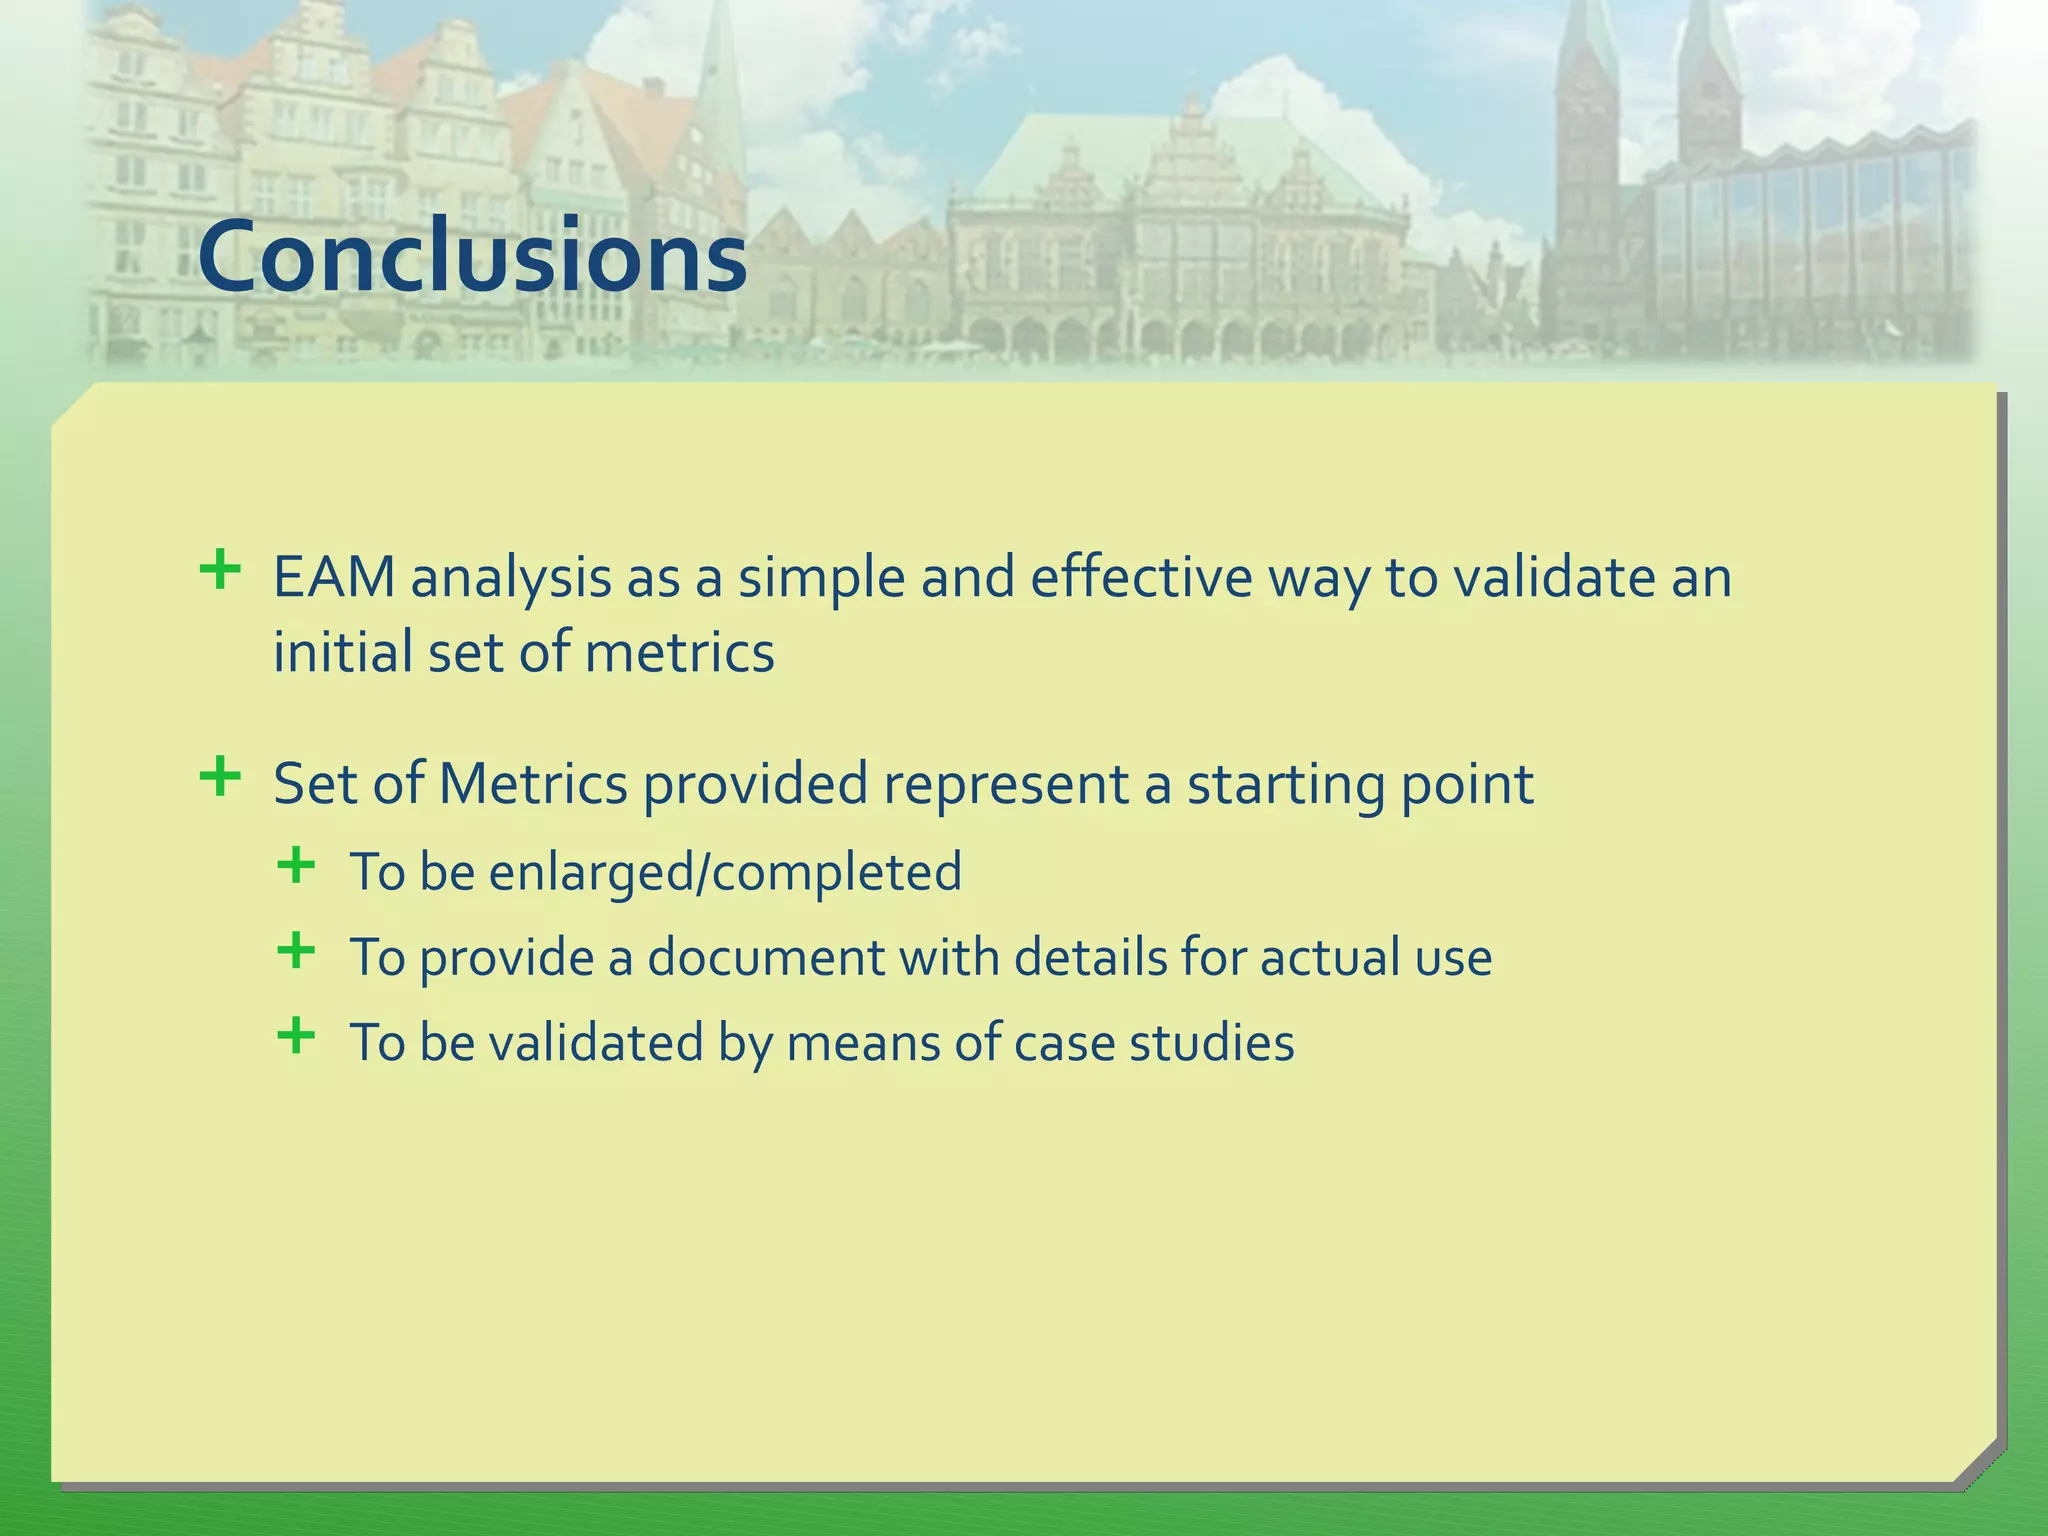

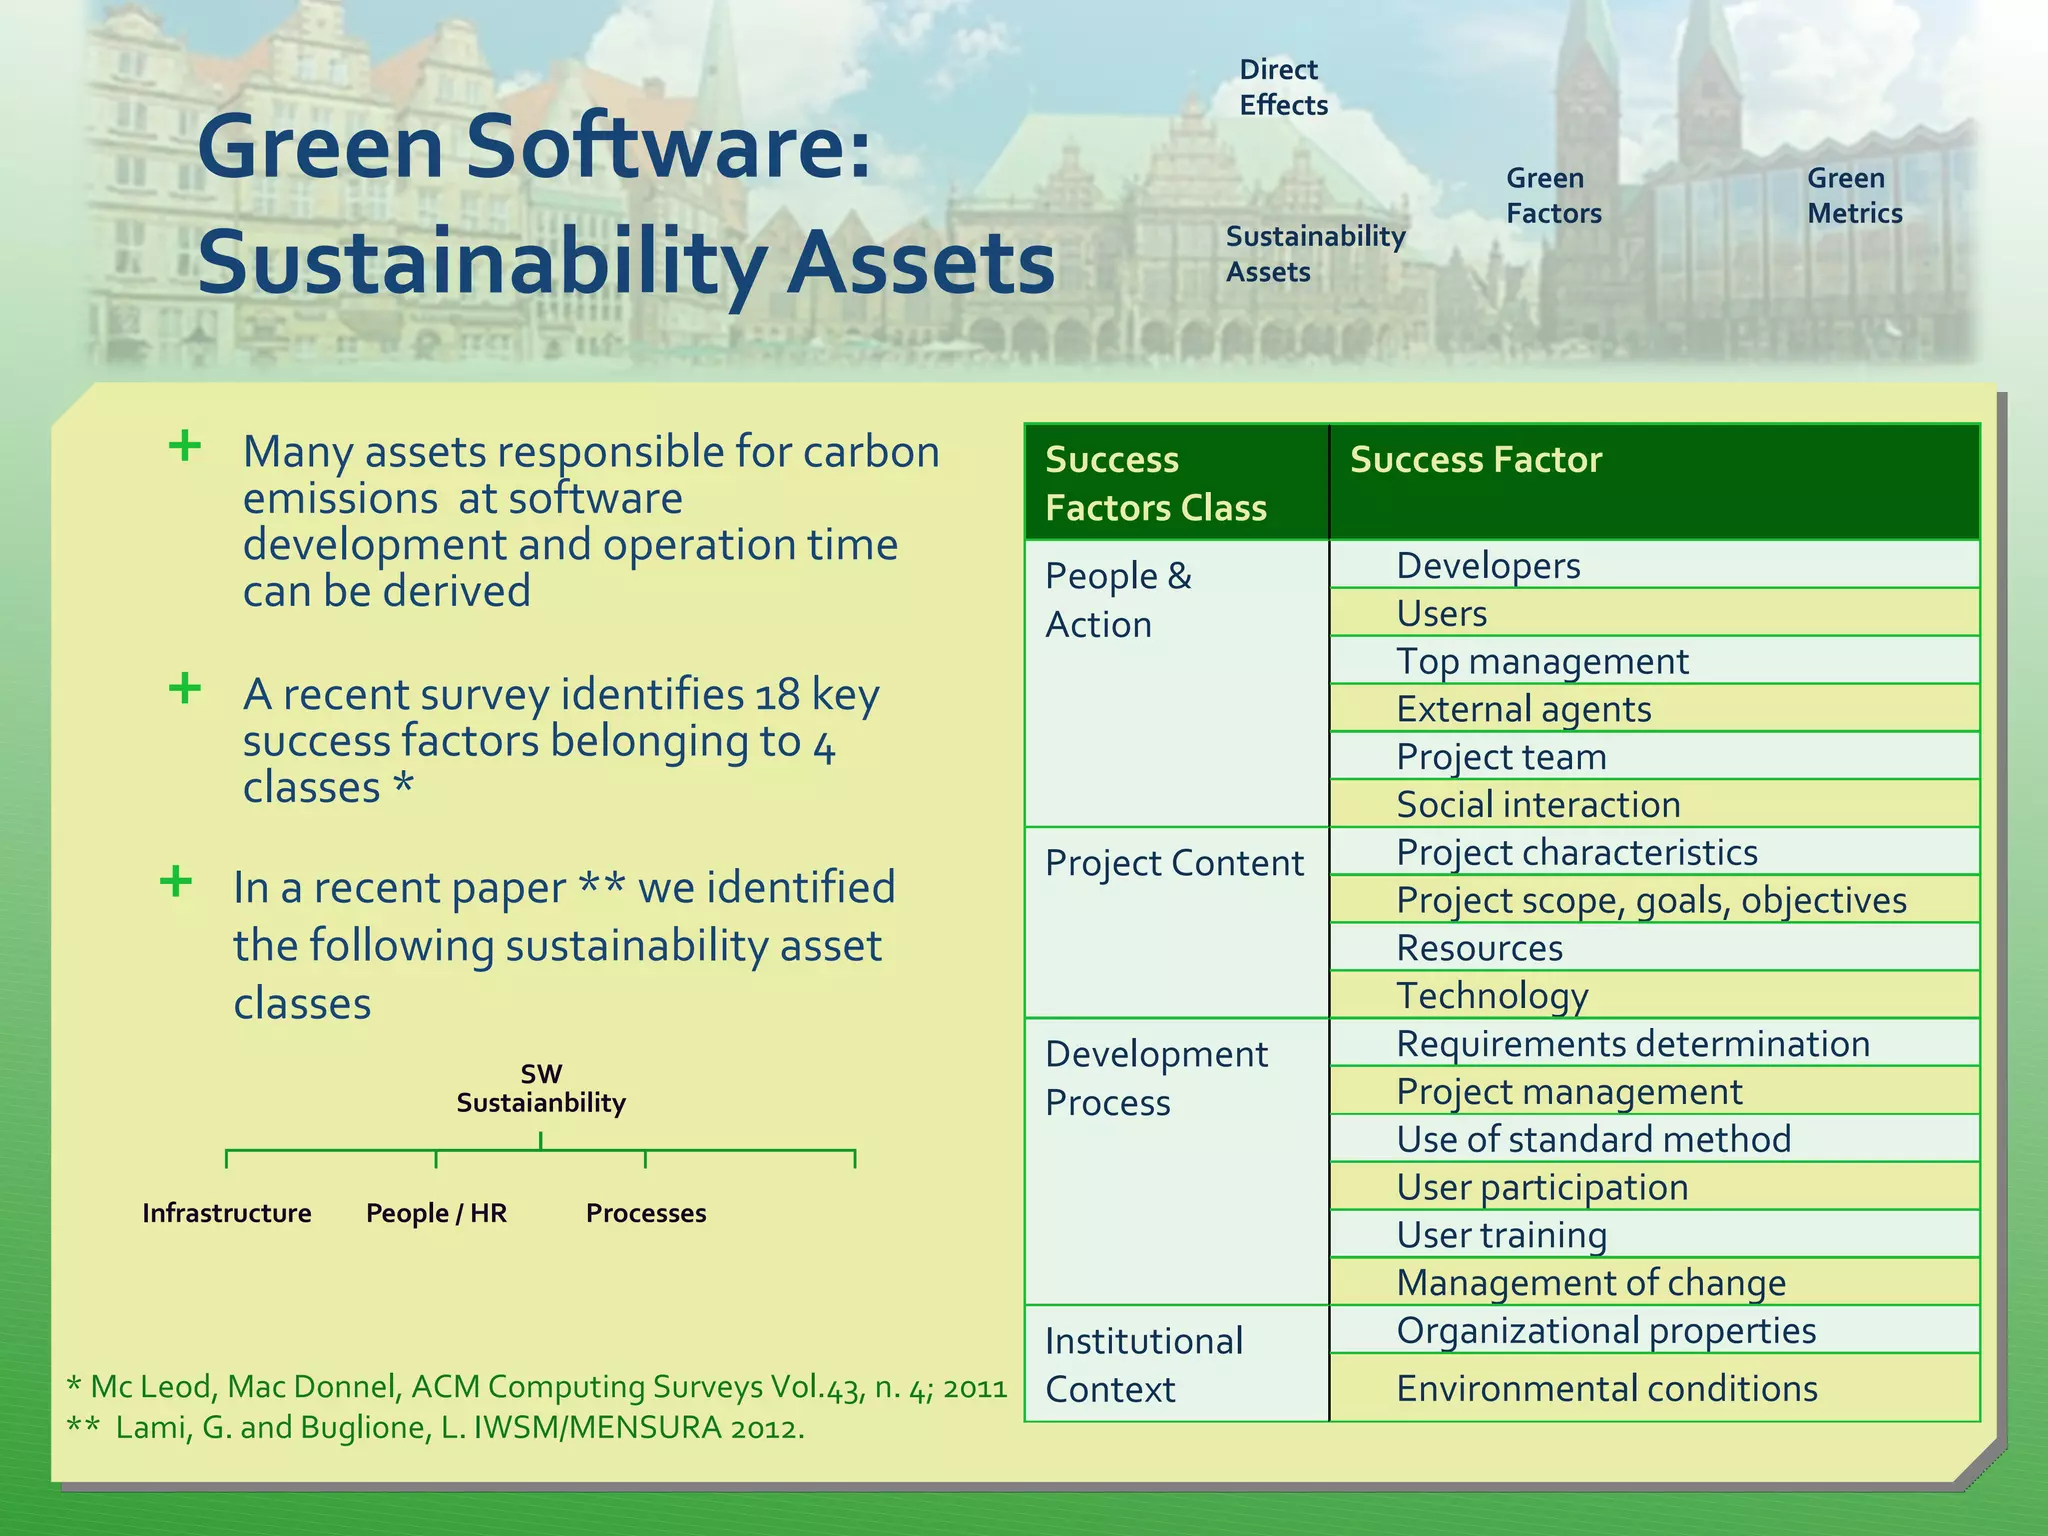
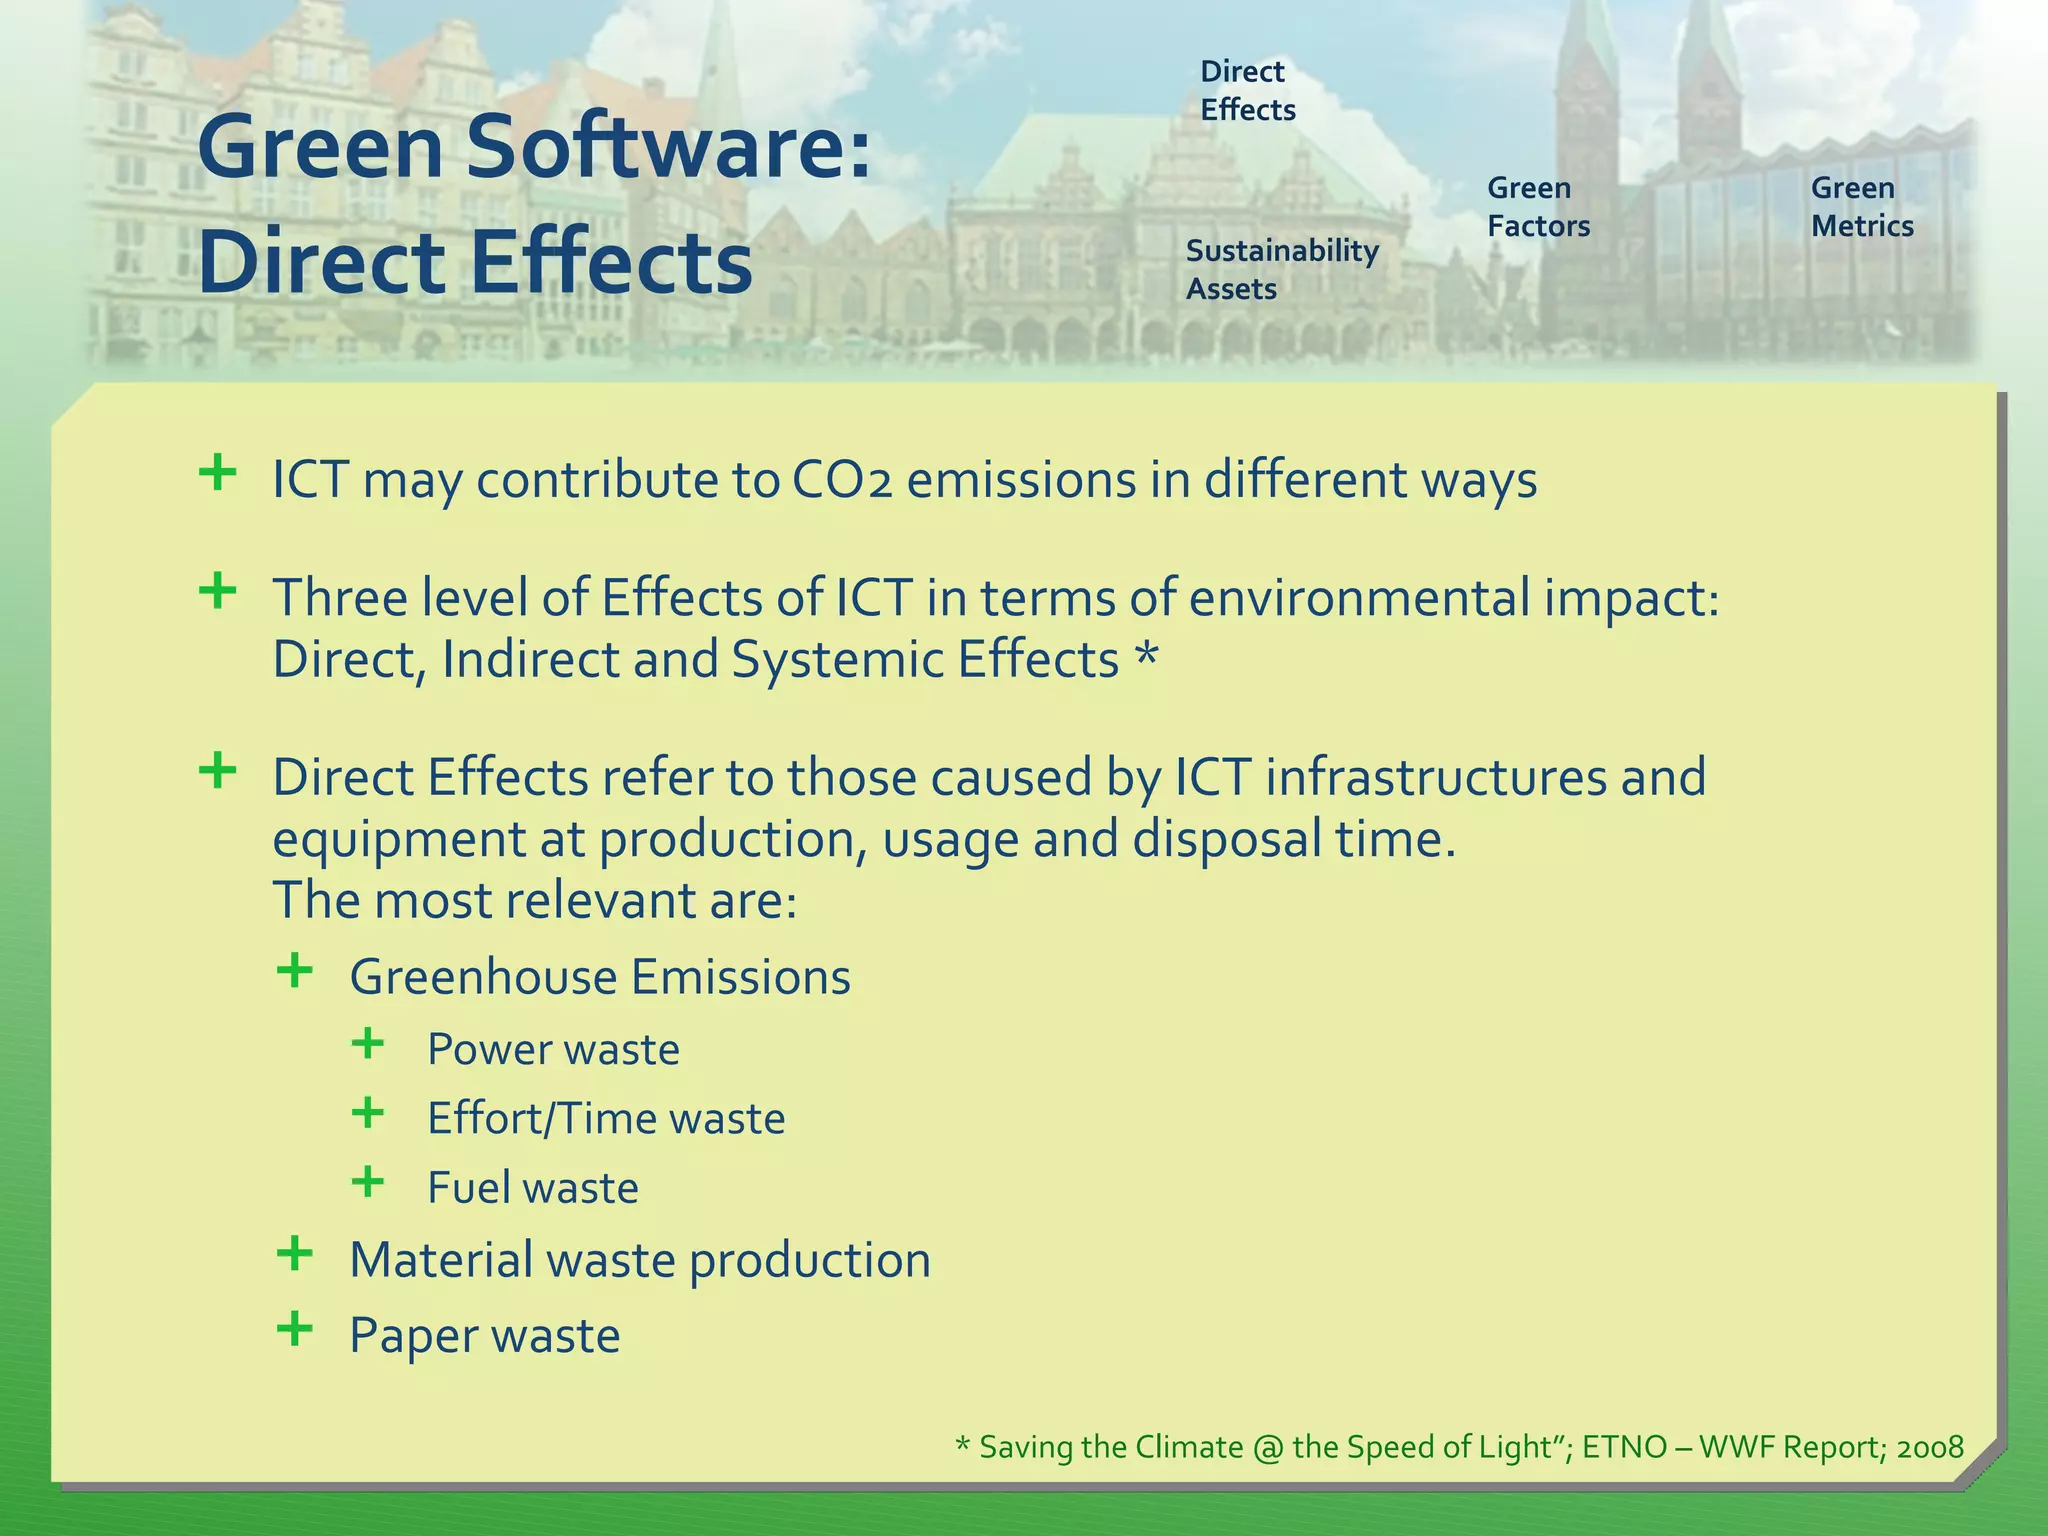
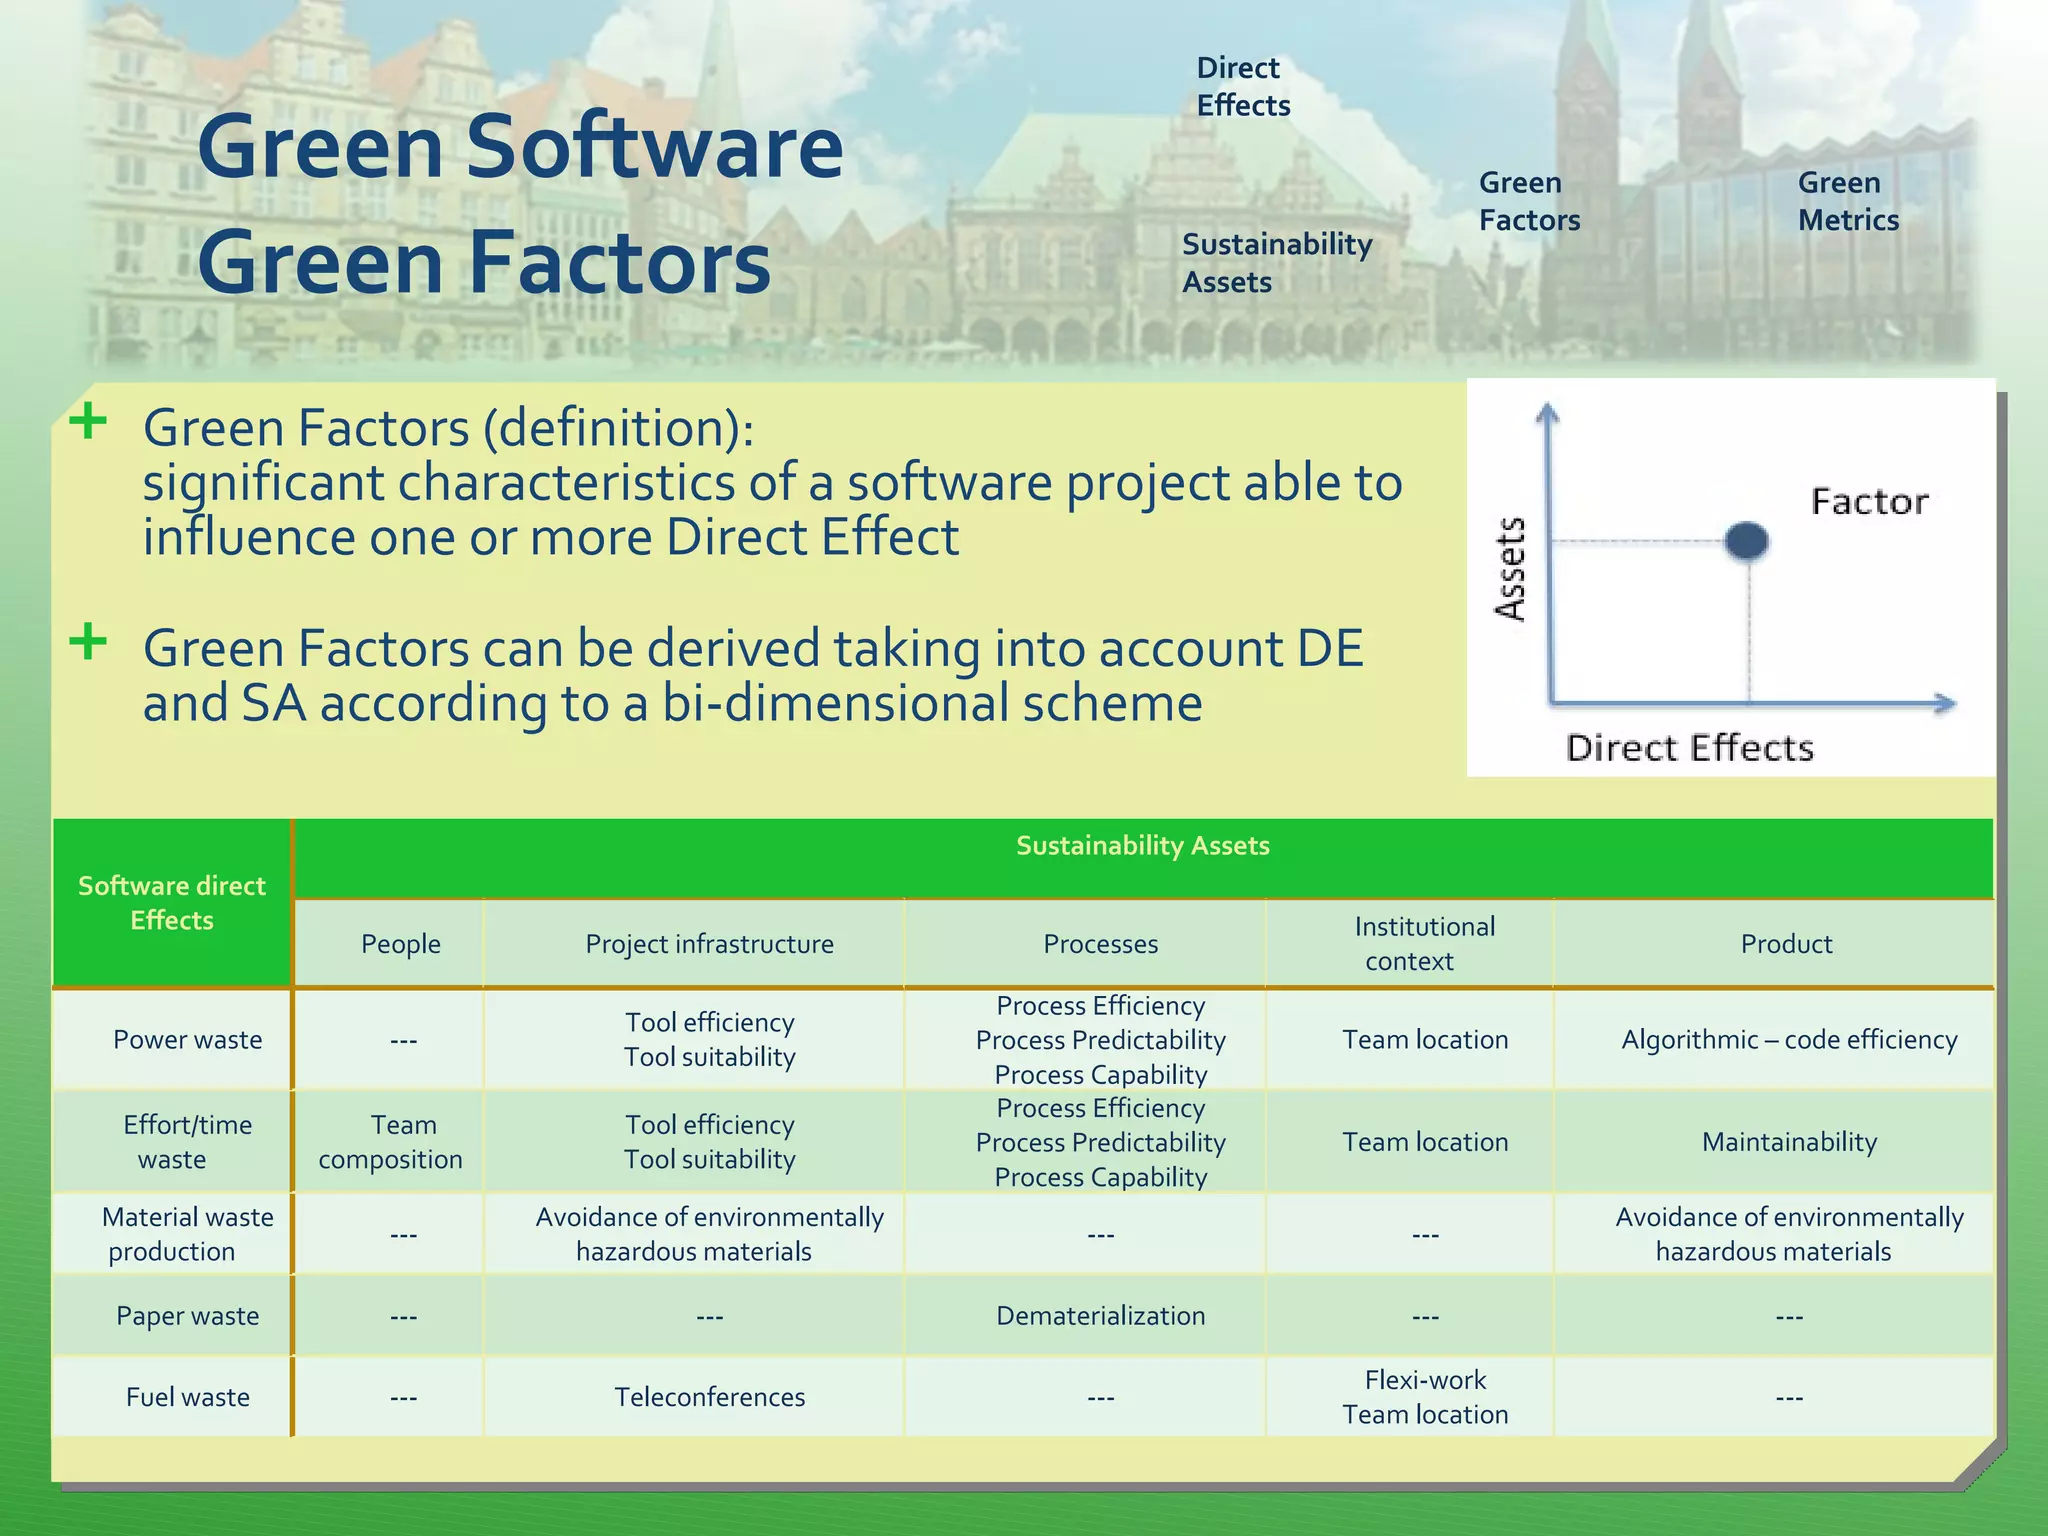
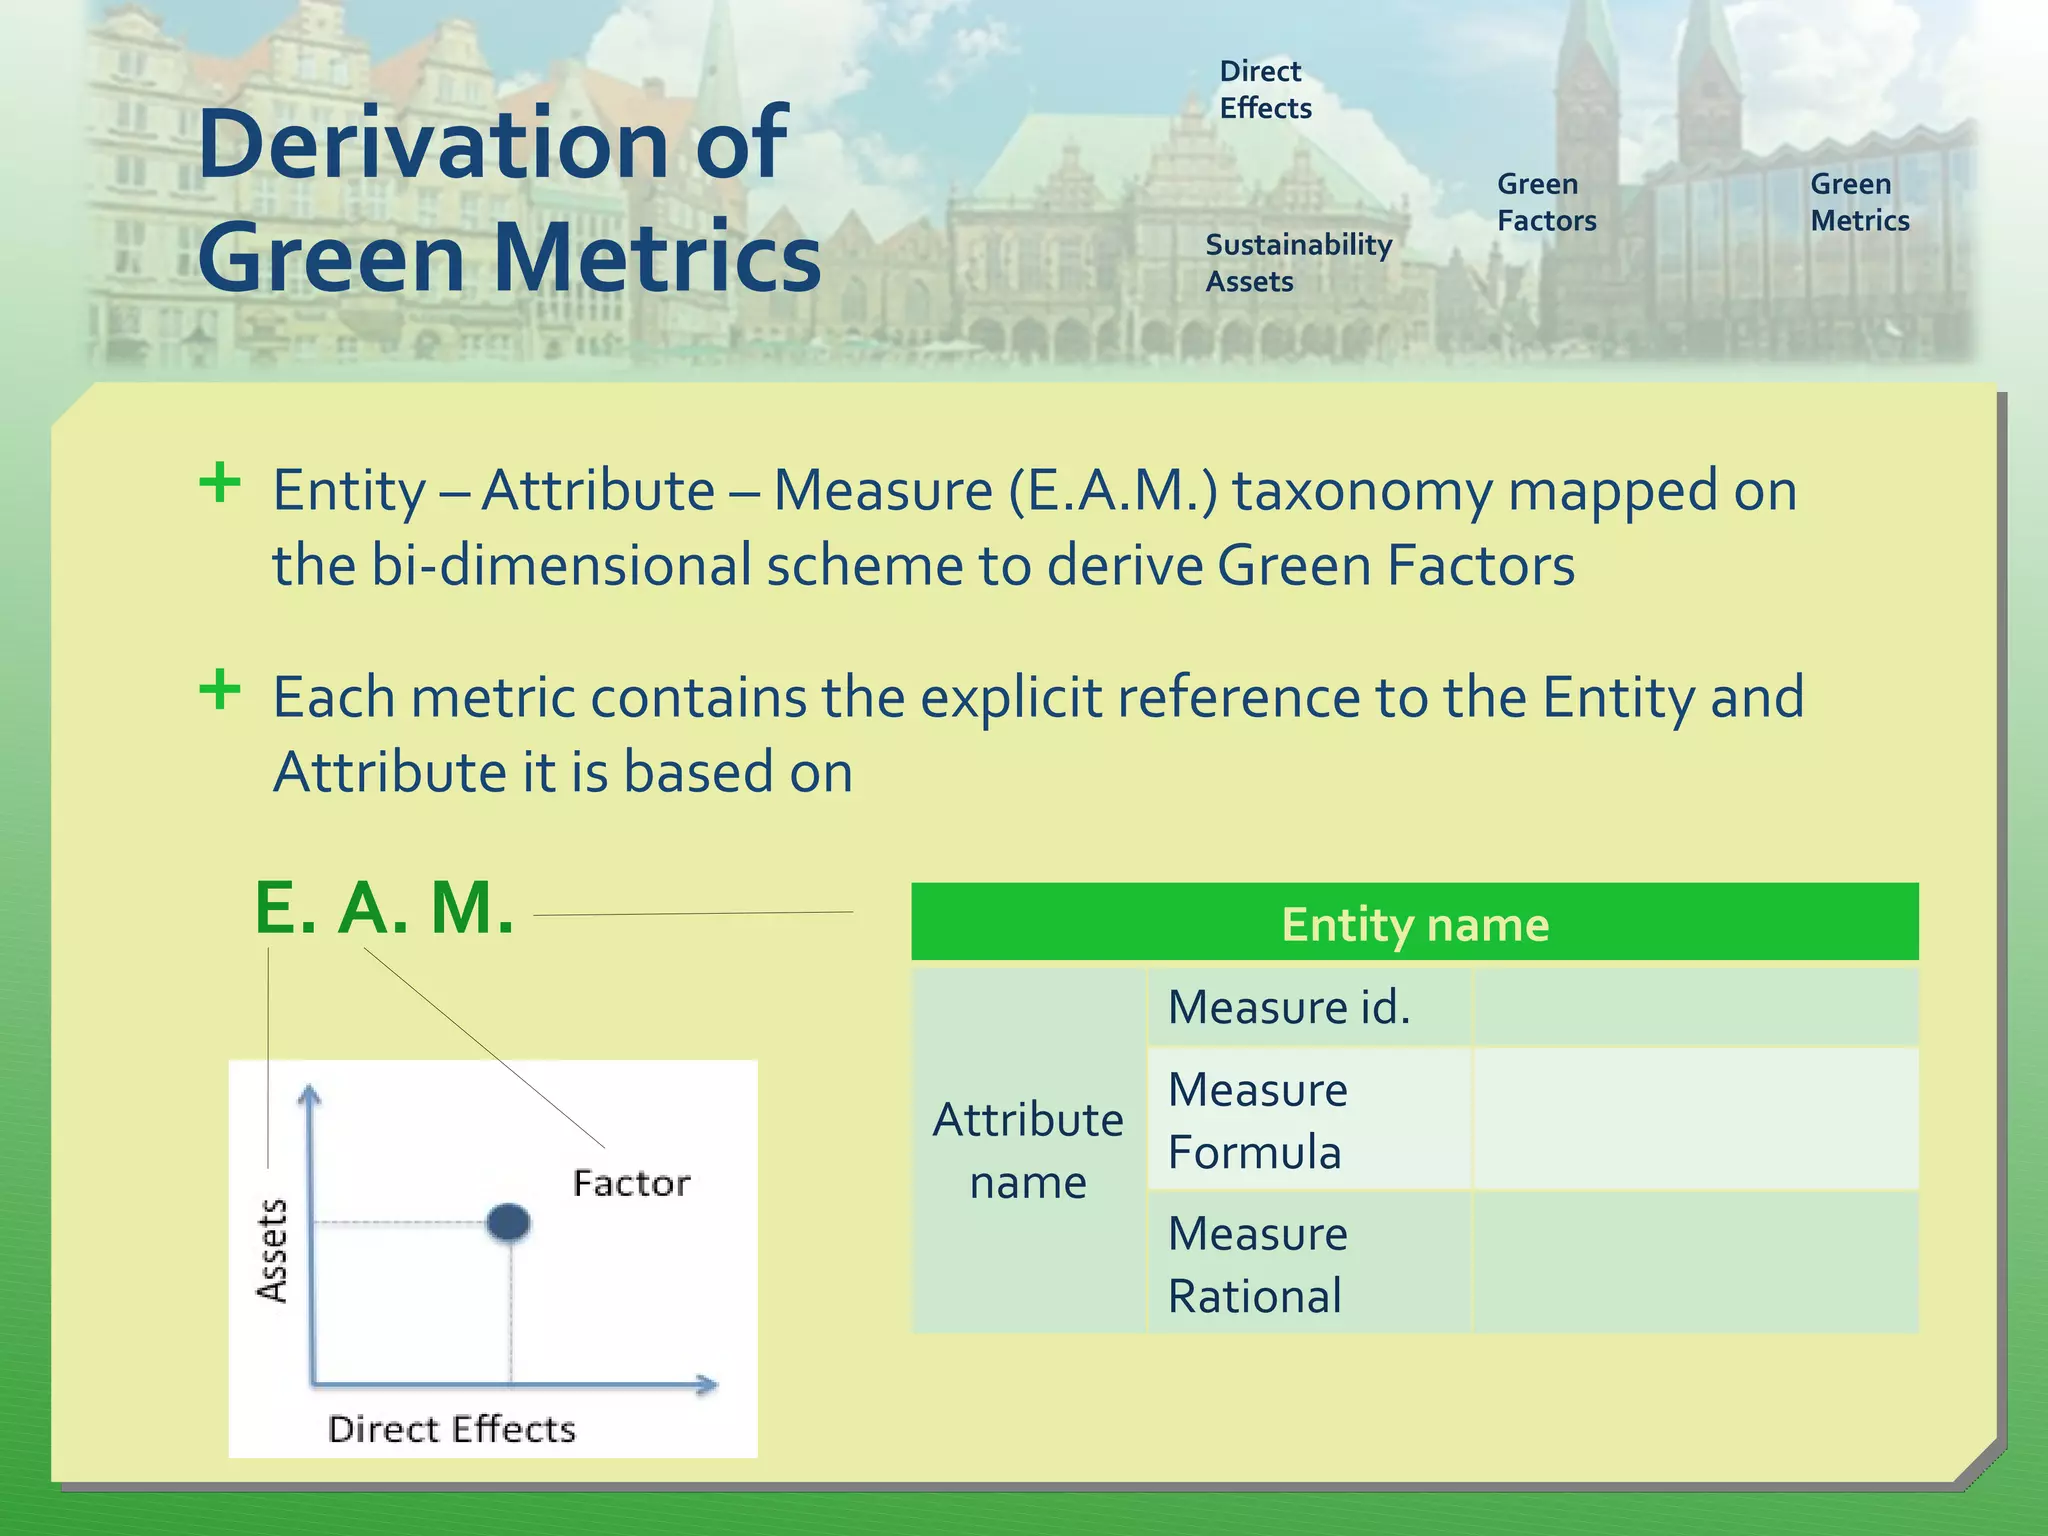
The document proposes deriving green metrics for software by systematically mapping sustainability assets, direct effects, green factors, and an entity-attribute-measure taxonomy. It presents sustainability assets like people, infrastructure, processes, and products that influence direct effects like power waste, effort waste, and material waste. Green factors that impact direct effects are then identified. Finally, example green metrics are defined using the entity-attribute-measure structure and mapped to green factors to allow monitoring of software sustainability performance. The metrics provide a starting point to help organizations deploy and control sustainability-related processes.


![Vibe Coding vs. Spec-Driven Development [Free Meetup]](https://cdn.slidesharecdn.com/ss_thumbnails/vibecodingvsspecdrivendevelopment-251209105622-43f455e7-thumbnail.jpg?width=640&height=640&fit=bounds)


