Download to read offline
![_____________________________________________________________________________________________________________________
Special Report
09 –APR -2019
Global markets at a glance
The S&P 500 and the Nasdaq edged into positive territory
on Monday, with gains held in check by falling industrials as
investors braced for what analysts now expect to be the
first quarter of contracting earnings since 2016.The Dow
Jones Industrial Average fell 83.97 points, or 0.32 percent,
to 26,341.02, the S&P 500 gained 3.03 points, or
0.1 percent, to 2,895.77 and the Nasdaq Composite added
15.19 points, or 0.19 percent, to 7,953.88
Asian shares got off to a subdued start on Tuesday as
investors braced for key events later in the week, including
the kick-off of the US earnings season and a crucial Brexit
summit, while broader concerns over slowing global
growth checked sentiment.MSCI’s broadest index of Asia-
Pacific shares outside Japan was basically flat after
brushing its highest since late August last year during the
previous session. Australian shares dipped 0.25 percent
while Japan’s Nikkei was down 0.15 percent.Trends on SGX
Nifty indicate a flat opening for the broader index in India,
a slip of 1 point or 0.01 percent. Nifty futures were trading
around 10,682-level on the Singaporean Exchange. Oil
prices on Tuesday reached their highest since November as
concerns over exports from war-torn Libya stoked tightness
in the market, with global supply already hit by OPEC-led
production cuts and US sanctions on Iran and Venezuela.
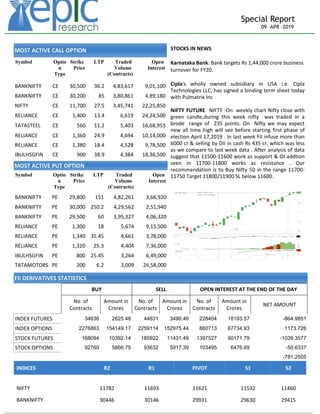
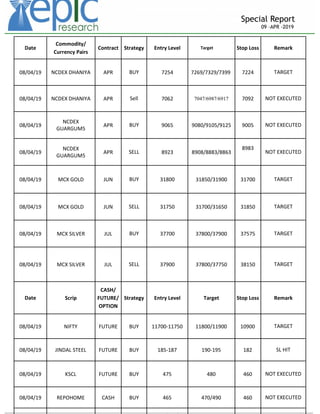
PREVIOUS DAY ROUNDOFF
Indian equity markets closed lower with both Nifty and
Bank Nifty indices losing 0.5% and 0.8% respectively as
across the board profit booking was seen in major largecap
stocks. Reliance Industries was the top contributor to
Nifty’s fall, closing ~1.8% lower.Nifty PSU Bank index traded
with a negative bias throughout the day, closing 1% lower
as marginal hint of short formation was witnessed in stocks
like SBI, PNB & BOI.Nifty midcap 50 index underperformed
the benchmark index by 0.3%. Market breadth ended in
the favour of the declines with advance/decline ratio
closing at 2:3x
Index stats
The Market was very volatile in last session. The sartorial in
dices performed as follow; Commodities[-32.75pts],
C o n s um pt i o n [ - 7 . 0 0 p t s ] , P S E [ - 3 2 .6 0 pt s ], C P SE
[21.65pts],Energy[-188.15pts],FMCG[-64.7pts],Auto[-
38.30pts],Pharma[-27.65pts],IT[+105.20pts],Metal[-30.65
pts],Realty[-6.05pts], Fin Serv sector[-90.90pts].
World Indices
Index Value % Change
DJI 26424 +0.15
S&P500 2892 +0.46
NASDAQ 7938 +0.59
FTSE100 7446 +0.61
NIKKEI 21789 -0.08
HANG SENG 30064 +0.43
Top Gainers
Company CMP Change % Chg
M&M 667 8.8 1.34
Tech Mahindra 787.15 9.9 1.27
TCS 2,070.75 22.45 1.1
Infosys 767.25 7.95 1.05
Power Grid Corp 198.35 2.05 1.04
Top Losers
Company CMP Change % Chg
Indiabulls Hsg 859.35 -43.7 -4.84
IOC 152.05 -6.4 -4.04
Bajaj Finance 3,024.10 -90.1 -2.89
Vedanta 186.65 -5.05 -2.63
Yes Bank 260.05 -6.8 -2.55
Stocks at 52 Week’s HIGH
Symbol Prev. Close Change %Chg
BALAXI 46.05 2.15 4.9
BILENERGY 3.9 0.15 4
CREDITACC 567.9 -6.75 -1.21
HDFC 2,058.80 28.8 1.43
FMGOETZE 599 27.55 4.86
Indian Indices
Company CMP Change % Chg
NIFTY 11604 -61.5 -0.53
SENSEX 38700 -161.7 -0.42
Stocks at 52 Week’s LOW
Symbol Prev. Close Change %Chg
CANDC 10.55 -0.55 -4.95
COX&KINGS 131.05 -1.15 -0.86
DNAMEDIA 1.05 0.05 4.55
EXCEL 1.3 -0.05 -3.7
GENESYS 88 -3.85 -4.11](https://image.slidesharecdn.com/special-report-09-apr-2019-epic-research-190409054717/85/Special-report-09-apr-2019-epic-research-1-320.jpg)
![_____________________________________________________________________________________________________________________
Special Report
09 –APR -2019
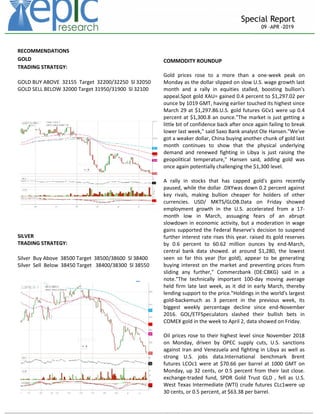
STOCK RECOMMENDATION [CASH]
INFY
INFOSYS — Stock is taking a support of trendline on
weekly chart & also forming a Cup & Handle . Quarterly
result of company is on April 12,2019. Our
recommendation is to Buy Infosys 760-762 Target
770/780 maintain Sl below 750. Market expectation from
company is high on revenue front as we compare with its
peers like TCS , HCL Tech .
MACRO NEWS
Oil prices dipped on Thursday, with Brent edging away
from the psychologically important USD 70 level after
easing in the previous session on data showing a
surprise build in US inventories.Brent futures eased 2
cents to $69.29 by 0100 GMT. On Wednesday, Brent
dipped 6 cents, after touching USD 69.96, the highest
since November 12, when it last traded above USD 70.
US West Texas Intermediate crude was down 14 cents,
or 0.2 percent, at USD 62.34 a barrel.
While it's almost a given that the Reserve Bank of India
(RBI) will deliver a policy rate cut when the three-day
Monetary Policy Committee meeting ends on April 4,
hopes are high that the central bank will also do more
to address liquidity concerns.A poll of about 70
economists conducted by Reuters showed that 85
percent of the participants expect the RBI to cut the
repo rate by 25 basis points to 6percent on April 4 and
then keep the rates on hold through to the middle of
next year at least.
RECOMMENDATIONS [FUTURE]
1. HAVELLS [FUTURE ]
HAVELLS — Stock is trading in channel line & Hammer
pattern form on daily chart . Stock is al;so taking a support of
trend line .RSI & MACD also indicating Buying in this
stock .Our recommendation is to Buy stock future in the
range 767 Target 770-775 maintain sl below 764
2. PVR [FUTURE]
PVR — On weekly chart stock giveen breakout & created
bullish hammer candle stick pattern .Our view on the
technical basis is to buy stock future in range 1690 –1695
Target 1720/1750 Sl below 1650 . Stock is moving above all
its important moving averages like 50,100 & 200 DEMA.](https://image.slidesharecdn.com/special-report-09-apr-2019-epic-research-190409054717/85/Special-report-09-apr-2019-epic-research-2-320.jpg)

The document provides an overview of global market performance and commodity prices. It discusses declines in the Dow and gains in the S&P 500 and Nasdaq on Monday. Asian shares were subdued on Tuesday as investors braced for key events. Oil prices reached their highest since November due to concerns over Libyan exports. The document also provides stock recommendations and analysis of commodity prices and world food prices.


