Download to read offline

![Karvy Investment Advisory Services Limited [KIASL] is a SEBI registered Investment Advisor and provides advisory services. The information in this newsletter has been prepared by
KIASL based on information obtained from public sources and sources believed to be reliable, but no independent verification has been made nor is its accuracy or completeness
guaranteed and the same are subject to change without any notice. This newsletter and information herein is solely for informational purpose and may not be used or considered as
an offer document or solicitation of offer to buy or sell or subscribe to the securities mentioned. The securities discussed and opinions expressed in this newsletter may not be taken
in substitution for the exercise of independent judgment by any recipient as the same may not be suitable for all investors, who must make their own investment decisions, based on
their own investment objectives, financial positions and needs of specific recipient. The information given in this document is for guidance only. Final investment decisions have to be
made by the recipients themselves after independent evaluation of the investment risk. Recipients are advised to consult their respective tax advisers to understand the specific tax
incidence applicable to them. Affiliates of KIASL may from time to time, be engaged in any other transaction involving such securities/commodities and earn brokerage or other
compensation or act as a market maker in the securities/commodities discussed herein or have other potential conflict of interest with respect to any recommendation and related
information and opinions. Wherever products offered by the Karvy Group entities may be recommended, it is to be noted that KIASL does not provide execution services and further
KIASL does not receive any monetary or non monetary benefit as regards such recommendations made.This newsletter and information contained herein is strictly confidential and
meant solely for the selected recipient and may not be altered in any way, transmitted to, copied or distributed, in part or in whole, to any other person or to the media or
reproduced in any form, without prior written consent of KIASL. Past performance is not necessarily a guide to future performance. KIASL and its Group companies or any person
connected with it accepts no liability whatsoever for the content of this newsletter, or for the consequences of any actions taken on the basis of the information provided therein or
for any loss or damage of any kind arising out of the use of this newsletter.
Nothing in this newsletter constitutes investment, legal, accounting and tax advice or a representation that any of the investment mentioned is suitable or appropriate to your specific
circumstances. The information given in this document on tax is for guidance only, and should not be construed as tax advice. Investors are advised to consult their respective tax
advisers to understand the specific tax incidence applicable to them. While we would endeavor to update the information herein on reasonable basis, KIASL , its associated
companies, their directors and employees (“Karvy Group”) are under no obligation to update or keep the information current. Also, there may be regulatory, compliance or other
reasons that may prevent KIASL from doing so. KIASL will not treat recipients as customers by virtue of their receiving this newsletter. The value and return of investment may vary
because of changes in interest rates or any other reason. Karvy Group may have issued other reports that are inconsistent with and reach different conclusion from the information
presented in this newsletter.Recipients are advised to see the offer documents provided by the Issuers/ Product Providers to understand the risks associated before making
investments in the products mentioned. Recipients are cautioned that any forward-looking statements are not predictions and may be subject to change without notice.KIASL
operates from within India and is subject to Indian regulations. This newsletter is not directed or intended for distribution to, or use by, any person or entity who is a citizen or
resident of or located in any locality, state, country or other jurisdiction, where such distribution, publication, availability or use would be contrary to law, regulation or which would
subject KIASL and affiliates to any registration or licensing requirement within such jurisdiction. Certain category of investors in certain jurisdictions may or may not be eligible to
invest in securities mentioned in the newsletter. Persons in whose possession this document may come are required to inform themselves of and to observe such restriction.Entities
of the Karvy Group provide execution services in the capacity of being stock broker, depository participant, portfolio managers and the like. Recipients may choose to execute their
transactions through entities of the Karvy group and pay applicable charge for the same.
Registered office Address:Karvy Investment Advisory Services Limited, ‘Karvy House’, 46, Avenue 4, Street No. 1, Banjara Hills, Hyderabad - 500034
SEBI Registration No: INA200001959
Disclaimer](https://image.slidesharecdn.com/adviceforthewise-february2016-160201122339/85/Advice-For-The-Wise-February-2016-21-320.jpg)

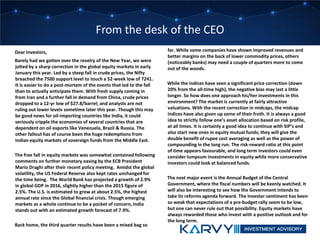
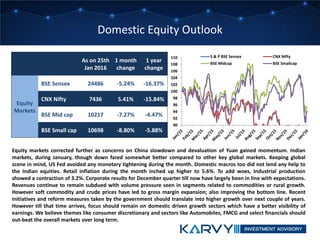
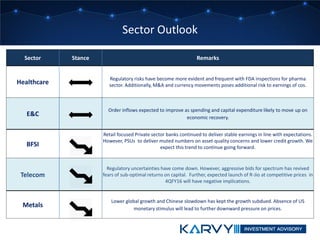
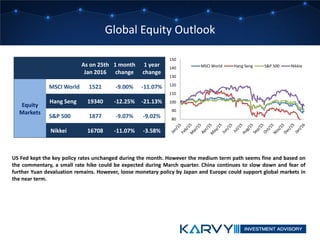
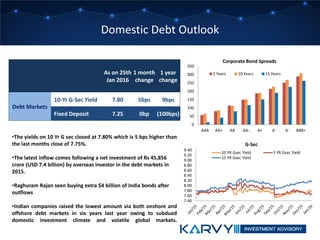
- Global equity markets saw sharp corrections in January led by a steep fall in crude oil prices. The Nifty breached 7500 support level touching a 52-week low. - Third quarter Indian company results were mixed, with some benefiting from lower commodities while banks may need more time to recover. - The budget will be a key upcoming event, with the government expected to focus on rural spending, manufacturing, and fiscal reforms.


