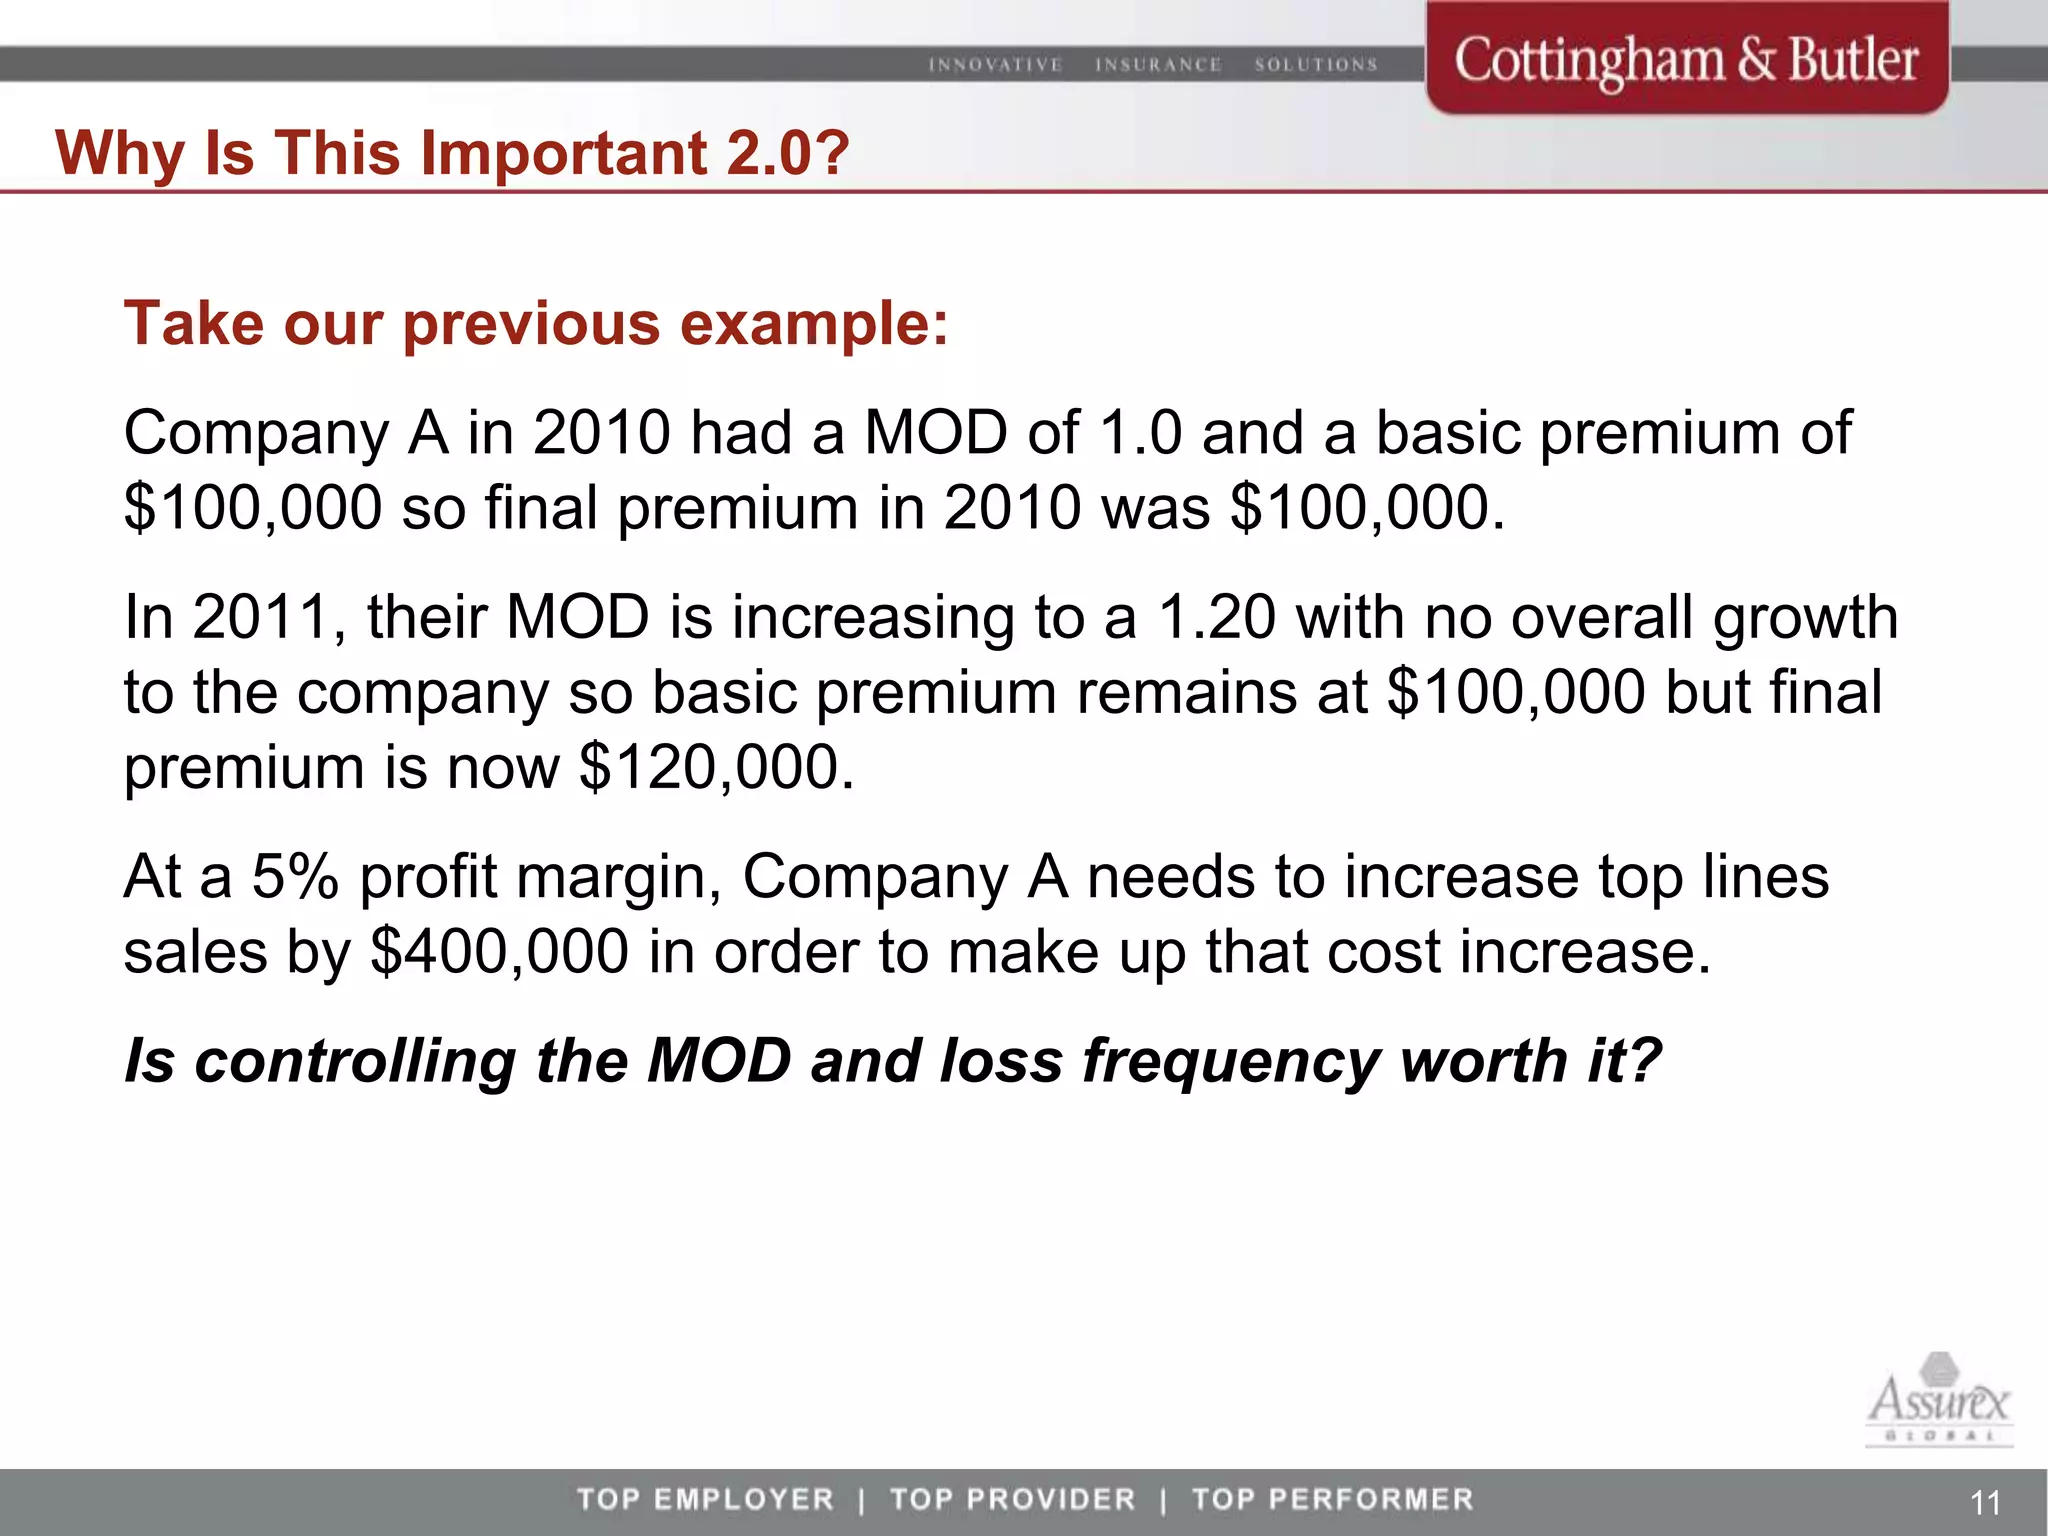
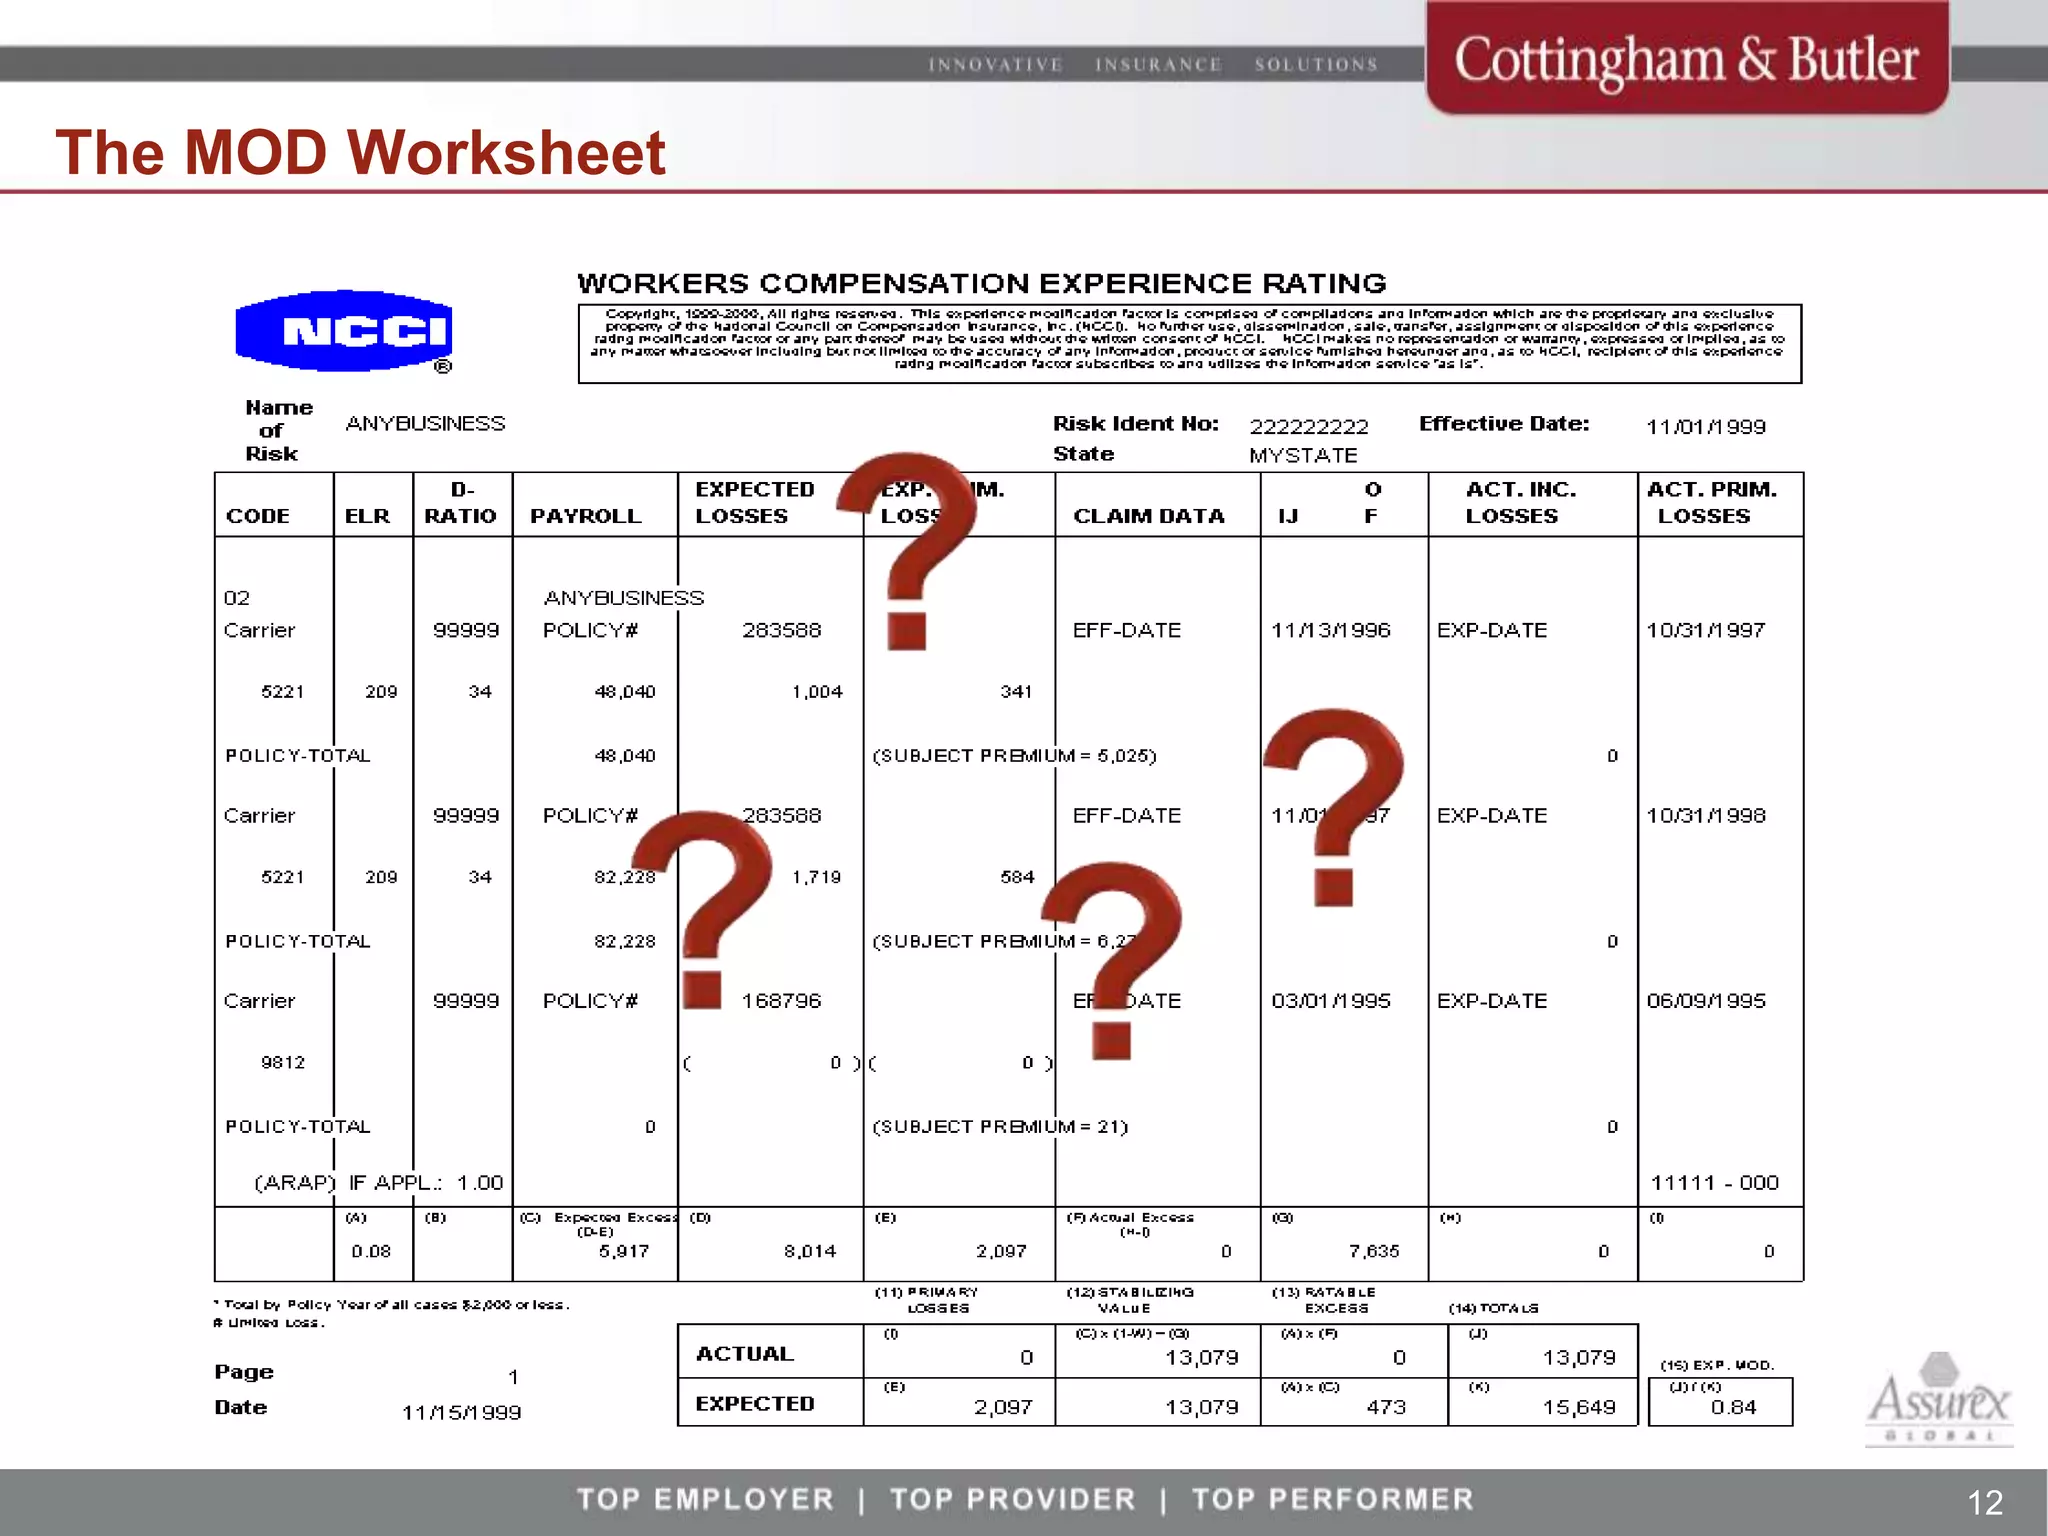
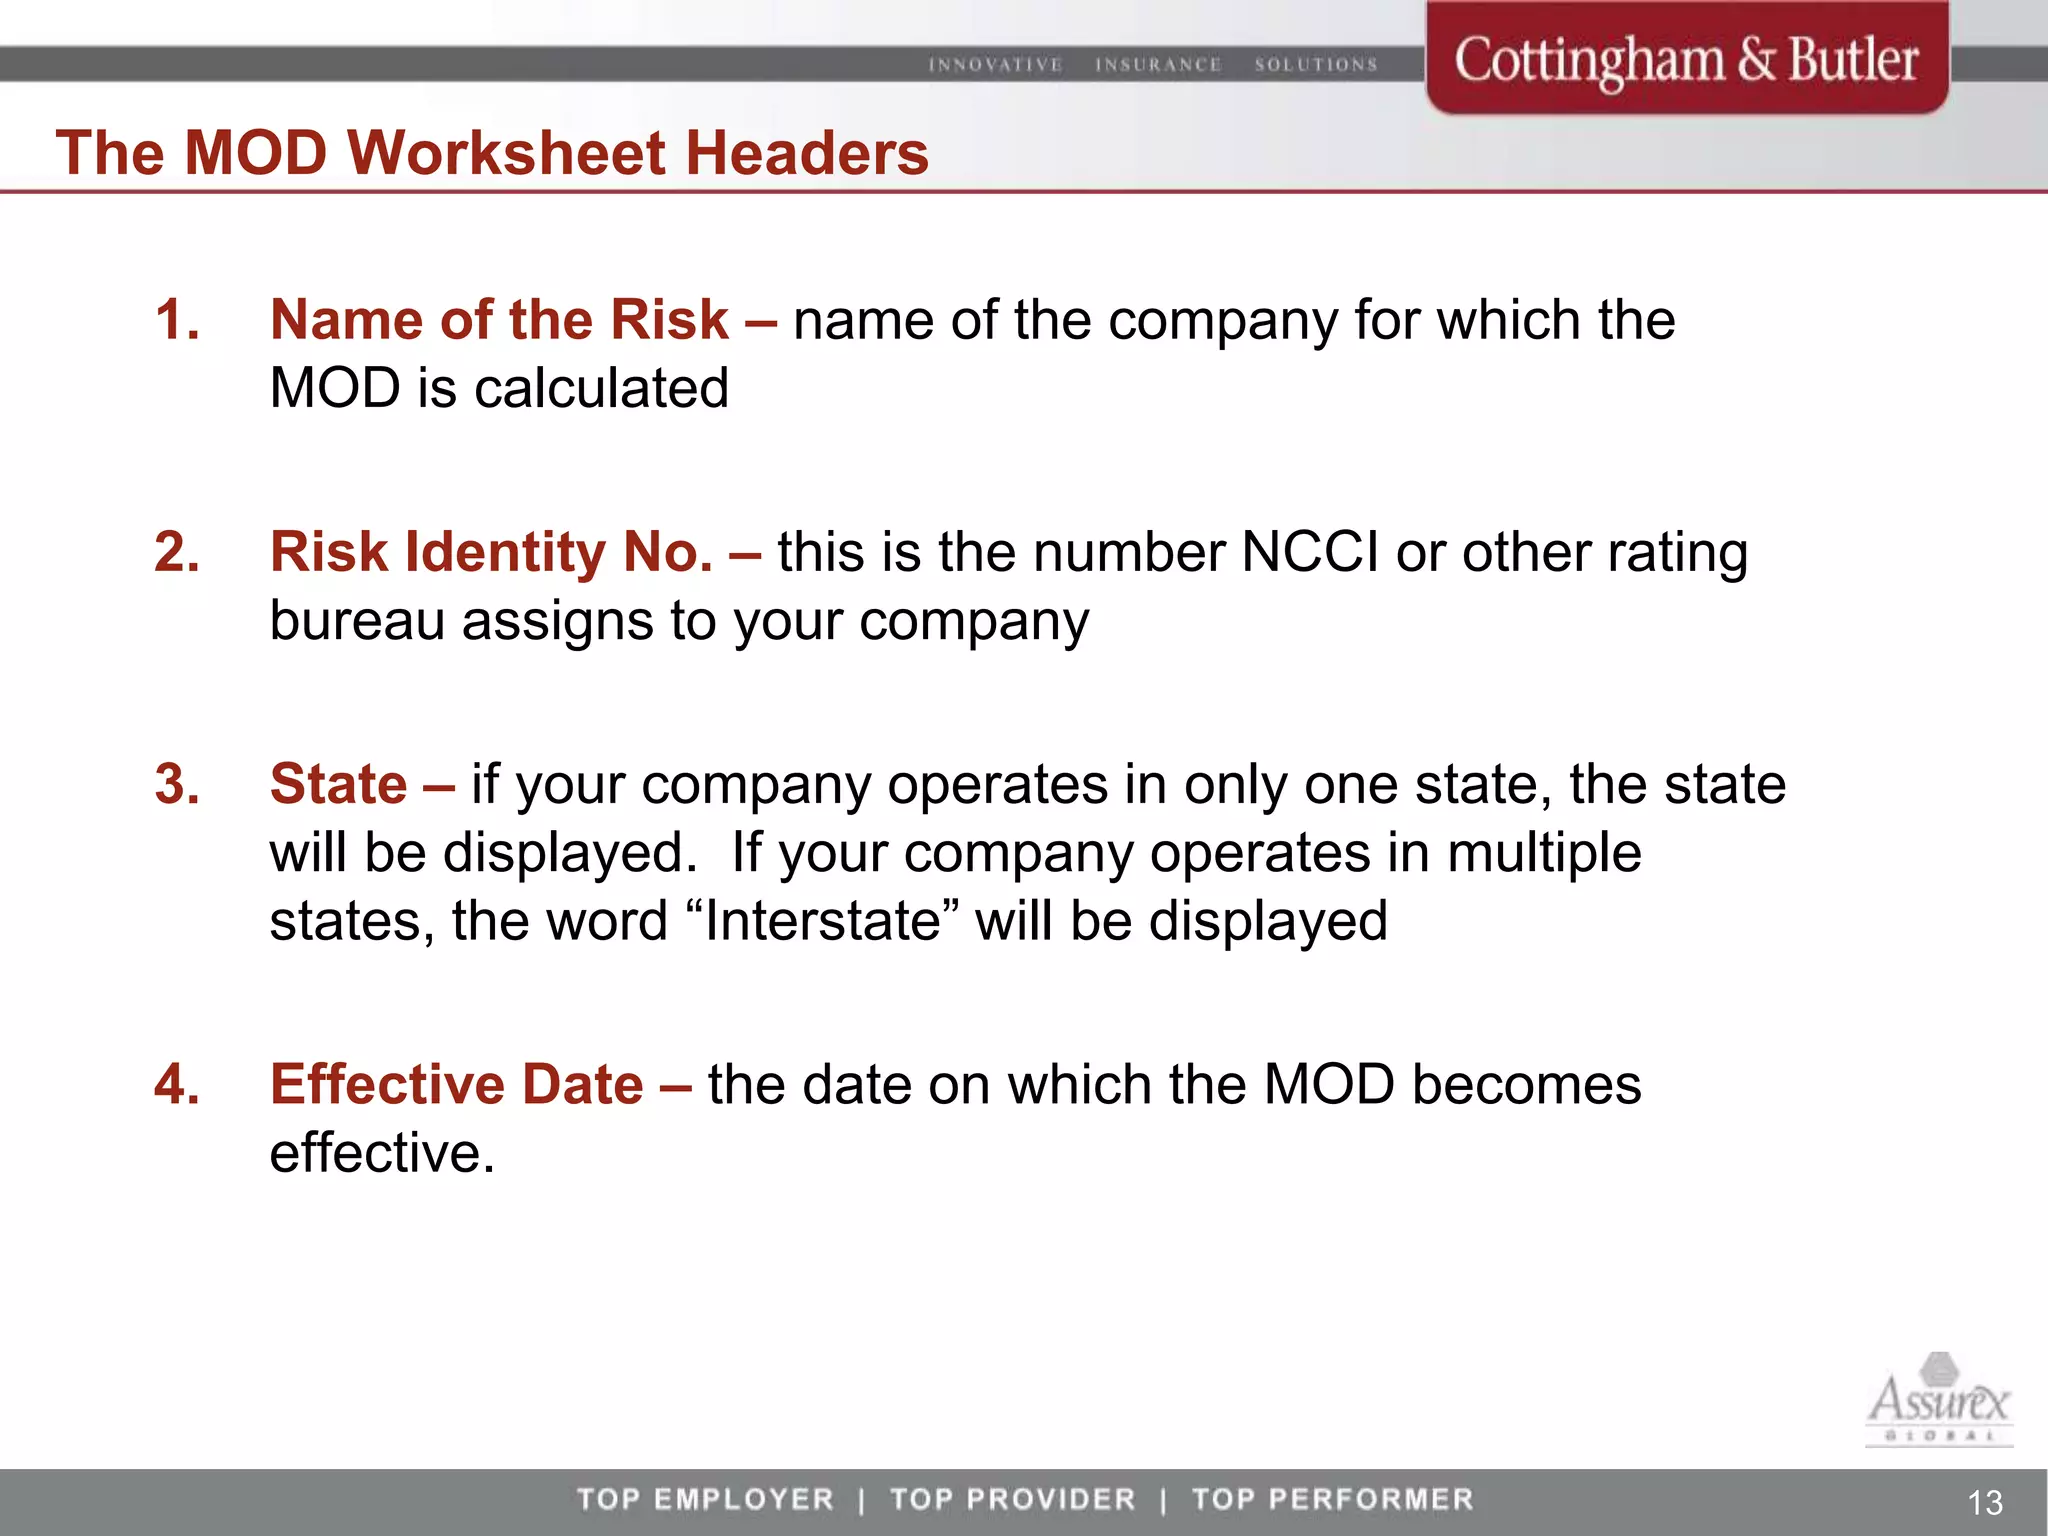
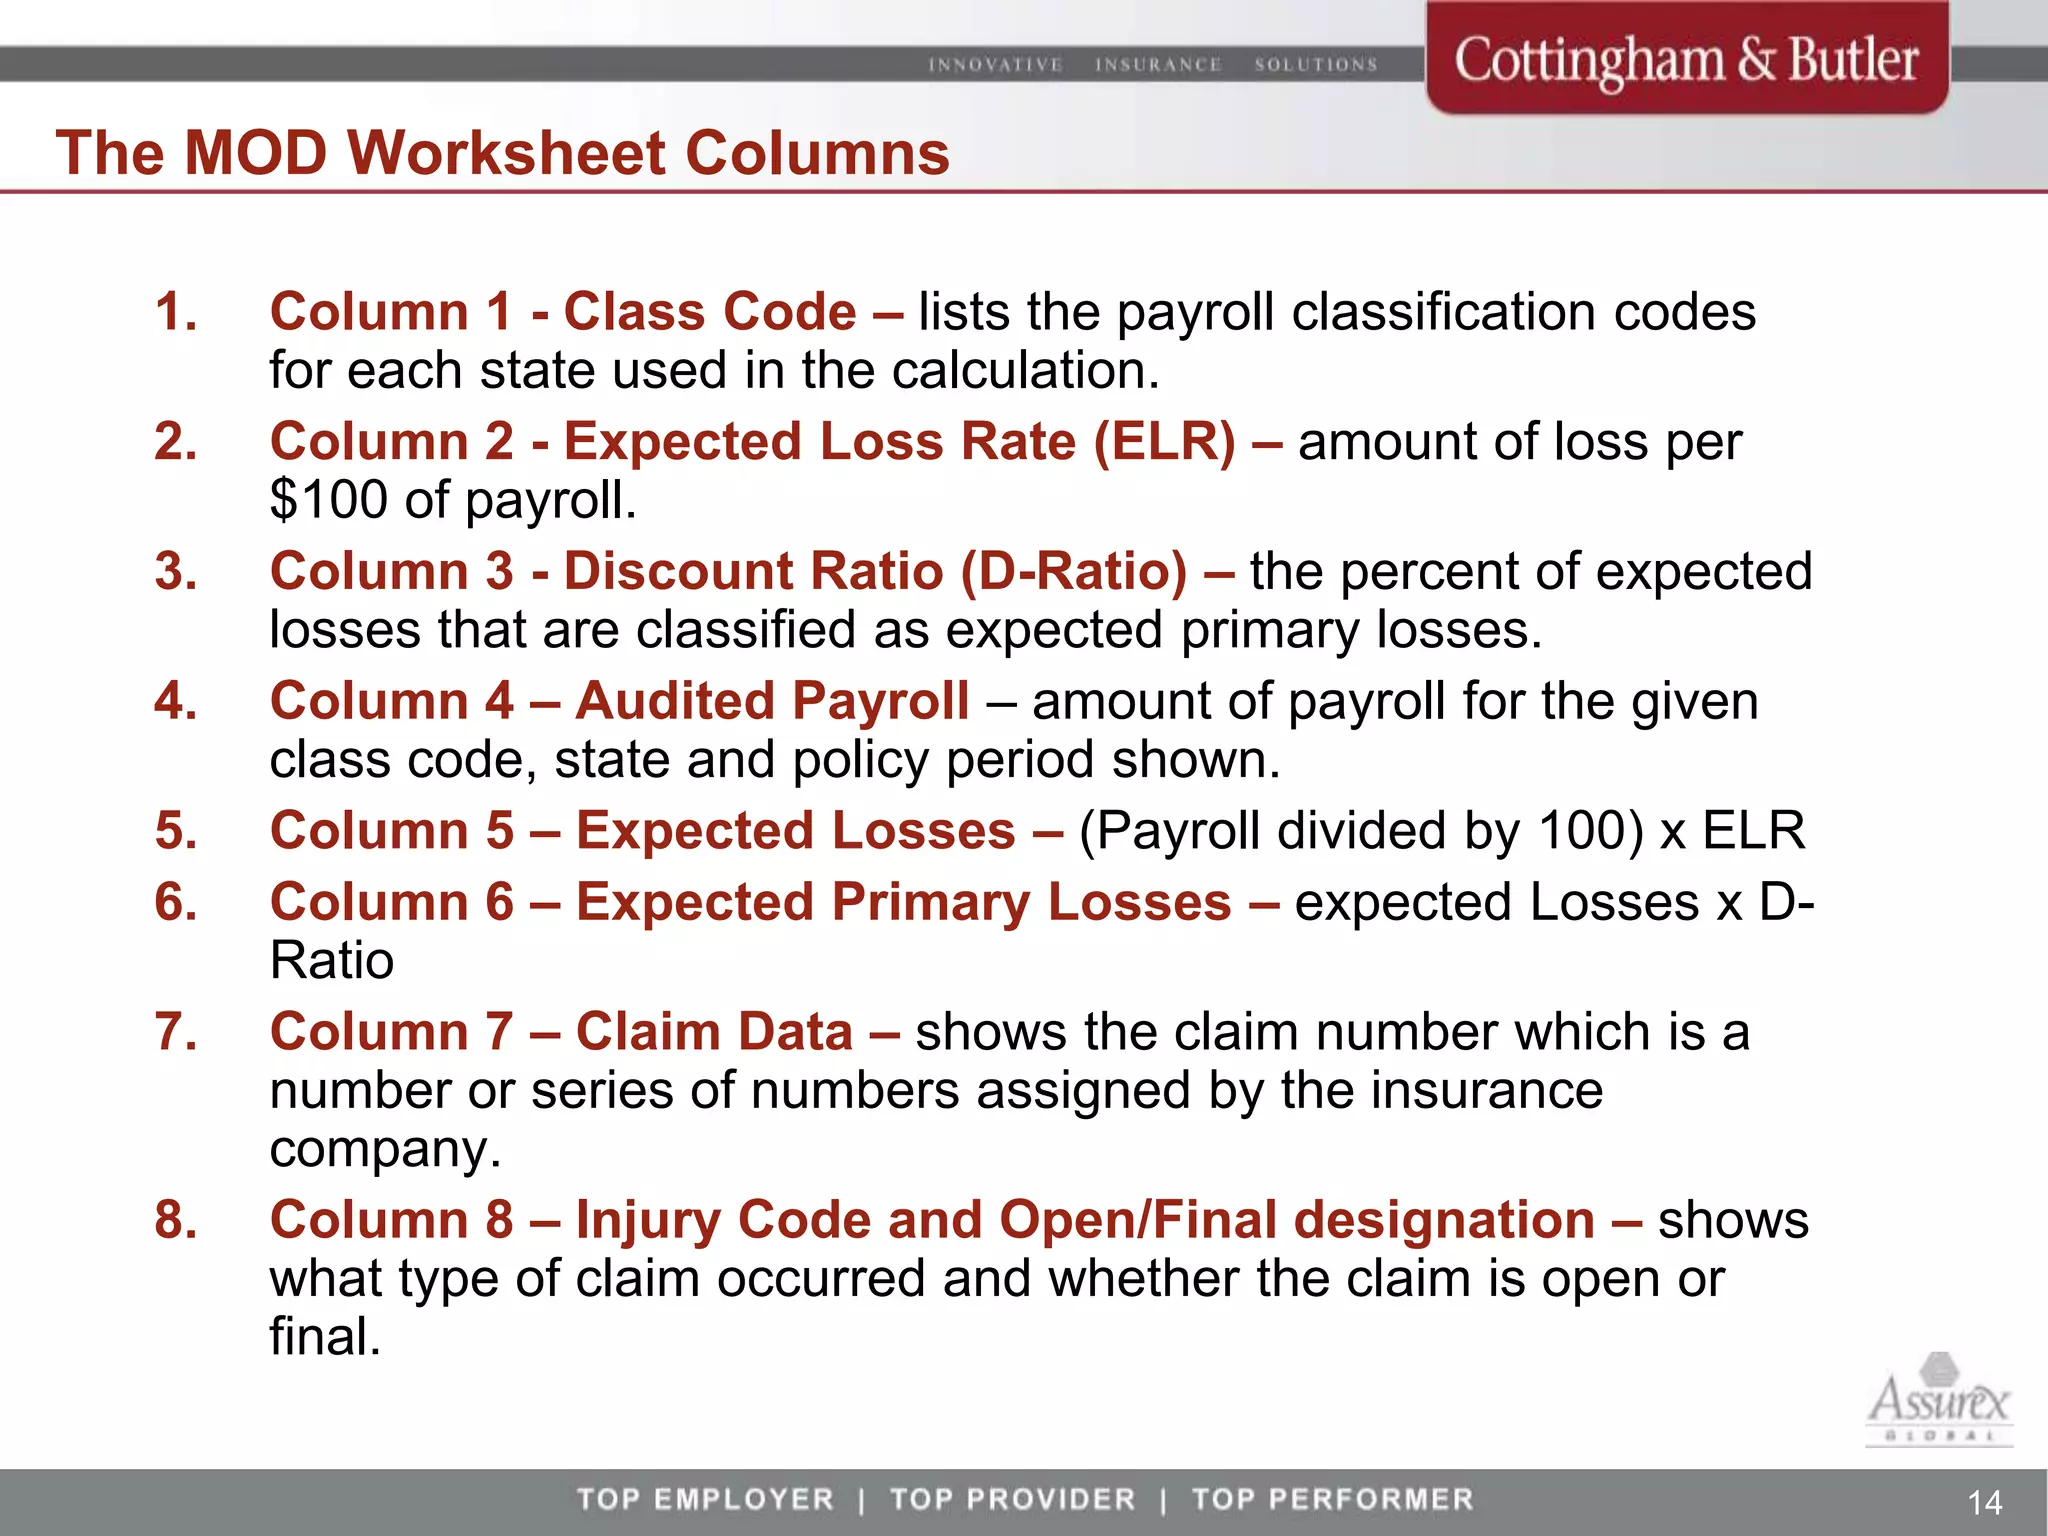
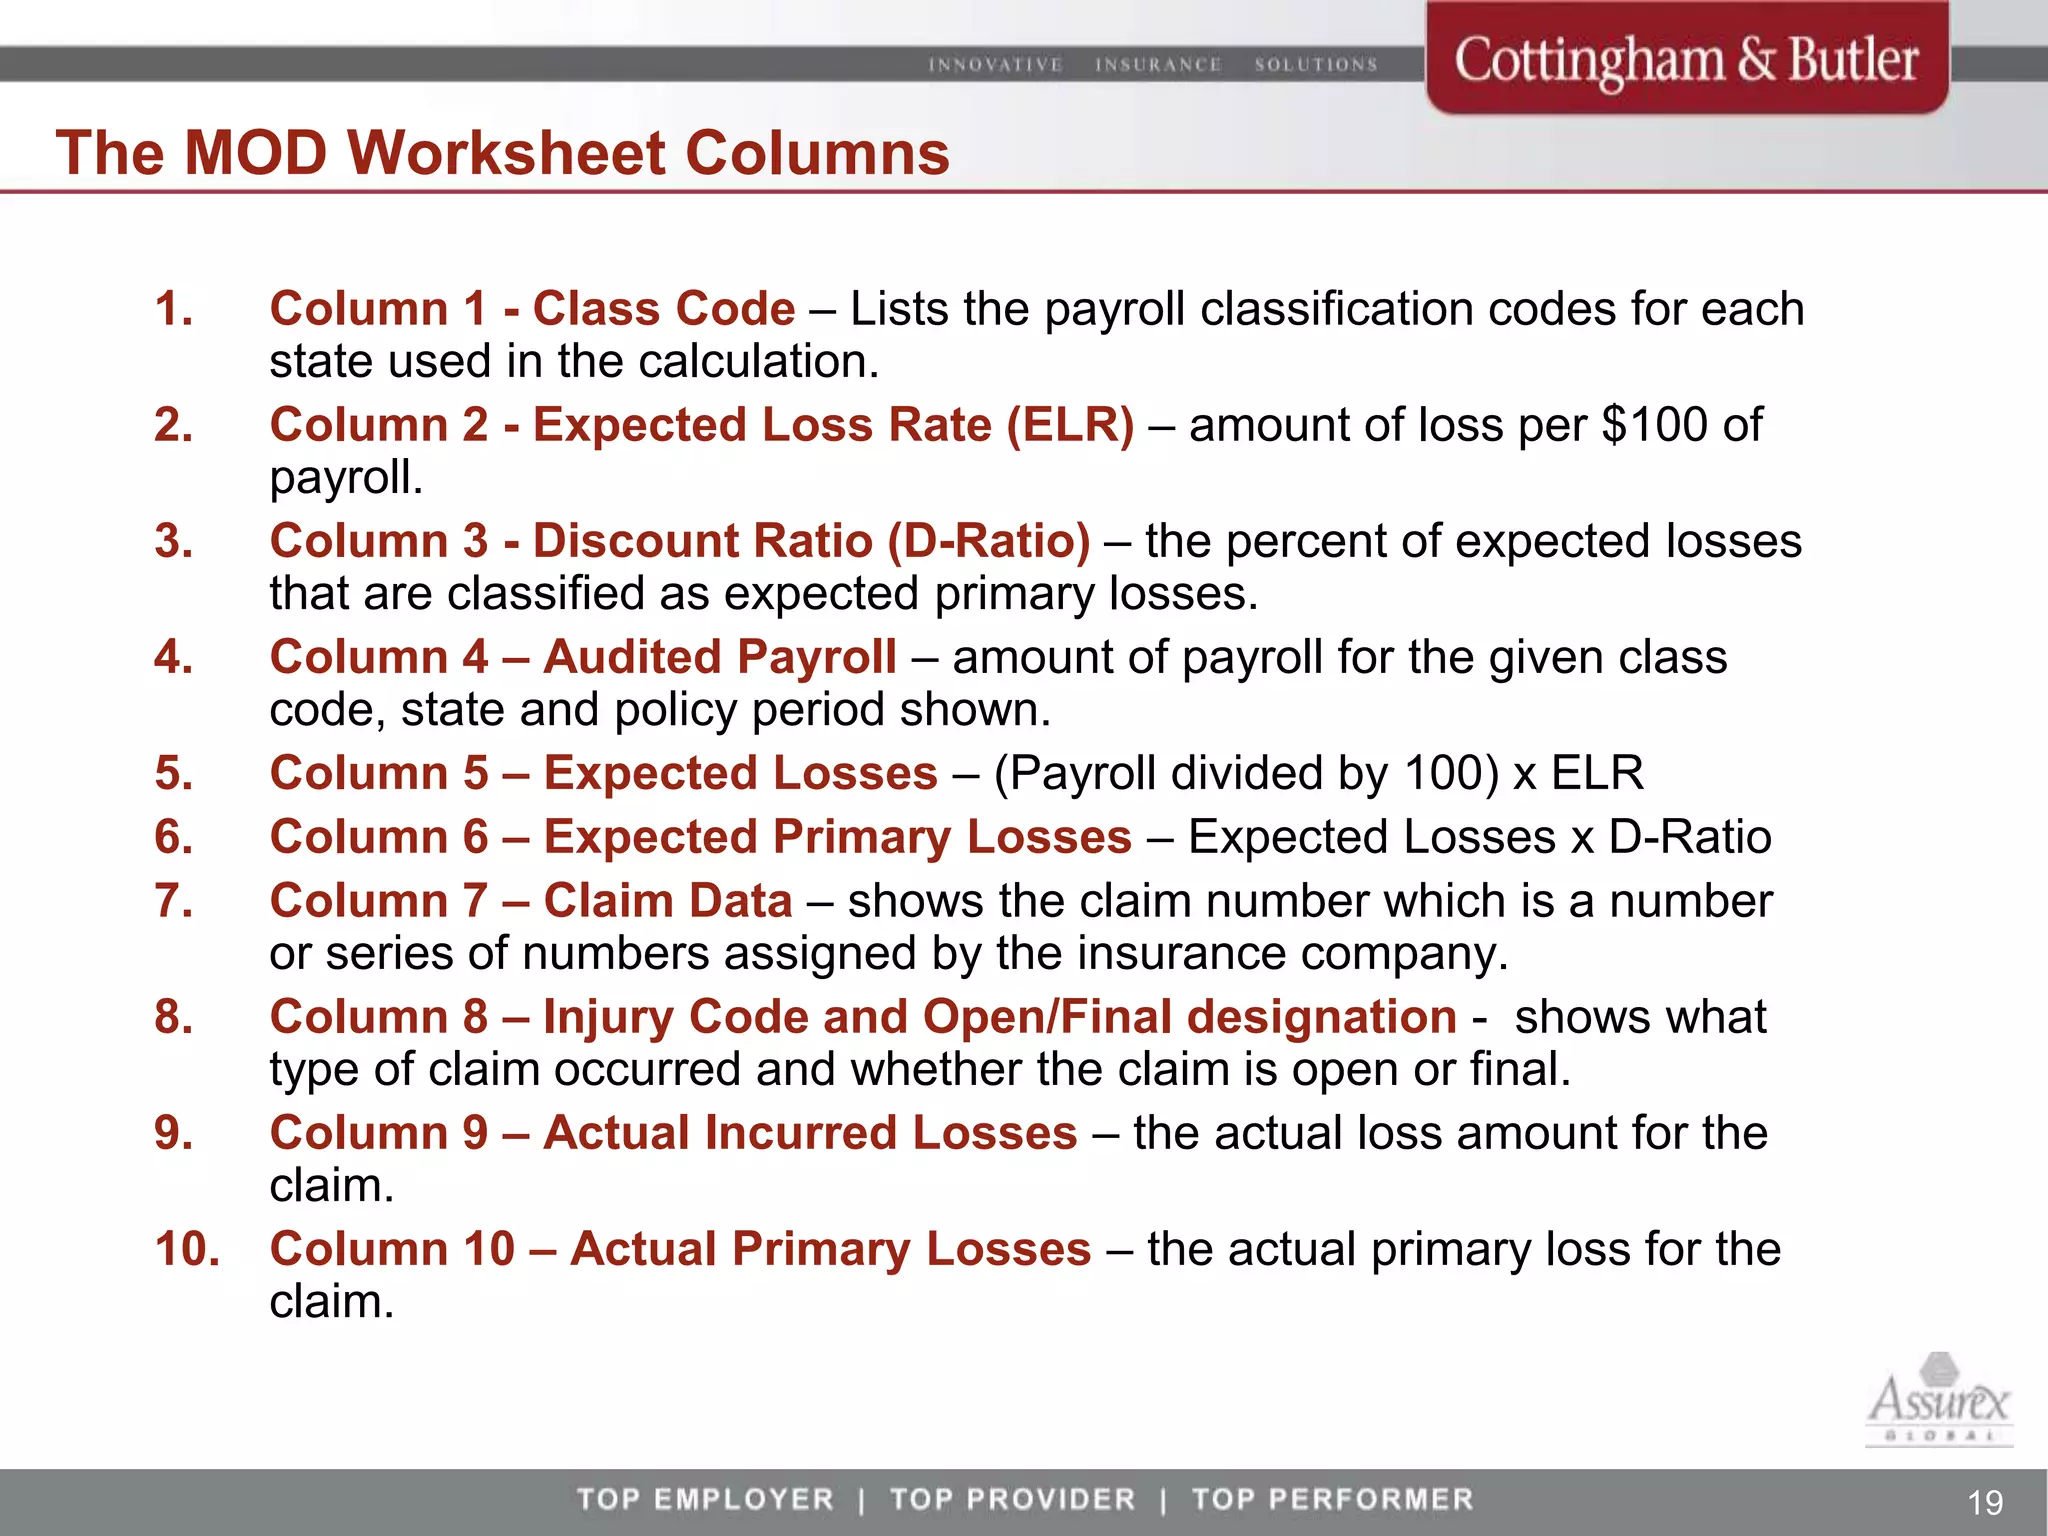
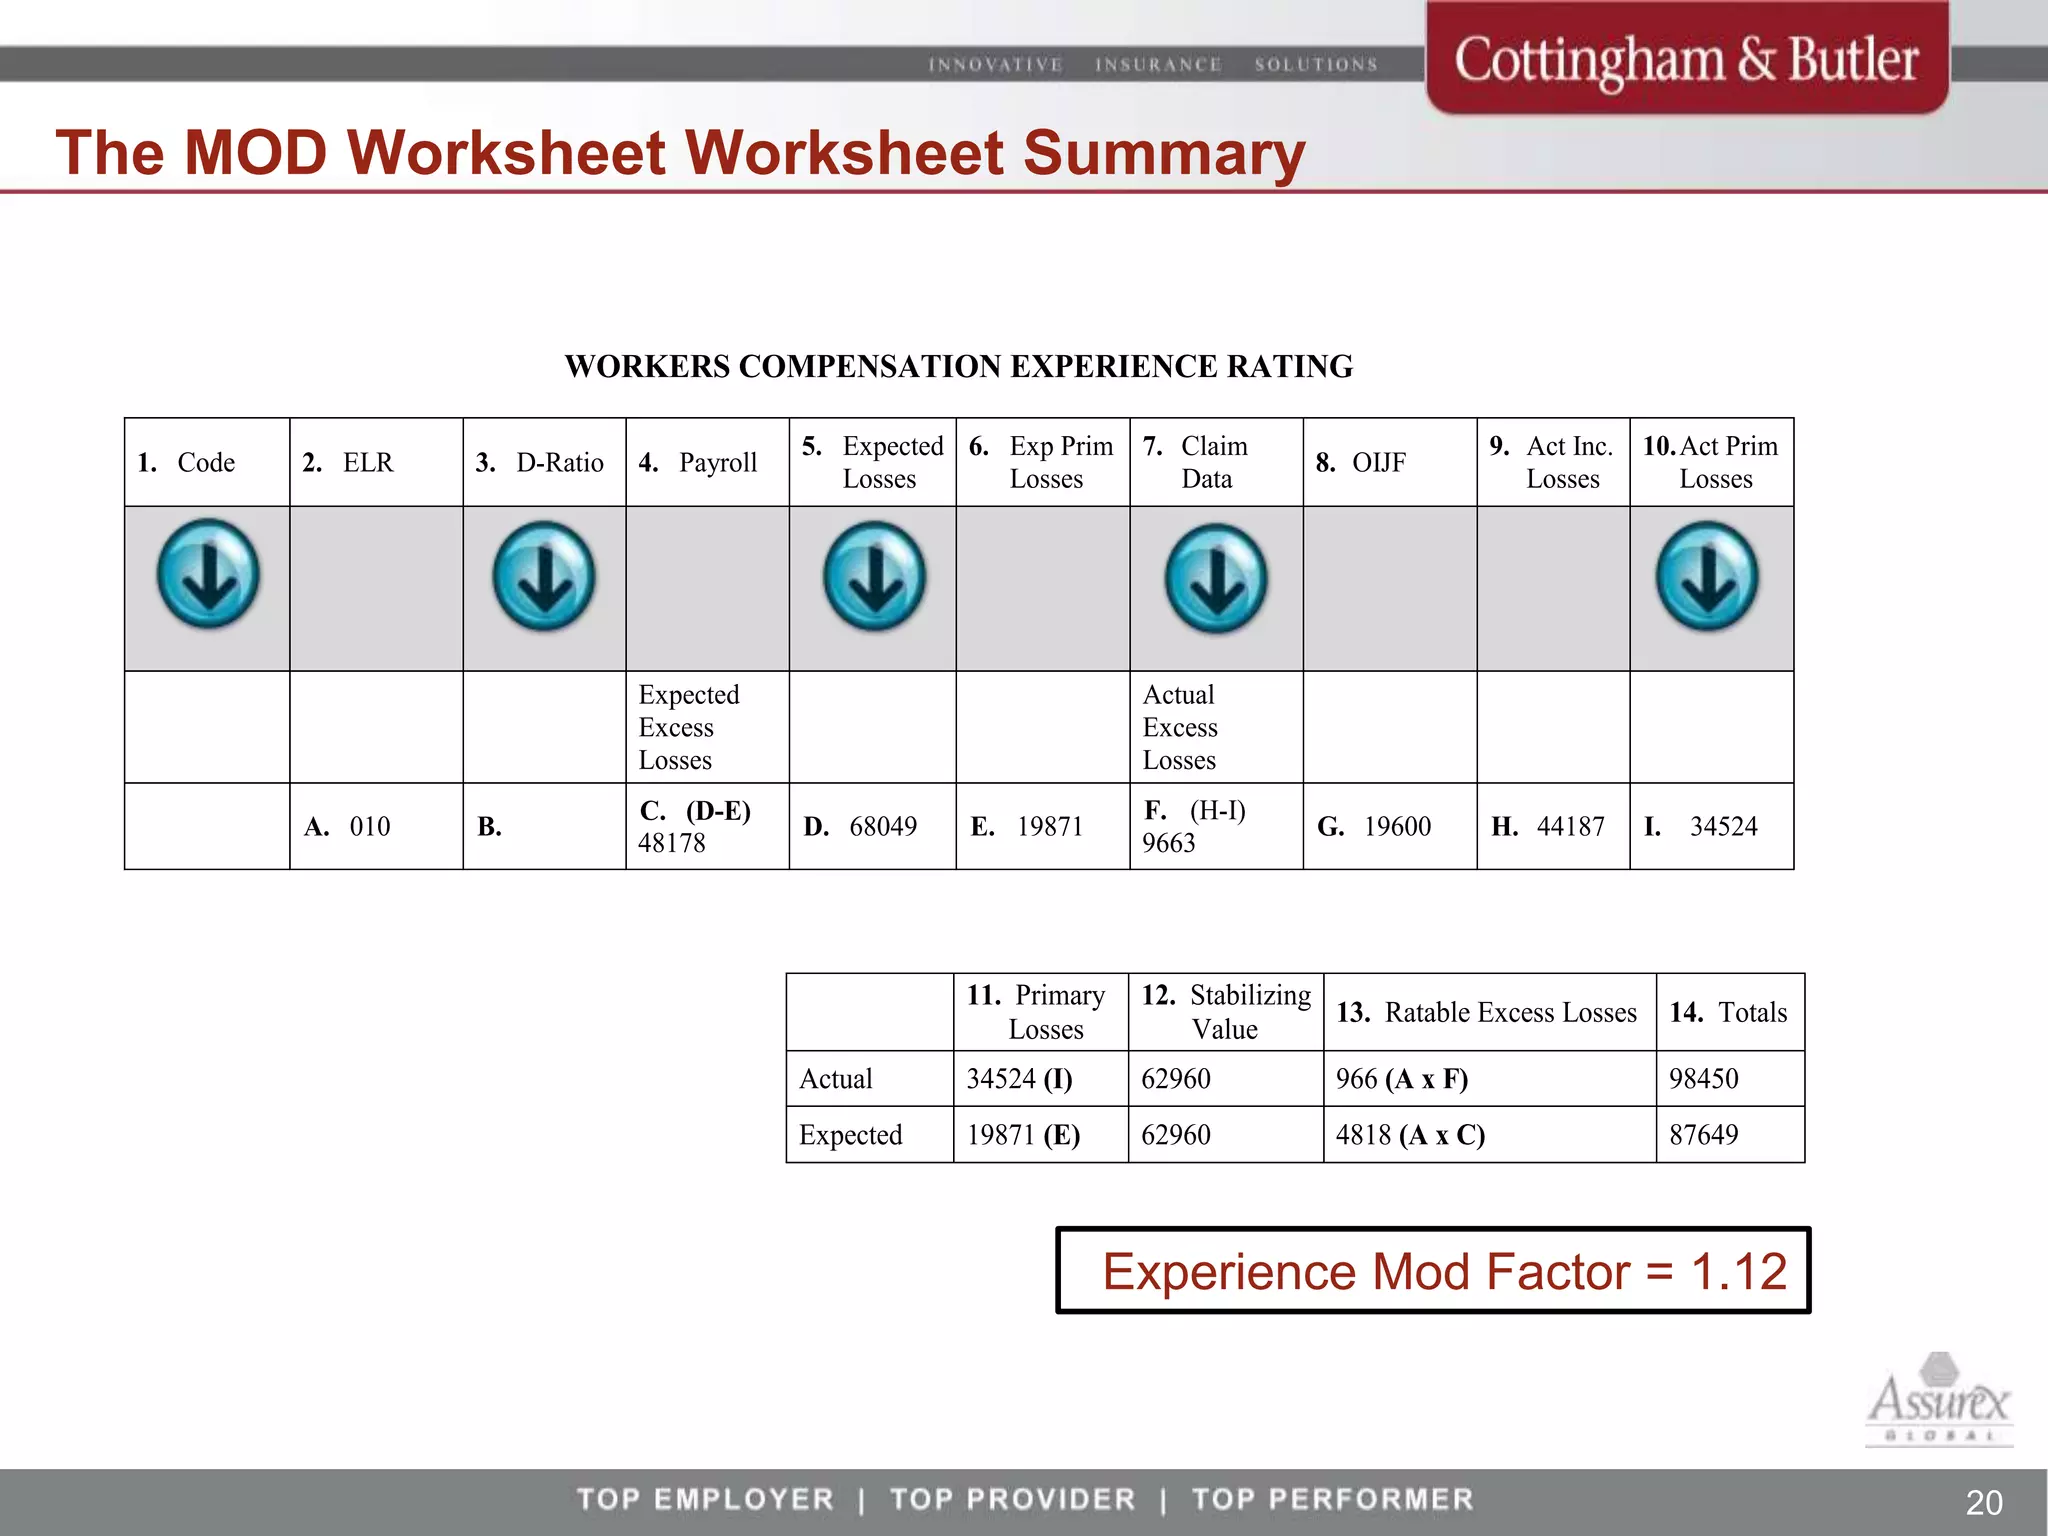
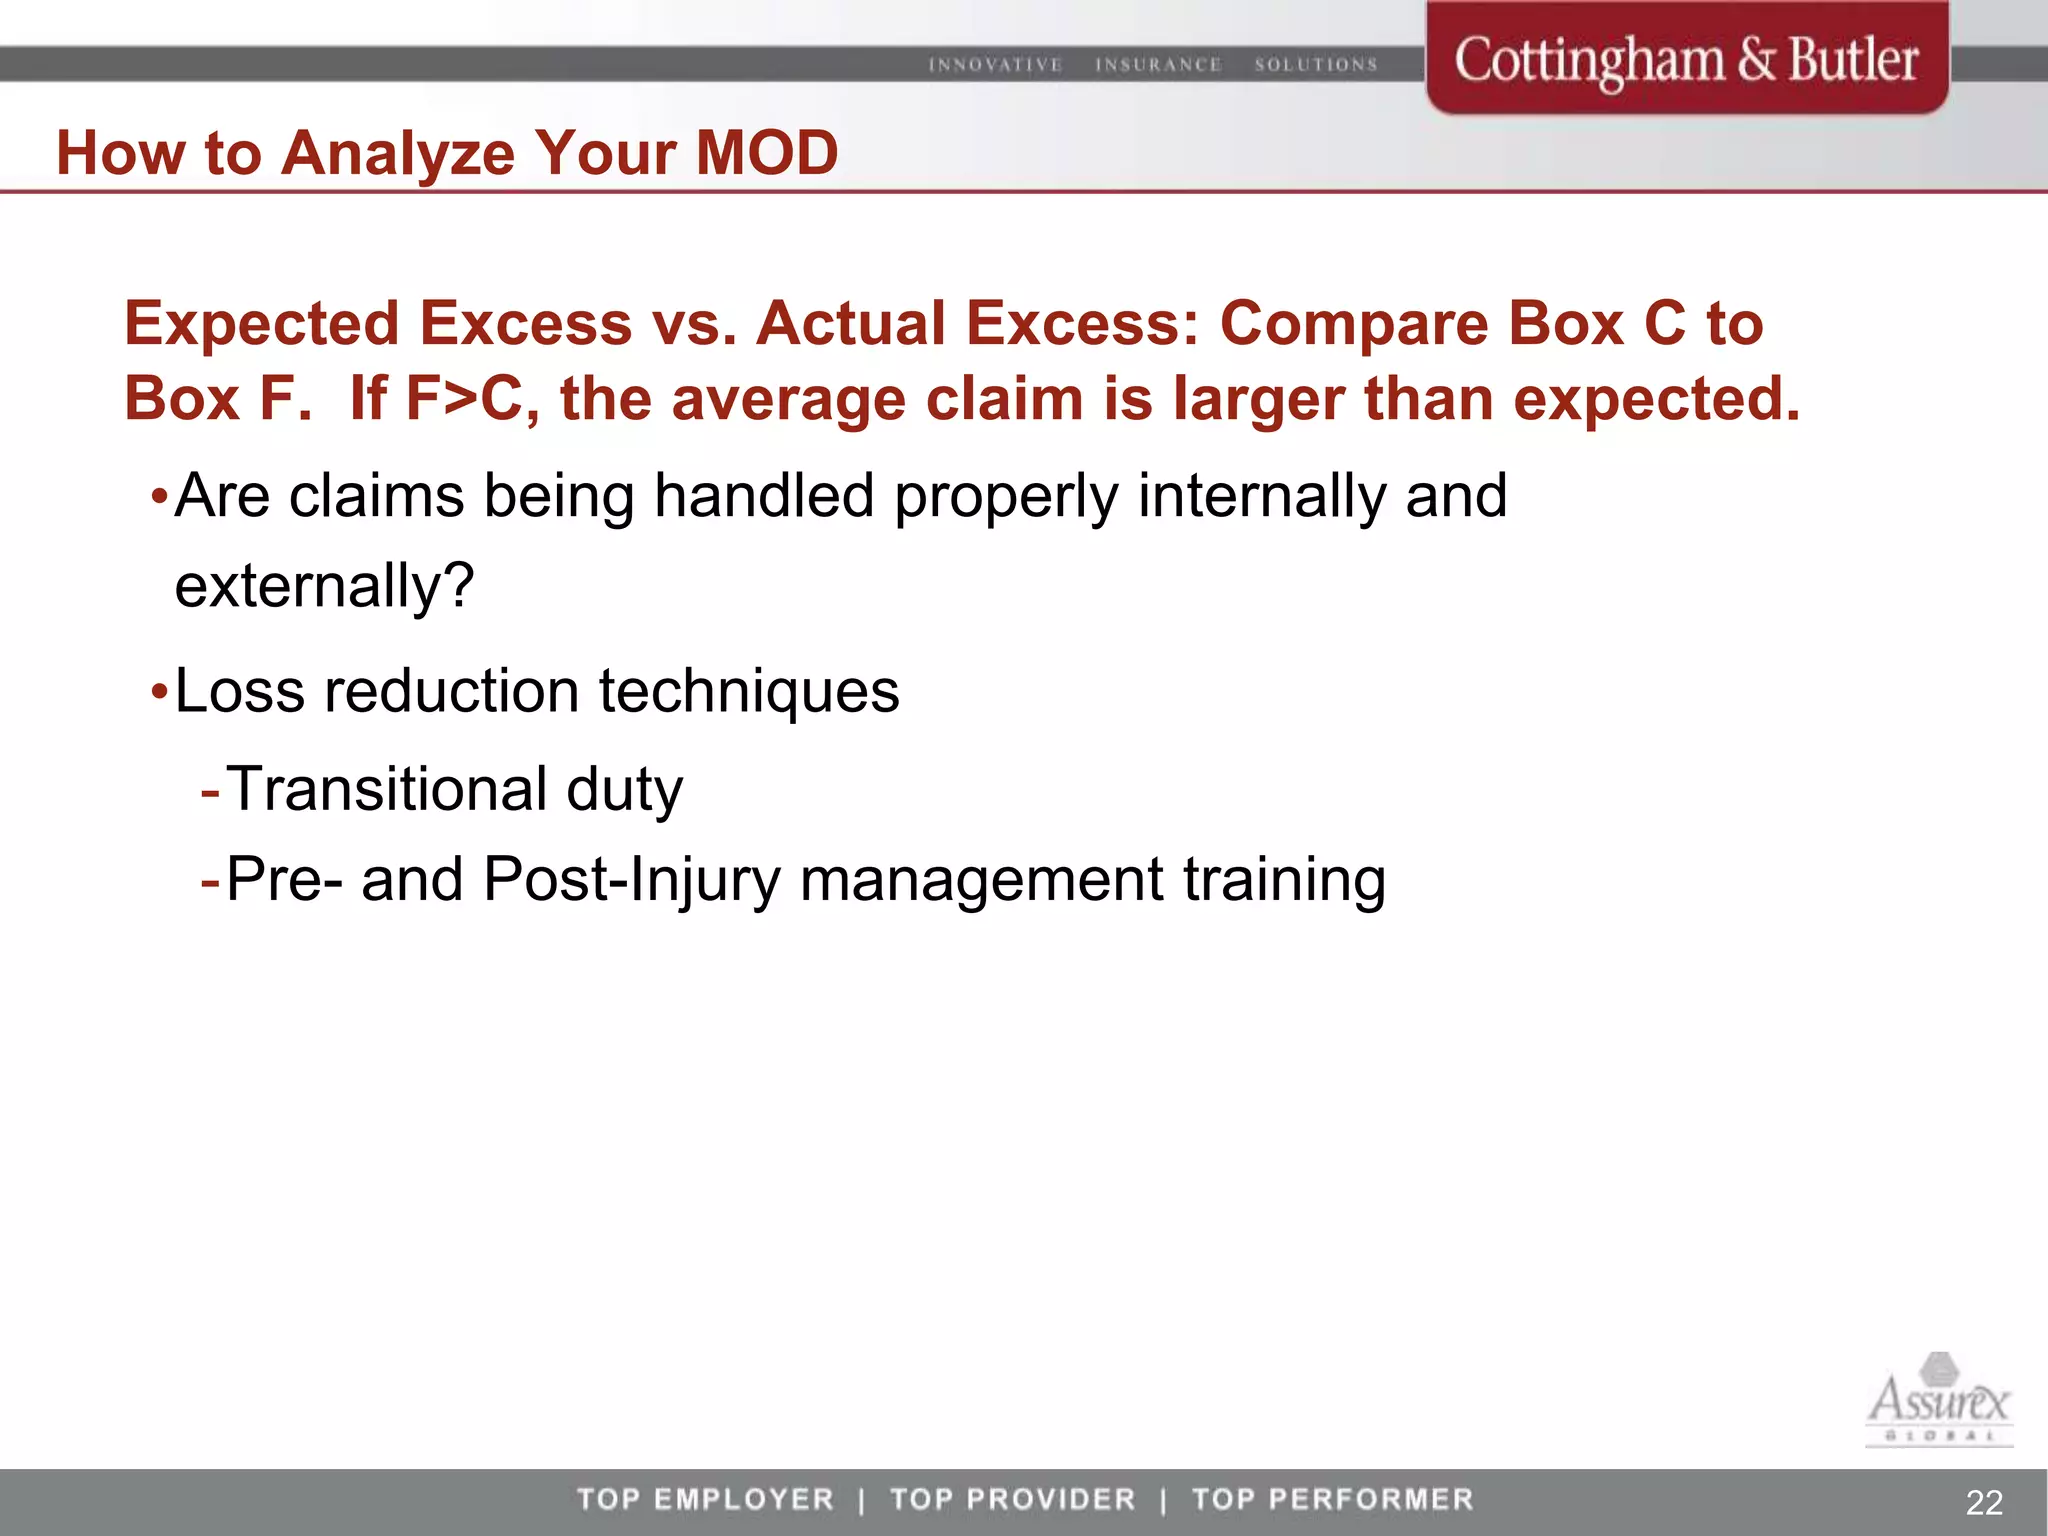
The MOD Factor!
Understanding the Experience Modification Factor
                  Workers’ Compensation Risk Management


Company ABC
                       presented by | John Link, CPCU
Presented by | Your Name(s)
                                   April 19, 2011

                  Cottingham & Butler Benefits Consulting Webinar Series


                                                                           1
Disclaimer:


  The information, examples and suggestions presented in this
  material have been developed from sources believed to be
  reliable, but they should not be construed as legal or other
  professional advice
  Cottingham & Butler accepts no responsibility for the
  accuracy or completeness of this material and recommends
  the consultation with competent legal counsel and/or other
  professional advisors before applying this material in any
  particular factual situations
  Please remember that only the relevant insurance policy can
  provide the actual terms, coverage, amounts, conditions, and
  exclusions for an insured


                                                                 2
Today’s Objectives:


  What is this thing called a “MOD”?
  How does it effect me?
  How do the numbers work?
  How can I predict where the MOD is going?
  What can we do to minimize the MOD going up?


                                                 3
Who We Are

• National provider of employee benefits and risk     John Butler
                                                      Chairman and
management solutions
                                                      Chief Executive Officer
• Established in 1887
• Headquarters in Dubuque, IA (population 60,000)
                                                      David Becker
• Over 3,500 customers                                President and
                                                      Chief Operating Officer
• $350 million in Commercial Insurance premium
placements
• Over $473 million in Benefits Claims Administered
• 38th largest Insurance Broker in US
 Business Insurance Top 100 Brokers

• 95% retention rate across entire book of business
• Posted $63 Million in revenue in 2010
• “2007 Agency of the Year” National Underwriter
• “Agency of the Year” Rough Notes Magazine


                                                                                4
Who I am

                             • Vice President of Risk Management and
                             Tribal Insurance Consulting Practices

                             •13 years with Cottingham & Butler

                             •Graduate of the University of Iowa
       John M. Link
       Vice President        •43 Clients in 6 states managing $30 million
 Risk Management Practice    dollars in premiums
       563-587-5288
jlink@cottinghambutler.com   •Native Dubuquer

                             •Father of 4 and husband of 1


                                                                            5
What Is This Thing Called The “MOD”?

  The “MOD” is short for Experience
  Modification Rating factor.
  It’s actually a system where by frequency of losses is given a
  higher “weight” and thus penalized verses severe losses.
  In the most simple of terms, the MOD is calculated based on
  expected claims versus actual claims, total payroll and classes of
  eligible employees. When the actual primary losses are greater
  than expected primary losses, the MOD is above 1.0 and when the
  actual primary losses are less than expected, primary losses the
  MOD is less than 1.0


                                                                       6
What is this thing called the “MOD”?


  MYTH or MISUNDERSTANDING
   • A 1.0 experience Modification factor by many is considered “good”
   • 1.0 MOD is equivalent to a “C” grade which shouldn’t be acceptable to any
     of us!


                                                                                 7
The Experience MOD Formula

 Actual       +   Ballast Value   +   Weighting Value x   +   (1-Weighting Value x Expected Excess
 Primary                              Actual Excess           Losses
 Losses                               Losses

 Expected     +   Ballast Value   +   Weighting Value x   +   (1-Weighting Value) x Expected Excess
 Primary                              Expected Losses         Losses
 Losses


 • Primary Losses = first $5000 in losses
 • Excess Losses = amount of loss greater than $5000
 • Ballast Value = state specific value which increases with the
   size of the company as measure in expected losses.
   Creates stability to the formula
 • Weighting Value = state specific with range between 0.04 to
   0.80. The value increases as expected losses increase and
   determines the percentage of actual excess losses utilized
   in the calculation


                                                                                                      8
Years MOD is Based Upon


      2007             2008             2009            2010           2011
  J    F     M     J    F     M   J      F     M   J      F    M   J    F     M
  A    M      J   A     M     J   A      M     J   A     M     J   A    M     J
  J    A     S     J    A     S   J      A     S   J      A    S   J    A     S
  O    N     D    O     N     D   O      N     D   O      N    D   O    N     D


             Experience Rating Period                  Excluded    MOD is effective
                                                                    for the 2011
                                                                     policy year


                                                                                  9
How Does The MOD Affect You?

 Ultimately, the MOD is applied to your insurance
 premium.
 The premium you pay will equal the basic premium
 times your MOD.
 So, a MOD below a 1.0 lowers your premium costs and
 a MOD above a 1.0 increases your premium costs
 against your peers and competitors.

 Example: Company A has basic premium of $100,000
 and their experience MOD was 1.20, their final workers’
 compensation premium is $120,000.


                                                           10
Why Is This Important 2.0?

  Take our previous example:
  Company A in 2010 had a MOD of 1.0 and a basic premium of
  $100,000 so final premium in 2010 was $100,000.
  In 2011, their MOD is increasing to a 1.20 with no overall growth
  to the company so basic premium remains at $100,000 but final
  premium is now $120,000.
  At a 5% profit margin, Company A needs to increase top lines
  sales by $400,000 in order to make up that cost increase.
  Is controlling the MOD and loss frequency worth it?


                                                                      11
The MOD Worksheet


                    12
The MOD Worksheet Headers

  1.   Name of the Risk – name of the company for which the
       MOD is calculated

  2.   Risk Identity No. – this is the number NCCI or other rating
       bureau assigns to your company

  3.   State – if your company operates in only one state, the state
       will be displayed. If your company operates in multiple
       states, the word “Interstate” will be displayed

  4.   Effective Date – the date on which the MOD becomes
       effective.


                                                                       13
The MOD Worksheet Columns

  1.   Column 1 - Class Code – lists the payroll classification codes
       for each state used in the calculation.
  2.   Column 2 - Expected Loss Rate (ELR) – amount of loss per
       $100 of payroll.
  3.   Column 3 - Discount Ratio (D-Ratio) – the percent of expected
       losses that are classified as expected primary losses.
  4.   Column 4 – Audited Payroll – amount of payroll for the given
       class code, state and policy period shown.
  5.   Column 5 – Expected Losses – (Payroll divided by 100) x ELR
  6.   Column 6 – Expected Primary Losses – expected Losses x D-
       Ratio
  7.   Column 7 – Claim Data – shows the claim number which is a
       number or series of numbers assigned by the insurance
       company.
  8.   Column 8 – Injury Code and Open/Final designation – shows
       what type of claim occurred and whether the claim is open or
       final.

                                                                        14
Injury Codes


 Injury Code (IJ)   Medical Claim
 IJ Code 1          Death
 IJ Code 2          Permanent Total Disability
 IJ Code 5          Temporary Total or Temporary Partial Disability
 IJ Code 6          Medical Only
 IJ Code 7          Contract Medical or Hospital Allowance
 IJ Code 9          Permanent Partial Disability


                                                                      15
IJ Code 6: Medical Only

  In 1998, the ERA became part of the mod
  calculation!


  No, Not that ERA…

                                            16
IJ Code 6: Medical Only

  In 1998, the Experience Rating Adjustment (ERA) was
  introduced to the MOD calculation
   • Change in primary/excess split point – state specific as in
    California
   • Change in weighting value table – raises maximum value
    from .63 to .80
   • Reduction in Medical-only claim amounts
    -Medical-only claims are calculated at 30% of primary and
     excess of loss value
    -Incentive for employers to report ALL claims without
     being penalized


                                                                   17
Experience Rating Adjustment State Summary
  Approved: Alabama, Arkansas, Arizona, Connecticut, Colorado, District of
  Columbia, Florida, Hawaii, Idaho, Illinois, Indiana, Kansas, Kentucky, Maine,
  Maryland, Michigan, Minnesota, Mississippi, Montana, Nebraska, Nevada, New
  Hampshire, North Carolina, Oklahoma, Rhode Island, South Carolina, South
  Dakota, Tennessee, Utah, Vermont, Virginia, West Virginia and Wisconsin
  If your State is not on this list, approval is pending (essentially
  Disapproved) or formally Disapproved


                                                                                  18
The MOD Worksheet Columns

  1.  Column 1 - Class Code – Lists the payroll classification codes for each
      state used in the calculation.
  2.  Column 2 - Expected Loss Rate (ELR) – amount of loss per $100 of
      payroll.
  3.  Column 3 - Discount Ratio (D-Ratio) – the percent of expected losses
      that are classified as expected primary losses.
  4.  Column 4 – Audited Payroll – amount of payroll for the given class
      code, state and policy period shown.
  5.  Column 5 – Expected Losses – (Payroll divided by 100) x ELR
  6.  Column 6 – Expected Primary Losses – Expected Losses x D-Ratio
  7.  Column 7 – Claim Data – shows the claim number which is a number
      or series of numbers assigned by the insurance company.
  8.  Column 8 – Injury Code and Open/Final designation - shows what
      type of claim occurred and whether the claim is open or final.
  9.  Column 9 – Actual Incurred Losses – the actual loss amount for the
      claim.
  10. Column 10 – Actual Primary Losses – the actual primary loss for the
      claim.


                                                                                19
The MOD Worksheet Worksheet Summary


                           WORKERS COMPENSATION EXPERIENCE RATING

                                               5. Expected 6. Exp Prim   7. Claim                       9. Act Inc.   10. Act Prim
  1. Code   2. ELR   3. D-Ratio   4. Payroll                                           8. OIJF
                                                  Losses      Losses        Data                           Losses         Losses


                                  Expected                               Actual
                                  Excess                                 Excess
                                  Losses                                 Losses
                                  C. (D-E)                               F. (H-I)
            A. 010   B.                        D. 68049    E. 19871                    G. 19600         H. 44187      I.    34524
                                  48178                                  9663


                                                           11. Primary   12. Stabilizing
                                                                                         13. Ratable Excess Losses         14. Totals
                                                              Losses         Value
                                               Actual      34524 (I)     62960           966 (A x F)                       98450
                                               Expected    19871 (E)     62960           4818 (A x C)                      87649


                                                                       Experience Mod Factor = 1.12


                                                                                                                                        20
How to Analyze Your MOD

 Expected vs. Actual: Compare Box D to Box H. If H > D, then your
 competition is outperforming you.
 Expected Primary vs. Actual Primary: Compare Box E to Box I. Primary
 losses are a measure of loss frequency and have a greater impact on the
 MOD.

  • Training issues

  • Poor Procedures

  • Hazardous Work Environment


                                                                           21
How to Analyze Your MOD

 Expected Excess vs. Actual Excess: Compare Box C to
 Box F. If F>C, the average claim is larger than expected.
  •Are claims being handled properly internally and
   externally?
  •Loss reduction techniques
    -Transitional duty
    -Pre- and Post-Injury management training


                                                             22
How to Analyze Your MOD

 Determine your Minimum MOD.
 Determine your Controllable MOD
 Ratio of Actual to Expected Losses
 Specific Loss Sensitivity – by loss type
 Aggregate Loss Sensitivity – losses overall


                                               23
Ways to Control Your MOD

  Implement and Manage a Sound Loss-Control Program
  •Lower frequency
  •Reduces severity
  •e.g. Safety committees, training, safety bonuses/incentives,
   communication


  Verify Accuracy of Payroll and Loss Data
  •Data is often incorrect
  •Claim review approximately 5 months into policy year


                                                                  24
In Summary

 The MOD is a complex formula
 The MOD Worksheet is a valuable tool to identify the issues within
 your overall safety program
 The MOD is controllable
 The MOD needs to be reviewed and audited for accuracy (codes,
 payroll, loss totals, etc)


                                                                      25
THANK YOU & BE SAFE TODAY!
  If you have any further questions please contact me at:

  John M. Link, CPCU
  Risk Management Group, Vice President

  ph: 563.587.5288
  800.793.5235 ext: 5288
  jlink@cottinghambutler.com


                                                            26

The Experience Mod

  • 1.
    The MOD Factor! Understandingthe Experience Modification Factor Workers’ Compensation Risk Management Company ABC presented by | John Link, CPCU Presented by | Your Name(s) April 19, 2011 Cottingham & Butler Benefits Consulting Webinar Series 1
  • 2.
    Disclaimer: Theinformation, examples and suggestions presented in this material have been developed from sources believed to be reliable, but they should not be construed as legal or other professional advice Cottingham & Butler accepts no responsibility for the accuracy or completeness of this material and recommends the consultation with competent legal counsel and/or other professional advisors before applying this material in any particular factual situations Please remember that only the relevant insurance policy can provide the actual terms, coverage, amounts, conditions, and exclusions for an insured 2
  • 3.
    Today’s Objectives: What is this thing called a “MOD”? How does it effect me? How do the numbers work? How can I predict where the MOD is going? What can we do to minimize the MOD going up? 3
  • 4.
    Who We Are •National provider of employee benefits and risk John Butler Chairman and management solutions Chief Executive Officer • Established in 1887 • Headquarters in Dubuque, IA (population 60,000) David Becker • Over 3,500 customers President and Chief Operating Officer • $350 million in Commercial Insurance premium placements • Over $473 million in Benefits Claims Administered • 38th largest Insurance Broker in US Business Insurance Top 100 Brokers • 95% retention rate across entire book of business • Posted $63 Million in revenue in 2010 • “2007 Agency of the Year” National Underwriter • “Agency of the Year” Rough Notes Magazine 4
  • 5.
    Who I am • Vice President of Risk Management and Tribal Insurance Consulting Practices •13 years with Cottingham & Butler •Graduate of the University of Iowa John M. Link Vice President •43 Clients in 6 states managing $30 million Risk Management Practice dollars in premiums 563-587-5288 jlink@cottinghambutler.com •Native Dubuquer •Father of 4 and husband of 1 5
  • 6.
    What Is ThisThing Called The “MOD”? The “MOD” is short for Experience Modification Rating factor. It’s actually a system where by frequency of losses is given a higher “weight” and thus penalized verses severe losses. In the most simple of terms, the MOD is calculated based on expected claims versus actual claims, total payroll and classes of eligible employees. When the actual primary losses are greater than expected primary losses, the MOD is above 1.0 and when the actual primary losses are less than expected, primary losses the MOD is less than 1.0 6
  • 7.
    What is thisthing called the “MOD”? MYTH or MISUNDERSTANDING • A 1.0 experience Modification factor by many is considered “good” • 1.0 MOD is equivalent to a “C” grade which shouldn’t be acceptable to any of us! 7
  • 8.
    The Experience MODFormula Actual + Ballast Value + Weighting Value x + (1-Weighting Value x Expected Excess Primary Actual Excess Losses Losses Losses Expected + Ballast Value + Weighting Value x + (1-Weighting Value) x Expected Excess Primary Expected Losses Losses Losses • Primary Losses = first $5000 in losses • Excess Losses = amount of loss greater than $5000 • Ballast Value = state specific value which increases with the size of the company as measure in expected losses. Creates stability to the formula • Weighting Value = state specific with range between 0.04 to 0.80. The value increases as expected losses increase and determines the percentage of actual excess losses utilized in the calculation 8
  • 9.
    Years MOD isBased Upon 2007 2008 2009 2010 2011 J F M J F M J F M J F M J F M A M J A M J A M J A M J A M J J A S J A S J A S J A S J A S O N D O N D O N D O N D O N D Experience Rating Period Excluded MOD is effective for the 2011 policy year 9
  • 10.
    How Does TheMOD Affect You? Ultimately, the MOD is applied to your insurance premium. The premium you pay will equal the basic premium times your MOD. So, a MOD below a 1.0 lowers your premium costs and a MOD above a 1.0 increases your premium costs against your peers and competitors. Example: Company A has basic premium of $100,000 and their experience MOD was 1.20, their final workers’ compensation premium is $120,000. 10
  • 11.
    Why Is ThisImportant 2.0? Take our previous example: Company A in 2010 had a MOD of 1.0 and a basic premium of $100,000 so final premium in 2010 was $100,000. In 2011, their MOD is increasing to a 1.20 with no overall growth to the company so basic premium remains at $100,000 but final premium is now $120,000. At a 5% profit margin, Company A needs to increase top lines sales by $400,000 in order to make up that cost increase. Is controlling the MOD and loss frequency worth it? 11
  • 12.
  • 13.
    The MOD WorksheetHeaders 1. Name of the Risk – name of the company for which the MOD is calculated 2. Risk Identity No. – this is the number NCCI or other rating bureau assigns to your company 3. State – if your company operates in only one state, the state will be displayed. If your company operates in multiple states, the word “Interstate” will be displayed 4. Effective Date – the date on which the MOD becomes effective. 13
  • 14.
    The MOD WorksheetColumns 1. Column 1 - Class Code – lists the payroll classification codes for each state used in the calculation. 2. Column 2 - Expected Loss Rate (ELR) – amount of loss per $100 of payroll. 3. Column 3 - Discount Ratio (D-Ratio) – the percent of expected losses that are classified as expected primary losses. 4. Column 4 – Audited Payroll – amount of payroll for the given class code, state and policy period shown. 5. Column 5 – Expected Losses – (Payroll divided by 100) x ELR 6. Column 6 – Expected Primary Losses – expected Losses x D- Ratio 7. Column 7 – Claim Data – shows the claim number which is a number or series of numbers assigned by the insurance company. 8. Column 8 – Injury Code and Open/Final designation – shows what type of claim occurred and whether the claim is open or final. 14
  • 15.
    Injury Codes InjuryCode (IJ) Medical Claim IJ Code 1 Death IJ Code 2 Permanent Total Disability IJ Code 5 Temporary Total or Temporary Partial Disability IJ Code 6 Medical Only IJ Code 7 Contract Medical or Hospital Allowance IJ Code 9 Permanent Partial Disability 15
  • 16.
    IJ Code 6:Medical Only In 1998, the ERA became part of the mod calculation! No, Not that ERA… 16
  • 17.
    IJ Code 6:Medical Only In 1998, the Experience Rating Adjustment (ERA) was introduced to the MOD calculation • Change in primary/excess split point – state specific as in California • Change in weighting value table – raises maximum value from .63 to .80 • Reduction in Medical-only claim amounts -Medical-only claims are calculated at 30% of primary and excess of loss value -Incentive for employers to report ALL claims without being penalized 17
  • 18.
    Experience Rating AdjustmentState Summary Approved: Alabama, Arkansas, Arizona, Connecticut, Colorado, District of Columbia, Florida, Hawaii, Idaho, Illinois, Indiana, Kansas, Kentucky, Maine, Maryland, Michigan, Minnesota, Mississippi, Montana, Nebraska, Nevada, New Hampshire, North Carolina, Oklahoma, Rhode Island, South Carolina, South Dakota, Tennessee, Utah, Vermont, Virginia, West Virginia and Wisconsin If your State is not on this list, approval is pending (essentially Disapproved) or formally Disapproved 18
  • 19.
    The MOD WorksheetColumns 1. Column 1 - Class Code – Lists the payroll classification codes for each state used in the calculation. 2. Column 2 - Expected Loss Rate (ELR) – amount of loss per $100 of payroll. 3. Column 3 - Discount Ratio (D-Ratio) – the percent of expected losses that are classified as expected primary losses. 4. Column 4 – Audited Payroll – amount of payroll for the given class code, state and policy period shown. 5. Column 5 – Expected Losses – (Payroll divided by 100) x ELR 6. Column 6 – Expected Primary Losses – Expected Losses x D-Ratio 7. Column 7 – Claim Data – shows the claim number which is a number or series of numbers assigned by the insurance company. 8. Column 8 – Injury Code and Open/Final designation - shows what type of claim occurred and whether the claim is open or final. 9. Column 9 – Actual Incurred Losses – the actual loss amount for the claim. 10. Column 10 – Actual Primary Losses – the actual primary loss for the claim. 19
  • 20.
    The MOD WorksheetWorksheet Summary WORKERS COMPENSATION EXPERIENCE RATING 5. Expected 6. Exp Prim 7. Claim 9. Act Inc. 10. Act Prim 1. Code 2. ELR 3. D-Ratio 4. Payroll 8. OIJF Losses Losses Data Losses Losses Expected Actual Excess Excess Losses Losses C. (D-E) F. (H-I) A. 010 B. D. 68049 E. 19871 G. 19600 H. 44187 I. 34524 48178 9663 11. Primary 12. Stabilizing 13. Ratable Excess Losses 14. Totals Losses Value Actual 34524 (I) 62960 966 (A x F) 98450 Expected 19871 (E) 62960 4818 (A x C) 87649 Experience Mod Factor = 1.12 20
  • 21.
    How to AnalyzeYour MOD Expected vs. Actual: Compare Box D to Box H. If H > D, then your competition is outperforming you. Expected Primary vs. Actual Primary: Compare Box E to Box I. Primary losses are a measure of loss frequency and have a greater impact on the MOD. • Training issues • Poor Procedures • Hazardous Work Environment 21
  • 22.
    How to AnalyzeYour MOD Expected Excess vs. Actual Excess: Compare Box C to Box F. If F>C, the average claim is larger than expected. •Are claims being handled properly internally and externally? •Loss reduction techniques -Transitional duty -Pre- and Post-Injury management training 22
  • 23.
    How to AnalyzeYour MOD Determine your Minimum MOD. Determine your Controllable MOD Ratio of Actual to Expected Losses Specific Loss Sensitivity – by loss type Aggregate Loss Sensitivity – losses overall 23
  • 24.
    Ways to ControlYour MOD Implement and Manage a Sound Loss-Control Program •Lower frequency •Reduces severity •e.g. Safety committees, training, safety bonuses/incentives, communication Verify Accuracy of Payroll and Loss Data •Data is often incorrect •Claim review approximately 5 months into policy year 24
  • 25.
    In Summary TheMOD is a complex formula The MOD Worksheet is a valuable tool to identify the issues within your overall safety program The MOD is controllable The MOD needs to be reviewed and audited for accuracy (codes, payroll, loss totals, etc) 25
  • 26.
    THANK YOU &BE SAFE TODAY! If you have any further questions please contact me at: John M. Link, CPCU Risk Management Group, Vice President ph: 563.587.5288 800.793.5235 ext: 5288 jlink@cottinghambutler.com 26